
企业异质性与中国对外直接投资——基于中国微观企业数据的研究
|
高菠阳(1984—),女,吉林长春人,博士,副教授。主要研究方向为产业空间组织和区域发展。E-mail:cufegaoboyang@163.com。 |
收稿日期: 2019-01-11
修回日期: 2019-07-22
网络出版日期: 2025-04-18
基金资助
国家自然科学基金项目(41530751)
国家自然科学基金项目(41871115)
中国科学院战略性先导科技专项(XDA20010102)
中国科学院重点部署项目(KFZD-SW-321)
Enterprise Heterogeneity and Chinese Foreign Direct Investment:A Study Based on the Data of Microenterprises in China
Received date: 2019-01-11
Revised date: 2019-07-22
Online published: 2025-04-18
“一带一路”倡议的提出,促成了我国对外开放格局从“引进为主”向高水平“引进来”和大规模“走出去”并重的重要转变。加强对外直接投资,成为实现中国产业转型,提升国际竞争力,实现与沿线国家共同繁荣的重要途径。近年来,中国对外直接投资水平平稳增长,模式不断创新。企业作为重要的对外投资载体,其投资质量、投资效益及国际化经营水平逐年提升。文章利用亚太企业库和中国工业企业统计数据库数据,在探究“一带一路”倡议提出以来,中国企业对外直接投资演化的时空格局及行业特征的基础上,利用Logit及Probit回归模型检验包括企业生产率、所处地区、所属行业等属性在内的企业异质性因素对其对外直接投资行为决策的影响。研究发现:①除传统理论提出的生产率外,企业的出口经验、创新研发水平等因素对其对外直接投资决策同样起重要作用。②公司是否上市对企业对外直接投资的影响不显著,在“一带一路”背景下,企业融资筹资手段更加多元化,股权融资并未对企业进行对外直接投资产生直接影响。③东部地区企业所有制结构作用不显著,企业对外直接投资决策主要受生产率和经营情况等因素影响,但中西部地区中,国有企业更倾向于进行对外直接投资,企业所有制结构作用较为显著。同时,行业特性也对企业对外直接投资的影响因素带来差异化特征。
高菠阳 , 尉翔宇 , 黄志基 , 冯锐 , 刘卫东 . 企业异质性与中国对外直接投资——基于中国微观企业数据的研究[J]. 经济地理, 2019 , 39(10) : 130 -138 . DOI: 10.15957/j.cnki.jjdl.2019.10.017
The Belt and Road Initiative has led to the transformation of China's opening up pattern from the investment introduction to high level introduction and the large-scale "going out". Strengthening Chinese foreign direct investment has become an important way to realize industrial transformation, enhance international competitiveness and achieve common prosperity with the countries along the route. In recent years, the level of China's outward FDI has increased steadily and the mode has been innovating constantly. As an important carrier of foreign investment, the quality of investment and international operation level of enterprises have been improved year by year. Based on the data from the Asia Pacific enterprise database and China Industrial Enterprise Statistics database, this study explored the impact of heterogeneous factors on the decision making of foreign direct investment by using Logit regression model and Probit regression model, including enterprise productivity, region, industry, etc. The study found that: 1) In addition to the productivity put forward by traditional theory, the export experience of enterprises, the level of innovation and R&D and other factors also play an important role in their FDI decision-making. 2) Under the background of "one belt and one road", the financing means of enterprises are more diversified,whether going public has no significant impact on the outward foreign direct investment of enterprises and equity financing does not directly affect the outward direct investment of enterprises. 3) The role of enterprise ownership structure in eastern regions is not significant, and the decision-making of enterprises' foreign direct investment is mainly influenced by productivity and operating conditions. However, in the central and western regions, state-owned enterprises tend to make foreign direct investment, and the role of enterprise ownership structure is more significant. At the same time, industry characteristics also bring different characteristics to the influencing factors of FDI.
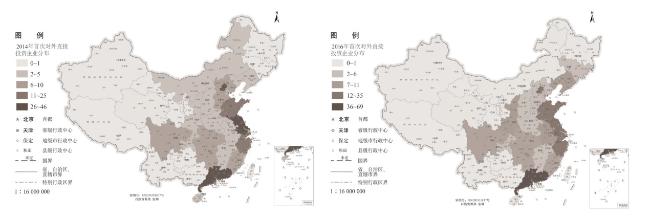
图2 2014、2016年各省首次对外投资企业个数Fig.2 Number of first foreign investment enterprises in 2014 and 2016 |
表1 2014—2016年我国企业首次对外投资空间分布情况Tab.1 Spatial distribution of China’s enterprises’first outward investment from 2014 to 2016 |
| 年份 | 东部 | 中部 | 西部 | 东北 | 总计 | |||||||||
|---|---|---|---|---|---|---|---|---|---|---|---|---|---|---|
| 数量/个 | 占比/% | 数量/个 | 占比/% | 数量/个 | 占比/% | 数量/个 | 占比/% | 数量/个 | 占比/% | |||||
| 2014 | 202 | 78.91 | 29 | 11.33 | 19 | 7.42 | 6 | 2.34 | 256 | 100 | ||||
| 2015 | 453 | 80.46 | 51 | 9.06 | 44 | 7.82 | 15 | 2.66 | 563 | 100 | ||||
| 2016 | 210 | 73.43 | 43 | 15.03 | 20 | 6.99 | 13 | 4.55 | 286 | 100 | ||||
数据来源:Oriana数据库。 |
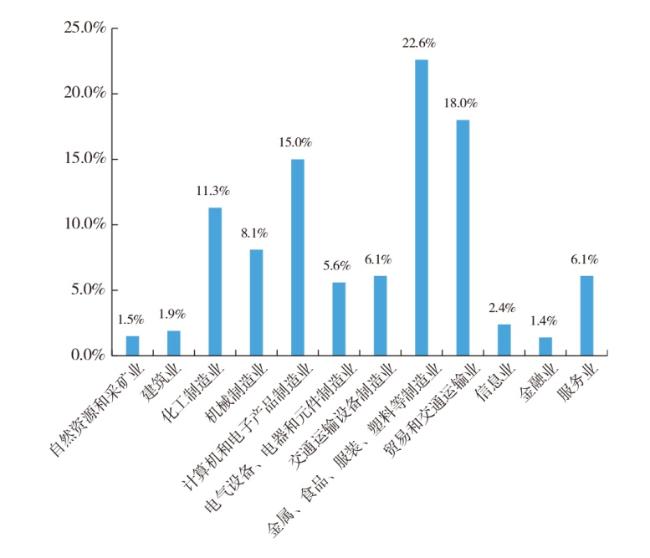
表2 2014—2016年末首次对外投资企业行业构成情况Tab.2 The composition of the industry of the first foreign-invested enterprises from 2014 to the end of 2016 |
| 行业 | 数量/家 | 比重/% |
|---|---|---|
| 金属、食品、服装、塑料等制造业 | 250 | 22.6 |
| 贸易和交通运输业 | 199 | 18.0 |
| 计算机和电子产品制造业 | 166 | 15.0 |
| 化工制造业 | 125 | 11.3 |
| 机械制造业 | 90 | 8.1 |
| 交通运输设备制造业 | 67 | 6.1 |
| 服务业 | 67 | 6.1 |
| 电气设备、电器和元件制造业 | 62 | 5.6 |
| 信息业 | 27 | 2.4 |
| 建筑业 | 21 | 1.9 |
| 自然资源和采矿业 | 16 | 1.5 |
| 金融业 | 15 | 1.4 |
| 合计 | 1 105 | 100.0 |
注:1.行业分类依据Oriana数据库标准。2.数据来源于Oriana数据库。 |
表3 变量定义Tab.3 Definitions of variables |
| 变量名 | 变量描述 |
|---|---|
| 是否对外直接投资 | 企业是否在对外直接投资企业名录(0~1变量),滞后一期 |
| 生产率 | 企业数据计算得到的TFP |
| 是否上市 | 企业上市情况(0~1变量) |
| 是否出口 | 企业是否有出口交货值(0~1变量),滞后三期 |
| 企业规模 | 企业拥有子公司的数量 |
| 是否有创新产出 | 企业是否拥有专利/商标(0~1变量) |
| 资本密集度 | 企业数据计算得到的CI |
| 是否是国有企业 | 企业是否为国有企业/集体企业(0~1变量) |
| 经营年限 | 数据年度—企业成立时间 |
| 运营情况 | 企业净利润率 |
| 时间固定效应 | 年份的虚拟变量(3个年份) |
| 区位固定效应 | 区位的虚拟变量(6个区位) |
| 行业固定效应 | 行业的虚拟变量(12个行业) |
表4 回归结果Tab.4 Regression results |
| 变量 | Logit模型 | Probit模型 | |||||||
|---|---|---|---|---|---|---|---|---|---|
| (1) | (2) | (3) | (4) | (1) | (2) | (3) | (4) | ||
| 生产率 | 0.0531** | 0.0485* | 0.0498* | 0.0484* | 0.0253** | 0.0233* | 0.0237* | 0.0230* | |
| (0.0256) | (0.0259) | (0.0259) | (0.026) | (0.0125) | (0.0126) | (0.0126) | (0.0127) | ||
| 公司规模 | 0.0216*** | 0.0212*** | 0.0214*** | 0.0215*** | 0.0106*** | 0.0105*** | 0.0105*** | 0.0105*** | |
| (0.00126) | (0.00126) | (0.00126) | (0.00126) | (0.000549) | (0.000554) | (0.000556) | (0.000558) | ||
| 是否上市 | 0.0937 | 0.0894 | 0.0872 | 0.0596 | 0.0544* | 0.0516 | 0.0499 | 0.0354 | |
| (0.0671) | (0.0675) | (0.0676) | (0.0716) | (0.0326) | (0.0328) | (0.0329) | (0.0348) | ||
| 是否出口 | 0.497*** | 0.504*** | 0.501*** | 0.508*** | 0.255*** | 0.254*** | 0.253*** | 0.254*** | |
| (0.09) | (0.0905) | (0.0909) | (0.091) | (0.0456) | (0.0461) | (0.0463) | (0.0463) | ||
| 是否有创新产出 | 1.092*** | 1.092*** | 1.095*** | 1.097*** | 0.519*** | 0.521*** | 0.522*** | 0.523*** | |
| (0.0698) | (0.07) | (0.0703) | (0.0704) | (0.0328) | (0.0331) | (0.0333) | (0.0333) | ||
| 经营情况 | 0.00911*** | 0.00927*** | 0.00945*** | 0.00939*** | 0.00420*** | 0.00436*** | 0.00445*** | 0.00444*** | |
| (0.0023) | (0.0023) | (0.00231) | (0.00232) | (0.00112) | (0.00113) | (0.00113) | (0.00114) | ||
| 是否是国有企业 | 0.0478 | 0.0635 | 0.0568 | 0.0533 | 0.0413 | 0.0447 | 0.0413 | 0.039 | |
| (0.102) | (0.102) | (0.104) | (0.104) | (0.05) | (0.0503) | (0.0513) | (0.0514) | ||
| 资本密集度 | 0.0334 | 0.0337 | 0.0293 | 0.036 | 0.0176 | 0.0175 | 0.0161 | 0.0193 | |
| (0.0261) | (0.0263) | (0.0265) | (0.0286) | (0.0128) | (0.0129) | (0.013) | (0.0141) | ||
| 经营年限 | 0.0115*** | 0.0116*** | 0.0115*** | 0.0115*** | 0.00562*** | 0.00564*** | 0.00560*** | 0.00561*** | |
| (0.00073) | (0.00073) | (0.00074) | (0.00074) | (0.00035) | (0.00035) | (0.00036) | (0.00036) | ||
| 常数项 | -4.876*** | -5.198*** | -5.140*** | -5.245*** | -2.568*** | -2.721*** | -2.697*** | -2.754*** | |
| (0.237) | (0.244) | (0.272) | (0.387) | (0.114) | (0.118) | (0.132) | (0.186) | ||
| 年份固定效应 | 否 | 是 | 是 | 是 | 否 | 是 | 是 | 是 | |
| 地区固定效应 | 否 | 否 | 是 | 是 | 否 | 否 | 是 | 是 | |
| 行业固定效应 | 否 | 否 | 否 | 是 | 否 | 否 | 否 | 是 | |
| 样本观察值 | 20 635 | 20 635 | 20 635 | 20 635 | 20 635 | 20 635 | 20 635 | 20 635 | |
注:上表采用Logit模型以及Probit模型进行检验,被解释变量为企业是否对外投资。解释变量中企业生产率为滞后一期的企业生产率,以消除当期对外直接投资给企业带来的生产率的变化;是否出口为滞后三期的企业出口情况,考虑到三期前的出口可能会是企业对外直接投资的先前准备。回归系数下的括号内为标准误,“***、**和*”分别表示在“1%、5%和10%”水平上显著。 |
表5 东部企业、中部企业、西部企业回归结果Tab.5 Return results of Eastern enterprises, central enterprises and Western Enterprises |
| 东部地区企业 | 中部地区企业 | 西部地区企业 | |
|---|---|---|---|
| 生产率 | 0.0541* | 0.0549 | 0.0564 |
| (0.0286) | (0.0884) | (0.0605) | |
| 公司规模 | 0.0250*** | 0.0213*** | 0.0216*** |
| (0.00154) | (0.00419) | (0.0027) | |
| 是否上市 | 0.0418 | 0.0771 | 0.238 |
| (0.079) | (0.245) | (0.165) | |
| 是否出口 | 0.653*** | 1.158*** | 0.481** |
| (0.1) | (0.28) | (0.236) | |
| 经营情况 | 0.00911*** | 0.00927*** | 0.00945*** |
| (0.0023) | (0.0023) | (0.00231) | |
| 是否是国有企业 | -0.0419 | 0.554* | 0.864*** |
| (0.131) | (0.306) | (0.19) | |
| 资本密集度 | 0.0114 | 0.269*** | 0.0128 |
| (0.0313) | (0.101) | (0.0654) | |
| 经营年限 | 0.0151*** | 0.0103*** | 0.0128*** |
| (0.000794) | (0.00253) | (0.00175) | |
| 常数项 | -4.713*** | -6.727*** | -5.135*** |
| (0.413) | (1.379) | (0.824) | |
| 年份固定效应 | 是 | 是 | 是 |
| 行业固定效应 | 是 | 是 | 是 |
| 样本观测值 | 17 445 | 1 388 | 1 842 |
注:该表采用Logit模型进行检验,被解释变量为企业是否对外投资。回归系数下的括号内为标准误,“***、**和*”分别表示在“1%、5%和10%”水平上显著。 |
表6 制造业、批发与零售业、信息业、服务业企业回归结果Tab.6 Return results of manufacturing,wholesale and retail,information and service industries |
| 变量 | 制造业企业 | 批发与零售业企业 | 信息业企业 | 服务业企业 |
|---|---|---|---|---|
| 生产率 | 0.0105 | 0.316*** | 0.271* | 0.00662 |
| (0.0326) | (0.056) | (0.164) | (0.11) | |
| 是否上市 | 0.113 | 0.0938 | 0.505 | 0.118 |
| (0.0852) | (0.189) | (0.571) | (0.411) | |
| 是否出口 | 0.593*** | 0.343 | 0.0955 | 0.24 |
| (0.106) | (0.231) | (0.612) | (0.47) | |
| 经营情况 | 0.00669** | 0.00603 | 0.0346* | 0.0193* |
| (0.00278) | (0.00542) | (0.0186) | (0.0106) | |
| 经营年限 | 0.0112*** | 0.0135*** | 0.00645 | 0.0113*** |
| (0.00088) | (0.00179) | (0.00479) | (0.00318) | |
| 是否是国有企业 | -0.0683 | -0.107 | 0.614 | 0.325 |
| (0.126) | (0.256) | (0.621) | (0.41) | |
| 资本密集度 | 0.00241 | 0.078 | 0.0469 | 0.0939 |
| (0.0388) | (0.0561) | (0.186) | (0.114) | |
| 公司规模 | 0.0197*** | 0.0387*** | 0.00475 | 0.0237*** |
| (0.00142) | (0.00411) | (0.00572) | (0.00593) | |
| 是否有创新产出 | 1.195*** | 0.674*** | 1.441*** | 0.978*** |
| (0.0857) | (0.167) | (0.482) | (0.294) | |
| 常数项 | -4.677*** | -7.006*** | -4.214** | -6.043*** |
| (0.322) | (0.585) | (1.757) | (1.225) | |
| 年份固定效应 | 是 | 是 | 是 | 是 |
| 样本观测值 | 14 608 | 3 736 | 398 | 871 |
注:上表采用Logit模型进行检验,被解释变量为企业是否对外投资。回归系数下的括号内为标准误,“***、**和*”分别表示在“1%、5%和10%”水平上显著。 |
| [1] |
|
| [2] |
|
| [3] |
|
| [4] |
|
| [5] |
|
| [6] |
|
| [7] |
程惠芳, 阮翔. 用引力模型分析中国对外直接投资的区位选择[J]. 世界经济, 2004(11):23-30.
|
| [8] |
蒋冠宏, 蒋殿春. 中国对外投资的区位选择:基于投资引力模型的面板数据检验[J]. 世界经济, 2012(9):21-40.
|
| [9] |
黎明, 夏昕鸣, 朱晟君, 等. 中国对非直接投资时空演化及其影响因素[J]. 经济地理, 2017, 37(11):19-27.
|
| [10] |
王茂军, 徐永平. 中国在美洲OFDI的基本特征与决定因素[J]. 地理学报, 2017, 72(8):1 373-1 391.
|
| [11] |
蒋冠宏. 企业异质性和对外直接投资——基于中国企业的检验证据[J]. 金融研究, 2015(12):81-96.
|
| [12] |
|
| [13] |
|
| [14] |
|
| [15] |
|
| [16] |
|
| [17] |
葛顺奇, 罗伟. 中国制造业企业对外直接投资和母公司竞争优势[J]. 管理世界, 2013(6):28-42.
|
| [18] |
田巍, 余淼杰. 企业生产率和企业“走出去”对外直接投资:基于企业层面数据的实证研究[J]. 经济学(季刊), 2012, 11(1):383-408.
|
| [19] |
王方方, 赵永亮. 企业异质性与对外直接投资区位选择——基于广东省企业层面数据的考察[J]. 世界经济研究, 2012(2):64-69.
|
| [20] |
蒋冠宏, 蒋殿春. 中国企业对外直接投资的异质性检验——以服装、纺织和鞋帽类企业为例[J]. 世界经济研究, 2013(11):61-65.
|
| [21] |
|
| [22] |
|
| [23] |
|
| [24] |
|
| [25] |
|
| [26] |
严兵, 张禹, 韩剑. 企业异质性与对外直接投资——基于江苏省企业的检验[J]. 南开经济研究, 2014(4):50-63.
|
/
| 〈 |
|
〉 |