
产业集聚对企业初始规模选择与持续生存的影响——基于辽宁省中小企业的分析
|
何文韬(1985—),男,河南遂平人,博士,助理研究员。主要研究方向为新兴产业、产业动态。E-mail:wentao_he@126.com。 |
收稿日期: 2018-06-21
修回日期: 2019-01-15
网络出版日期: 2025-04-18
基金资助
国家社会科学基金重大项目(18ZDA042)
国家自然科学基金青年项目(71703015)
辽宁省社会科学规划基金项目(L17BJY043)
辽宁省教育厅新型智库项目(LN2019X04)
Impact of Industrial Cluster on Firm Start-up Size and Survival:Analysis of SMEs in Liaoning Province
Received date: 2018-06-21
Revised date: 2019-01-15
Online published: 2025-04-18
何文韬 . 产业集聚对企业初始规模选择与持续生存的影响——基于辽宁省中小企业的分析[J]. 经济地理, 2019 , 39(10) : 112 -122 . DOI: 10.15957/j.cnki.jjdl.2019.10.015
Based on the cross-study of industry dynamics and economic geography, this paper takes the small- and medium-sized firms in Liaoning as the research object and uses geospatial analysis methods to figure out the spatial distribution characteristics of industrial clusters and firms locations, in order to construct the state variables and distance variables reflecting the position relationship. And then, on the precondition of firms' heterogeneity, this paper uses the quantile regression and survival analysis to study the impact of industrial cluster on the firms' start-up size and survival. The results demonstrate that most of SMEs in Liaoning are located in cluster and surrounding areas. Industrial clusters have a significant positive agglomeration effect, which could increase the firm start-up size and reduce its exit risk. Besides, with the increase of distance between the firm location and cluster area, the smaller the firm start-up size, the higher the exit risk. Those results provide scientific evidences for the rational planning of industrial spatial distribution and the improvement of industrial cluster level and competitiveness in Liaoning Province.
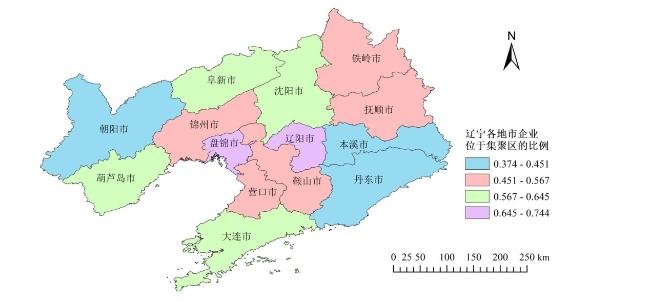
表1 辽宁省各地级市产业集聚区内企业数量及企业总数量统计Tab.1 Statistics of firms in industrial cluster area of Liaoning Province |
| 地区 | 盘锦 | 辽阳 | 阜新 | 沈阳 | 大连 | 葫芦岛 | 铁岭 | 锦州 | 鞍山 | 营口 | 抚顺 | 丹东 | 朝阳 | 本溪 |
|---|---|---|---|---|---|---|---|---|---|---|---|---|---|---|
| 企业总数 | 43 | 50 | 93 | 515 | 951 | 56 | 127 | 184 | 432 | 76 | 175 | 186 | 197 | 131 |
| 集聚区内企业数 | 32 | 34 | 60 | 322 | 584 | 34 | 72 | 98 | 227 | 37 | 79 | 83 | 87 | 49 |
| 集聚区内企业占比 | 0.744 | 0.680 | 0.645 | 0.625 | 0.614 | 0.607 | 0.567 | 0.533 | 0.525 | 0.487 | 0.451 | 0.446 | 0.442 | 0.374 |
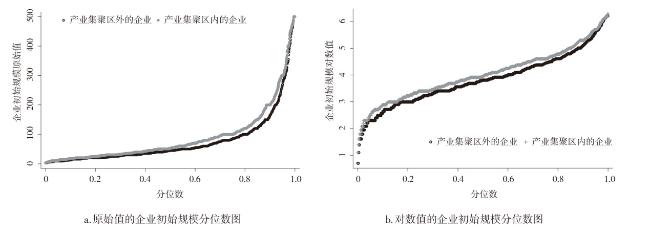
表2 辽宁中小企业初始规模的描述统计Tab.2 Descriptive statistics of SMEs’start-up size in Liaoning |
| 企业初始规模 | 观测量 | 均值 | 分位差尺度测量 | 分位差偏度测量 | 不同分位数上企业规模 | ||||||||
|---|---|---|---|---|---|---|---|---|---|---|---|---|---|
| QSC(0.1) | QSC(0.25) | QSK(0.1) | QSK(0.25) | 0.1 | 0.25 | 0.5 | 0.75 | 0.9 | |||||
| 原始值 | 3 216 | 81.243 | 182 | 74 | 3.2 | 1.083 | 15 | 26 | 50 | 100 | 197 | ||
| 对数值 | 3 216 | 3.93 | 2.575 | 0.807 | 0.139 | -0.766 | 2.708 | 3.258 | 3.912 | 4.065 | 5.283 | ||
表3 产业集聚对企业初始规模影响的分位数估计结果Tab.3 The quantile estimation results of the effect of industrial clusters on the firm start-up size |
| 变量名称 | 符号表示 | Model1 | Model2 | Model3 | Model4 | Model5 | Model6 |
|---|---|---|---|---|---|---|---|
| OLS | QR_10 | QR_25 | QR_50 | QR_75 | QR_90 | ||
| 产业集聚 | cluster | 0.178*** | 0.158*** | 0.191*** | 0.182*** | 0.190*** | 0.179** |
| (0.033) | (0.053) | (0.039) | (0.041) | (0.047) | (0.070) | ||
| 企业密度 | firmden | -2.064*** | -4.744*** | -3.495*** | -1.980** | -0.182 | -1.809 |
| (0.772) | (1.248) | (0.919) | (0.950) | (1.109) | (1.650) | ||
| 人均固定资产投资 | ifapc | 0.005*** | 0.003 | 0.004** | 0.006*** | 0.008*** | 0.003 |
| (0.002) | (0.003) | (0.002) | (0.002) | (0.002) | (0.003) | ||
| 劳动力投入 | labor | -0.374*** | -0.320 | -0.262* | -0.416*** | -0.573*** | -0.241 |
| (0.124) | (0.200) | (0.147) | (0.152) | (0.178) | (0.264) | ||
| 人均工资 | salary | -0.113 | -0.124 | -0.221** | -0.131 | -0.029 | 0.042 |
| (0.075) | (0.121) | (0.089) | (0.092) | (0.107) | (0.160) | ||
| 人均GDP | gdp | 0.015 | 0.335 | -0.109 | 0.050 | -0.039 | -0.135 |
| (0.184) | (0.298) | (0.219) | (0.227) | (0.265) | (0.394) | ||
| 常数项 | C | 5.727*** | 2.038 | 7.407*** | 5.535** | 5.931** | 6.982* |
| (1.785) | (2.888) | (2.126) | (2.198) | (2.566) | (3.818) | ||
| 城市 | city | yes | yes | yes | yes | yes | yes |
| 年份 | year | yes | yes | yes | yes | yes | yes |
| 拟合优度 | R2/伪R2 | 0.124 | 0.103 | 0.092 | 0.077 | 0.060 | 0.070 |
| 样本量 | N | 3 216 | 3 216 | 3 216 | 3 216 | 3 216 | 3 216 |
注:括号中的为标准误,*p<0.1,**p<0.05,***p<0.01。 |
表4 企业地理距离对企业初始规模影响的分位数估计结果Tab.4 The quantile estimation results of the effect of geographical distance on the firm start-up size |
| 变量名称 | 符号表示 | Model1 | Model2 | Model3 | Model4 | Model5 | Model6 |
|---|---|---|---|---|---|---|---|
| OLS | QR_10 | QR_25 | QR_50 | QR_75 | QR_90 | ||
| 企业与产业集聚区距离 | distance | -0.054*** | -0.034* | -0.052*** | -0.047*** | -0.058*** | -0.068*** |
| (0.012) | (0.019) | (0.015) | (0.016) | (0.019) | (0.026) | ||
| 企业密度 | firmden | -2.118*** | -4.646*** | -3.633*** | -1.915** | -0.273 | -1.796 |
| (0.773) | (1.200) | (0.921) | (0.976) | (1.159) | (1.634) | ||
| 人均固定 资产投资 | ifapc | 0.005*** | 0.003 | 0.005** | 0.006*** | 0.007*** | 0.003 |
| (0.002) | (0.002) | (0.002) | (0.002) | (0.002) | (0.003) | ||
| 劳动力投入 | labor | -0.374*** | -0.315 | -0.303** | -0.423*** | -0.543*** | -0.213 |
| (0.124) | (0.192) | (0.148) | (0.156) | (0.186) | (0.262) | ||
| 人均工资 | salary | -0.116 | -0.152 | -0.229** | -0.145 | -0.034 | -0.028 |
| (0.075) | (0.116) | (0.089) | (0.094) | (0.112) | (0.158) | ||
| 人均GDP | gdp | 0.0137 | 0.458 | -0.047 | 0.024 | -0.055 | -0.093 |
| (0.184) | (0.286) | (0.220) | (0.233) | (0.277) | (0.390) | ||
| 常数项 | C | 5.925*** | 1.122 | 7.036*** | 6.037*** | 6.300** | 7.325* |
| (1.789) | (2.779) | (2.133) | (2.259) | (2.685) | (3.783) | ||
| 城市 | city | yes | yes | yes | yes | yes | yes |
| 年份 | year | yes | yes | yes | yes | yes | yes |
| 拟合优度 | R2/伪R2 | 0.121 | 0.100 | 0.090 | 0.076 | 0.059 | 0.071 |
| 样本量 | N | 3 216 | 3 216 | 3 216 | 3 216 | 3 216 | 3 216 |
注:括号中的为标准误,*p<0.1,**p<0.05,***p<0.01。 |
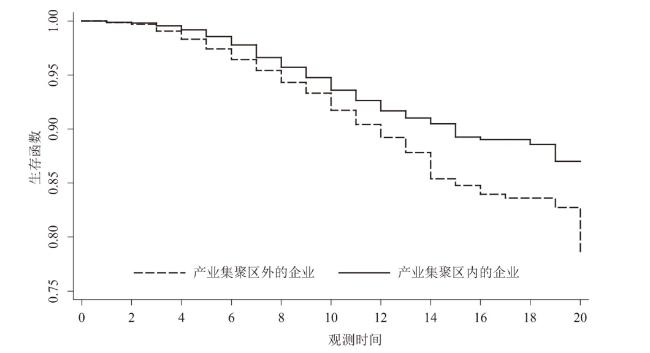
表5 辽宁中小企业生存函数的KM估计Tab.5 The KM estimation of firm survival functions in Liaoning |
| 产业集聚区外的企业 | 产业集聚区内的企业 | |||||||||
|---|---|---|---|---|---|---|---|---|---|---|
| 时期 | 起始总数量 | 退出企业数 | 净删失数 | 生存函数 | 时期 | 起始总数量 | 退出企业数 | 净删失数 | 生存函数 | |
| 1 | 1 418 | 2 | 7 | 0.999 | 1 | 1 798 | 2 | 6 | 0.999 | |
| 2 | 1 409 | 2 | 24 | 0.997 | 2 | 1 790 | 1 | 13 | 0.998 | |
| 3 | 1 383 | 9 | 32 | 0.991 | 3 | 1 776 | 5 | 25 | 0.996 | |
| 4 | 1 342 | 10 | 24 | 0.983 | 4 | 1 746 | 6 | 28 | 0.992 | |
| 5 | 1 308 | 12 | 21 | 0.974 | 5 | 1 712 | 11 | 38 | 0.986 | |
| 6 | 1 275 | 13 | 21 | 0.964 | 6 | 1 663 | 13 | 56 | 0.978 | |
| 7 | 1 241 | 13 | 28 | 0.954 | 7 | 1 594 | 19 | 70 | 0.966 | |
| 8 | 1 200 | 14 | 24 | 0.943 | 8 | 1 505 | 14 | 87 | 0.957 | |
| 9 | 1 162 | 12 | 86 | 0.933 | 9 | 1 404 | 14 | 96 | 0.948 | |
| 10 | 1 064 | 18 | 80 | 0.918 | 10 | 1 294 | 16 | 127 | 0.936 | |
| 11 | 966 | 14 | 119 | 0.904 | 11 | 1 151 | 12 | 148 | 0.926 | |
| 12 | 833 | 11 | 123 | 0.892 | 12 | 991 | 10 | 148 | 0.917 | |
| 13 | 699 | 11 | 143 | 0.878 | 13 | 833 | 6 | 149 | 0.910 | |
| 14 | 545 | 15 | 129 | 0.854 | 14 | 678 | 4 | 161 | 0.905 | |
| 15 | 401 | 3 | 83 | 0.848 | 15 | 513 | 7 | 116 | 0.893 | |
| 16 | 315 | 3 | 79 | 0.840 | 16 | 390 | 1 | 105 | 0.890 | |
| 17 | 233 | 1 | 72 | 0.836 | 17 | 284 | 0 | 95 | 0.890 | |
| 18 | 160 | 0 | 64 | 0.836 | 18 | 189 | 1 | 73 | 0.886 | |
| 19 | 96 | 1 | 57 | 0.827 | 19 | 115 | 2 | 70 | 0.870 | |
| 20 | 38 | 2 | 36 | 0.784 | 20 | 43 | 0 | 43 | 0.870 | |
表6 辽宁中小企业生存估计结果Tab.6 The estimation results of SMEs’survival in Liaoning |
| 变量名称 | 符号表示 | Model1 | Model2 | Model3 |
|---|---|---|---|---|
| 创新资助 | fund | -0.048*** | -0.047*** | -0.048*** |
| (0.017) | (0.017) | (0.017) | ||
| 初始规模 | size | -0.280*** | -0.285*** | -0.291*** |
| (0.062) | (0.062) | (0.062) | ||
| 产业集聚 | cluster | -0.241** | ||
| (0.114) | ||||
| 企业与产业集聚区距离 | distance | 0.103** | ||
| (0.041) | ||||
| (0,10]km范围 | range_1 | 0.033 | ||
| (0.162) | ||||
| (10,50]km范围 | range_2 | 0.304** | ||
| (0.129) | ||||
| (50,∞)km范围 | range_3 | 0.850*** | ||
| (0.327) | ||||
| 样本量 | N | 3 216 | 3 216 | 3 216 |
注:括号中的为标准误,*p<0.1,**p<0.05,***p<0.01。 |
| [1] |
|
| [2] |
|
| [3] |
|
| [4] |
|
| [5] |
|
| [6] |
|
| [7] |
|
| [8] |
|
| [9] |
|
| [10] |
|
| [11] |
|
| [12] |
|
| [13] |
|
| [14] |
蒋灵多. 集聚会降低企业失败风险吗?——来自中国微观企业的证据[J]. 产业经济研究, 2016(5):1-12.
|
| [15] |
|
| [16] |
|
| [17] |
|
| [18] |
|
| [19] |
|
| [20] |
夏茂林. 辽宁振兴发展研究[J]. 理论界, 2016(2):65-71.
|
| [21] |
|
| [22] |
|
| [23] |
|
| [24] |
|
| [25] |
|
| [26] |
|
/
| 〈 |
|
〉 |
