
中国粮食生产与消费能力脆弱性的时空格局及耦合协调性演变
|
姚成胜(1977—),男,江西上饶人,博士,教授,博士生导师。主要研究方向为粮食安全、农业资源与环境评价。E-mail:yaocheng sheng@163.com。 |
收稿日期: 2019-02-28
修回日期: 2019-08-29
网络出版日期: 2025-04-18
基金资助
国家自然科学基金项目(41761110)
教育部人文社会科学规划基金项目(17YJA790084)
Spatial-Temporal Pattern and Coupling Coordination Evolution of the Vulnerability of Food Production and Consumption Ability in China
Received date: 2019-02-28
Revised date: 2019-08-29
Online published: 2025-04-18
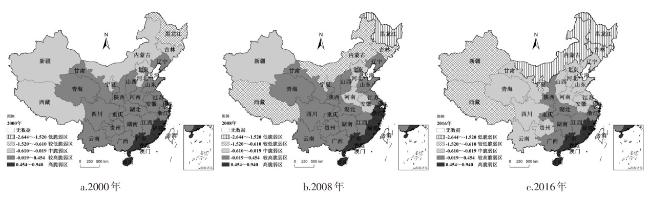
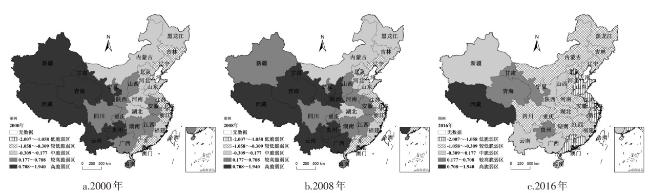
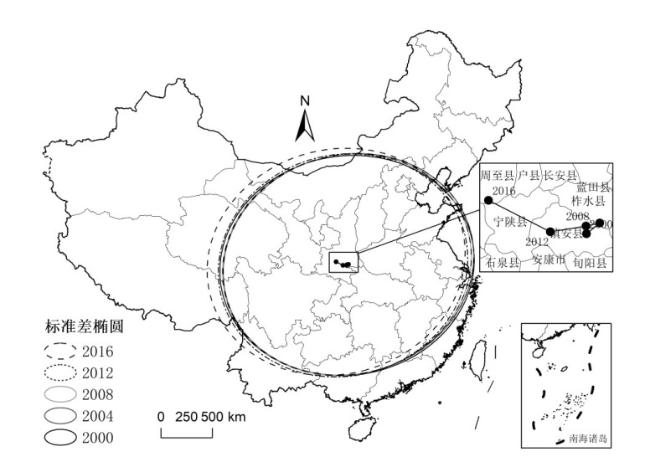
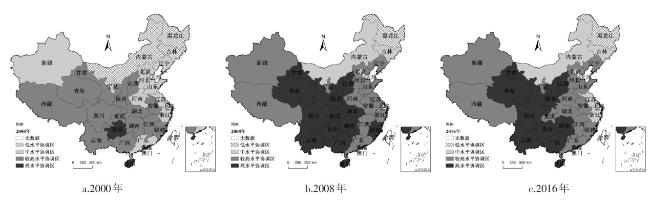
基于脆弱性理论,构建了我国粮食生产与消费能力脆弱性评价指标体系,采用全局主成分、重心—标准差椭圆模型和耦合协调度模型,分析了2000—2016年我国省域粮食生产与消费能力脆弱性的时空演变及其耦合协调性的变化状况,结果表明:①粮食生产能力脆弱性呈现出由东南向西北和东北逐步降低,较高脆弱区地域范围明显缩小的时空演变特征,其重心整体向南移动了95.70 km。②粮食消费能力脆弱性呈现由西向东降低的趋势,高脆弱区和较高脆弱区范围大幅缩小的时空演变特征,其重心整体向西北移动了131.55 km。③粮食生产与消费能力脆弱性的耦合协调性呈现由东北部向南,东部沿海省区向中西部,藏、新两地向内陆腹地省区逐步升高的分布格局,两者的耦合协调度由2000年的0.695变化到2016年的0.768。④粮食生产能力能够完全保障粮食消费的地区(类型Ⅰ)绝大部分位于我国藏、新、蒙等边疆地区,以及西北、西南、东北等地,其耦合协调性低的短板在于粮食消费能力过低;基本能够保障粮食消费的地区(类型Ⅱ)大部分属于粮食主产区,其粮食生产与消费能力匹配较好;无法保障粮食消费的地区(类型Ⅲ)绝大部分位于东部沿海的粮食主销区,其耦合协调度低的原因在于粮食生产能力过低而消费能力过高。
姚成胜 , 殷伟 , 黄琳 , 崔会芳 . 中国粮食生产与消费能力脆弱性的时空格局及耦合协调性演变[J]. 经济地理, 2019 , 39(12) : 147 -156 . DOI: 10.15957/j.cnki.jjdl.2019.12.017
Based on the vulnerability theory, this paper constructed the evaluation index systems of vulnerability of food production ability (VFPA) and vulnerability of food consumption ability (VFCA) in China. With the methods of generalized principal component analysis, gravity center-standard deviational ellipse and coupling coordination model, the spatial-temporal evolution characteristics and coupling coordination situation of VFPA and VFCA were analyzed from 2000 to 2016, the results showed that: (1)VFPA gradually decreased from southeast to northwest and northeast, the spectrums with relative high vulnerability was significantly reduced, and the gravity center of VFPA moved 95.70km toward the south; (2) VFCA decreased from west to east, the high and relatively high vulnerable areas were greatly reduced, and the gravity center of VFCA shifted 131.55km to the northwest; (3) The distribution pattern of the coupling coordination of VFPA and VFCA gradually increased from northeast to south, from eastern coastal provinces to the central and western regions and from Tibetan and Xinjiang to the inland hinterland. The coupling coordination degree of VFPA and VFCA raised from 0.695 in 2000 to 0.768 in 2016; (4) The regions with full grain production ability to guarantee food consumption (Type I) were mostly located in Tibet, Xinjiang and Inner Mongolia, as well as in the northwest, southwest and northeast, the low coupling coordination were mainly owning to their too low food consumption ability; The regions with basically ability to guarantee food consumption (Type II) were mostly located in the main grain producing areas, the grain production and consumption ability matched quite well in those areas, which made them having a relative high coupling coordination degree; The regions with no ability to guaranteed food consumption (Type III) were mostly located in main grain-consuming areas in the developed eastern coastal provinces, the low coupling coordination was owning to their too low food production ability and too high food consumption ability.
表1 我国粮食生产与消费能力脆弱性评价指标体系Tab.1 Evaluation index system of the vulnerability of food production and consumption ability in China |
| 系统层 | 指标层 | 性质 |
|---|---|---|
| 生产能力脆弱性 (VFPA) | 农村劳动力文化水平(X1) | - |
| 单位粮食播种面积机械总动力(X2) | - | |
| 人均粮食播种面积(X3) | - | |
| 有效灌溉率(X4) | - | |
| 人均财政支农支出(X5) | - | |
| 单位粮食播种面积化肥施用量(X6) | + | |
| 单位粮食播种面积农药施用量(X7) | + | |
| 人均粮食产量(X8) | - | |
| 消费能力脆弱性 (VCA) | 人口总量(Y1) | - |
| 人均GDP(Y2) | - | |
| 恩格尔系数(Y3) | + | |
| 粮食消费价格指数(Y4) | + | |
| 城镇化率(Y5) | - | |
| 城乡收入比(Y6) | + | |
| 城镇居民消费水平(Y7) | - | |
| 农村居民消费水平(Y8) | - |
表2 粮食生产与消费能力脆弱性的全局主成分分析结果Tab.2 GPCA results of food production and consumption ability vulnerability |
| 指标 | 粮食生产能力脆弱性(VFPA) | 指标 | 粮食消费能力脆弱性(VFCA) | |||||
|---|---|---|---|---|---|---|---|---|
| F1 | F2 | F3 | F4 | F1 | F2 | F3 | ||
| X1 | -0.024 | -0.161 | -0.226 | 0.542 | Y1 | -0.063 | 0.054 | 0.887 |
| X2 | 0.075 | -0.060 | 0.616 | -0.236 | Y2 | 0.199 | 0.076 | -0.103 |
| X3 | 0.503 | -0.056 | -0.008 | 0.054 | Y3 | -0.026 | 0.269 | 0.192 |
| X4 | 0.037 | 0.049 | 0.528 | -0.043 | Y4 | 0.367 | -0.66 | -0.012 |
| X5 | 0.045 | 0.197 | -0.050 | 0.798 | Y5 | 0.392 | -0.188 | -0.170 |
| X6 | -0.176 | 0.550 | -0.110 | 0.129 | Y6 | 0.445 | -0.352 | 0.226 |
| X7 | -0.094 | 0.550 | 0.029 | 0.195 | Y7 | 0.076 | 0.218 | -0.035 |
| X8 | 0.608 | -0.189 | 0.093 | -0.012 | Y8 | 0.158 | 0.120 | -0.043 |
| 特征值 | 3.338 | 1.632 | 1.181 | 0.711 | 特征值 | 4.814 | 1.118 | 0.896 |
| 贡献率 | 41.721 | 20.401 | 14.764 | 8.887 | 贡献率 | 60.179 | 13.977 | 11.206 |
| 累计贡献率/% | 41.721 | 62.122 | 76.886 | 85.773 | 累计贡献率/% | 60.179 | 74.156 | 85.362 |
表3 粮食生产能力脆弱性重心—标准差椭圆模型描述统计Tab.3 Descriptive statistics of gravity center and SDE of VFPA |
| 年份 | 重心坐标 | 移动速度(km/a) | 转角θ(º) | 沿x轴的标准差(km) | 沿y轴的标准差(km) | 扁度 |
|---|---|---|---|---|---|---|
| 2000 | 111.52ºE,33.24ºN | 58.20 | 1 046.61 | 1 155.25 | 0.91 | |
| 2004 | 111.41ºE,33.09ºN | 4.58 | 62.85 | 1 051.05 | 1 140.80 | 0.92 |
| 2008 | 111.39ºE,32.77ºN | 7.55 | 70.49 | 1 046.93 | 1 113.18 | 0.94 |
| 2012 | 111.35ºE,32.46ºN | 7.19 | 79.87 | 1 027.44 | 1 075.89 | 0.95 |
| 2016 | 111.38ºE,32.23ºN | 5.44 | 89.10 | 1 007.08 | 1 039.98 | 0.97 |
表4 粮食消费能力脆弱性重心—标准差椭圆描述统计Tab.4 Descriptive statistics of the center of gravity and SDE about food consumption capacity vulnerability |
| 年份 | 重心坐标 | 移动速度(km/a) | 转角θ(º) | 沿x轴的标准差(km) | 沿y轴的标准差(km) | 扁度 |
|---|---|---|---|---|---|---|
| 2000 | 109.24ºE,33.36ºN | - | 74.13 | 1 096.61 | 1 271.40 | 0.86 |
| 2004 | 109.41ºE,33.46ºN | 5.07 | 75.22 | 1 081.24 | 1 226.64 | 0.88 |
| 2008 | 109.24ºE,33.44ºN | 4.57 | 74.05 | 1 070.88 | 1 225.25 | 0.87 |
| 2012 | 108.82ºE,33.40ºN | 11.83 | 74.00 | 1 070.63 | 1 234.89 | 0.87 |
| 2016 | 108.10ºE,33.74ºN | 21.36 | 80.28 | 1 071.65 | 1 246.39 | 0.86 |
表5 2000—2016年我国粮食生产与消费能力脆弱性耦合协调性短板分析结果Tab.5 Results of coupling coordination limits of VFPA and VFCA in China from 2000 to 2016 |
| 年份 | 类型 | 低水平协调区 | 中水平协调区 | 较高水平协调区 | 高水平协调区 |
|---|---|---|---|---|---|
| 2000年 | 类型Ⅰ | 黑、蒙 | 宁、新 | 陕、甘、滇、藏 | 黔 |
| 类型Ⅱ | 吉 | 津、苏、鲁、豫、冀 | 赣、晋、湘、桂、川、渝、皖、青 | 琼 | |
| 类型Ⅲ | 沪、京 | 粤、浙、辽 | 闽、鄂 | - | |
| 2008年 | 类型Ⅰ | 黑 | 吉、蒙 | 冀、豫、皖、新、宁、藏 | 桂、晋、陕、青、滇、甘、黔 |
| 类型Ⅱ | - | - | 苏、辽、鲁、赣、 | 琼、鄂、湘、川、渝 | |
| 类型Ⅲ | 沪、京 | 津 | 粤、浙 | 闽 | |
| 2016年 | 类型Ⅰ | 黑 | 吉、蒙 | 宁、新、藏 | 滇、黔、青、甘 |
| 类型Ⅱ | - | - | 鲁、鄂、辽、渝、赣、冀、豫、皖 | 琼、湘、桂、川、陕、晋 | |
| 类型Ⅲ | 沪、津、京 | 浙、苏 | 粤、闽 | - |
| [1] |
姚成胜, 李政通, 易行. 中国粮食产量变化的驱动效应及其空间分异研究[J]. 中国人口·资源与环境, 2016, 26(9):72-81.
|
| [2] |
陈锡文, 韩俊. 经济新常态下破解“三农”难题新思路[M]. 北京: 清华大学出版社, 2016.
|
| [3] |
李政通, 姚成胜, 梁龙武. 中国粮食生产的区域类型和生产模式演变分析[J]. 地理研究, 2018, 37(5):937-953.
|
| [4] |
高帆. 农业劳动生产率提高的国际经验与中国的选择[J]. 复旦学报:社会科学版, 2015, 57(1):116-124.
|
| [5] |
|
| [6] |
|
| [7] |
罗翔, 曾菊新, 朱媛媛, 等. 谁来养活中国:耕地压力在粮食安全中的作用及解释[J]. 地理研究, 2016, 35(12):2 216-2 226.
|
| [8] |
刘洛, 徐新良, 刘纪远, 等. 1990—2010年中国耕地变化对粮食生产潜力的影响[J]. 地理学报, 2014, 69(12):1 767-1 778.
|
| [9] |
陈飞, 范庆泉, 高铁梅. 农业政策、粮食产量与粮食生产调整能力[J]. 经济研究, 2010, 45(11):101-114.
|
| [10] |
张利庠, 彭辉, 靳兴初. 不同阶段化肥施用量对我国粮食产量的影响分析[J]. 农业技术经济, 2008(4):85-94.
|
| [11] |
徐海亚, 朱会义. 基于自然地理分区的1990—2010年中国粮食生产格局变化[J]. 地理学报, 2015, 70(4):582-590.
|
| [12] |
钟甫宁, 向晶. 城镇化对粮食需求的影响[J]. 农业技术经济, 2012(1):4-10.
|
| [13] |
姚成胜, 邱雨菲, 黄琳, 等. 中国城市化与粮食安全耦合关系辨析及其实证分析[J]. 中国软科学, 2016(8):75-88.
|
| [14] |
罗其友, 米健, 高明杰. 中国粮食中长期消费需求预测研究[J]. 中国农业资源与区划, 2014, 35(5):1-7.
|
| [15] |
胡小平, 郭晓慧. 2020年中国粮食需求结构分析及预测[J]. 中国农村经济, 2010(6):4-15.
|
| [16] |
王济民, 肖红波. 我国粮食八年增产的性质与前景[J]. 农业经济问题, 2013, 34(2):22-31.
|
| [17] |
吴建寨, 张建华, 孔繁涛. 中国粮食生产与消费的空间格局演变[J]. 农业技术经济, 2015(11):46-52.
|
| [18] |
田亚平, 向清成, 王鹏. 区域人地耦合系统脆弱性及其评价指标体系[J]. 地理研究, 2013, 32(1):55-63.
|
| [19] |
黄建毅, 马丽, 李鹤, 等. 国外脆弱性理论模型与评估框架研究评述[J]. 地域研究与开发, 2012, 31(5):1-5.
|
| [20] |
李鹤, 张平宇. 全球变化背景下脆弱性研究进展与应用展望[J]. 地理科学进展, 2011, 30(7):920-929.
|
| [21] |
黄晓军, 黄馨, 崔彩兰, 等. 社会脆弱性概念、分析框架与评价方法[J]. 地理科学进展, 2014, 33(11):1 512-1 525.
|
| [22] |
刘耀彬, 陈志. 中部地区区域经济发展的极化分析[J]. 长江流域资源与环境, 2006, 15(6):679-679.
|
| [23] |
耿海清, 陈帆, 詹存卫, 等. 基于全局主成分分析的我国省级行政区城市化水平综合评价[J]. 人文地理, 2009, 24(5):47-51.
|
| [24] |
姚成胜, 李政通, 杜涵, 等. 长三角地区土地集约利用与经济发展协调性[J]. 经济地理, 2016, 36(2):159-166.
|
| [25] |
王介勇, 刘彦随. 1990年至2005年中国粮食产量重心演进格局及其驱动机制[J]. 资源科学, 2009, 31(7):1 188-1 194.
|
| [26] |
文琦, 赵亮. 1978-2011年宁夏粮食产量重心移动轨迹及其驱动机制[J]. 地域研究与开发, 2014, 33(1):99-102.
|
| [27] |
单良, 张涛. 中国产业结构与就业结构协调性时空演变研究[J]. 中国人口科学, 2018(2) :39-49.
|
| [28] |
王凤, 刘艳芳, 孔雪松, 等. 中国县域粮食产量时空演变及影响因素变化[J]. 经济地理, 2018, 38(5):142-151.
|
| [29] |
姜磊, 柏玲, 吴玉鸣. 中国省域经济、资源与环境协调分析——兼论三系统耦合公式及其扩展形式[J]. 自然资源学报, 2017, 32(5):788-799.
|
| [30] |
刘彦随, 翟荣新. 中国粮食生产时空格局动态及其优化策略探析[J]. 地域研究与开发, 2009, 28(1):1-5.
|
| [31] |
白彩全, 黄芽保, 宋伟轩, 等. 省域金融集聚与生态效率耦合协调发展研究[J]. 干旱区资源与环境, 2014, 28(9):1-7.
|
| [32] |
吴泽斌, 刘卫东. 基于粮食安全的耕地保护区域经济补偿标准测算[J]. 自然资源学报, 2009, 24(12):2 076-2 086.
|
| [33] |
姚成胜, 朱鹤健. 福建省粮食生产与畜牧业发展协调状况的时空变化研究[J]. 农业现代化研究, 2006, 30(3):288-292.
|
/
| 〈 |
|
〉 |
