
土地利用转型时空演变及其生态环境效应——基于长江经济带127个地级市的实证研究
|
苑韶峰(1975—),男,山西繁峙人,博士,教授,博士生导师。主要研究方向为土地资源管理。E-mail:shaofengyuan1975@163.com。 |
收稿日期: 2018-11-12
修回日期: 2019-06-26
网络出版日期: 2025-04-17
基金资助
国家自然科学基金面上项目(41871181)
教育部人文社会科学规划基金项目(18YJA630136)
教育部人文社会科学规划基金项目(19YJA630099)
浙江省哲学社会科学规划基金项目(18NDJC196YB)
浙江省哲学社会科学规划基金项目(19NDJC015Z))
Spatiotemporal Change of Land-Use Transformation and Its Eco-Environmental Response:A Case of 127 Counties in Yangtze River Economic Belt
Received date: 2018-11-12
Revised date: 2019-06-26
Online published: 2025-04-17
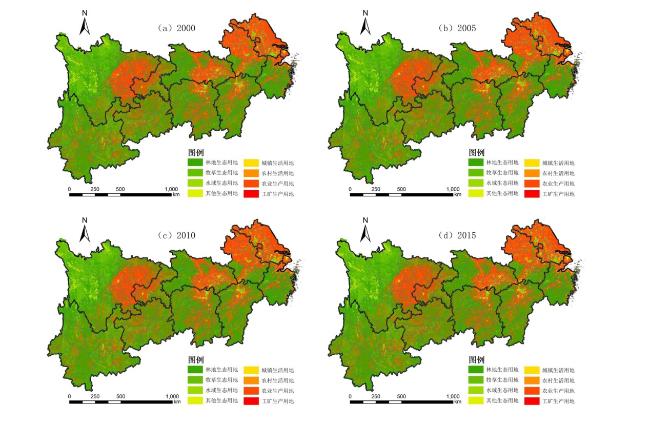
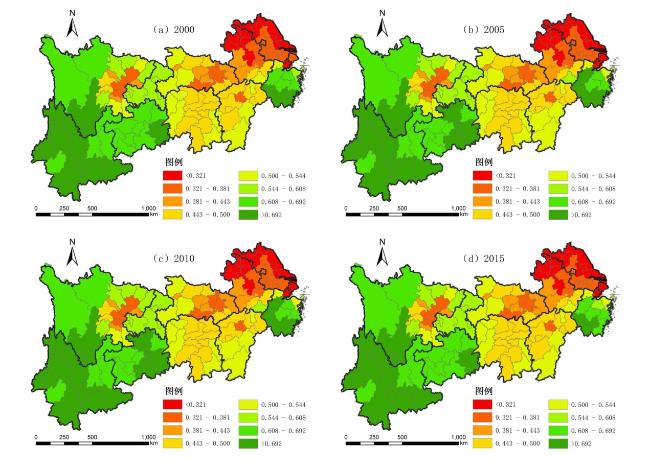
以长江经济带为研究区域,基于2000—2015年四期土地利用现状遥感监测数据,从三生空间角度出发,利用转移矩阵及重心迁移模型对长江经济带土地利用转型进行研究,并通过生态环境质量指数及生态贡献率对这一时期的生态环境效应进行定量分析。结果表明:①2000—2015年,长江经济带在区域转型发展过程中生产用地及生态用地面积分别减少9 729.04 km2和648.87 km2,占比为1.52%和0.05%;生活用地面积增加10 737.11 km2,占24.37%。土地利用变化最大的是工矿生产用地,变化最小的是林地生态用地。②2000—2015年,长江经济带生产用地重心向南偏西64.89°方向迁移12.67 km,生活用地重心向南偏东62.69°方向迁移37.33 km,生态用地重心向北偏西70.38°方向迁移1.87 km。③对比长江经济带各地级市生态环境质量指数,亳州最小,丽水最大。从空间上看,西部及西南地区生态环境质量指数相对较高,中部地区相对较低,东部地区北方指数低南方指数高。从时间上看,长江经济带各地级市总体生态环境质量基本保持稳定,部分地区有小幅度下降。④长江经济带区域生态质量同时存在着生态改善和生态恶化的两种趋势,且生态环境改善的趋势略小于环境恶化的趋势。
苑韶峰 , 唐奕钰 , 申屠楚宁 . 土地利用转型时空演变及其生态环境效应——基于长江经济带127个地级市的实证研究[J]. 经济地理, 2019 , 39(9) : 174 -181 . DOI: 10.15957/j.cnki.jjdl.2019.09.021
With the rapid development of urbanization in China, environmental problems caused by high-intensity land use are increasingly recognized. Yangtze River Economic Belt(YREB) was Chosen as the sampling area, based on the four-phase Landsat TM image interpretation data from 2000 to 2015, this study analyses the land transformation of YREB since the new century by using the transfer matrix and the gravity center migration model from the perspective of Ecological-Living-Productive Space. And through the ecological environment quality index and ecological contribution rate, the ecological effects of land use in YREB during this period were quantitatively analyzed. The results are as follows. 1) From 2000 to 2015, the area of productive land and ecological land in YREB decreased 9 729.04 km2 and 648.87 km2, accounting for 1.52% and 0.05% respectively; and the area of living land increased 10 737.11 km2, accounting for 24.37%. The largest change in land use is industrial productive land, and the smallest change is forestry ecological land. Other land uses have different degrees of mutual exchange. 2) From 2000 to 2015, the center of gravity of the productive land in YREB moved 12.67 km to the southwest in the direction of 64.89°, and the center of gravity of the living land moved 37.33 km in the eastward direction of 62.69°. The center of gravity of the ecological land moved 1.87 km in the northewst direction of 70.38°. 3) Compared with the eco-environmental quality index of various cities in YREB, it is the smallest in Bozhou and the largest in Lishui. From the spatial perspective, the eco-environmental quality index in the western and southwestern regions is relatively high, the central region is relatively low, and the eastern region has a low northern index and a high southern index. View of time, the overall ecological environment quality of the local economic cities in YREB has remained basically stable, with some areas decreasing slightly. 4) The regional ecological quality of YREB has two trends of ecological improvement and ecological deterioration, and the trend of ecological environment improvement is slightly smaller than the trend of environmental degradation.
表1 三生功能分类及其生态环境质量指数Tab.1 Classification of Ecological-living-productive function and its ecological environment quality index |
| “三生”土地利用主导功能分类 | 土地利用分类系统的二级分类 | 生态环境质量指数 | |
|---|---|---|---|
| 一级地类 | 二级地类 | ||
| 生产用地 | 农业生产用地 | 水田、旱地 | 0.290 |
| 工矿生产用地 | 工交建设用地 | 0.150 | |
| 生态用地 | 林地生态用地 | 有林地、灌木林地、疏林地、其他林地 | 0.870 |
| 牧草生态用地 | 高覆盖度草地、中覆盖度草地、低覆盖度草地 | 0.760 | |
| 水域生态用地 | 河渠、湖泊、水库坑塘、永久性冰川雪地、滩涂、滩地 | 0.580 | |
| 其他生态用地 | 沙地、戈壁、盐碱地、沼泽地、裸土地、裸岩石质地 | 0.025 | |
| 生活用地 | 城镇生活用地 | 城镇用地 | 0.200 |
| 农村生活用地 | 农村居民点 | 0.200 | |
注:本研究从土地利用角度出发,基于自然属性视角及其所满足主体的意愿来确定土地类型的主导功能。林地中的用材林地、草地中的牧草地均具有生产功能,由于研究区该类型用地较少,故不再单独考虑。园地归入林地考虑:从功能角度园地主导功能为生产功能,但其所发挥的生态功能与林地相当且研究区园地面积相对较少,影像数据色谱与林地类似。 |
图1 2000—2015年长江经济带三生用地分布图Fig.1 Distribution of ecological-living-productive land in YREB during 2000-2015 |
表2 2000—2015年长江经济带三生用地面积(km2)Tab.2 Area of ecological-living-productive land in YREB during 2000-2015(km2) |
| 年份 | 2000 | 2005 | 2010 | 2015 |
|---|---|---|---|---|
| 生产用地 | 641 513.17 | 634 850.27 | 631 320.43 | 631 784.13 |
| 生活用地 | 44 064.75 | 42 841.85 | 45 919.62 | 54 801.85 |
| 生态用地 | 1 358 345.70 | 1 366 321.93 | 1 366 824.77 | 1 357 696.82 |
表3 2000—2015年长江经济带土地利用转移概率矩阵(%)Tab.3 Transition matrix of land use types in YREB during 2000-2015(%) |
| 林地生态用地 | 牧草生态用地 | 水域生态用地 | 其他生态用地 | 城镇生活用地 | 农村生活用地 | 农业生产用地 | 工矿生产用地 | |
|---|---|---|---|---|---|---|---|---|
| 林地生态用地 | 99.18 | 0.27 | 0.08 | 0.00 | 0.05 | 0.01 | 0.10 | 0.30 |
| 牧草生态用地 | 0.82 | 98.55 | 0.20 | 0.08 | 0.04 | 0.01 | 0.11 | 0.19 |
| 水域生态用地 | 0.16 | 0.08 | 97.58 | 0.24 | 0.48 | 0.08 | 0.81 | 0.56 |
| 其他生态用地 | 0.22 | 0.00 | 3.25 | 96.53 | 0.00 | 0.00 | 0.00 | 0.00 |
| 城镇生活用地 | 0.00 | 0.00 | 0.45 | 0.00 | 98.65 | 0.45 | 0.00 | 0.45 |
| 农村生活用地 | 0.00 | 0.00 | 0.59 | 0.00 | 0.88 | 98.38 | 0.00 | 0.15 |
| 农业生产用地 | 0.28 | 0.14 | 0.43 | 0.00 | 0.92 | 0.54 | 96.69 | 1.00 |
| 工矿生产用地 | 0.00 | 0.00 | 0.00 | 0.00 | 1.89 | 0.00 | 3.77 | 94.34 |
表4 2000—2015年长江经济带主要功能地类转型及其贡献率Tab.4 Major Functional Land Transformation and Contribution Rate of YREB during 2000-2015 |
| 主要土地利用变化类型 | 生态贡献率 | 占贡献率的 百分比/% | 主要土地利用变化类型 | 生态贡献率 | 占贡献率的 百分比/% | ||
|---|---|---|---|---|---|---|---|
| 生 态 环 境 正 效 应 | 其他生态用地—水域生态用地 | 0.01804 | 51.37 | 生 态 环 境 负 效 应 | 水域生态用地—工矿生产用地 | 0.00241 | 13.52 |
| 工矿生产用地—农业生产用地 | 0.00528 | 15.03 | 水域生态用地—农业生产用地 | 0.00235 | 13.19 | ||
| 农村生活用地—水域生态用地 | 0.00224 | 6.39 | 林地生态用地—工矿生产用地 | 0.00216 | 12.13 | ||
| 其他生态用地—林地生态用地 | 0.00186 | 5.29 | 水域生态用地—城镇生活用地 | 0.00182 | 10.24 | ||
| 城镇生活用地—水域生态用地 | 0.00171 | 4.87 | 农业生产用地—工矿生产用地 | 0.00140 | 7.86 | ||
| 农业生产用地—林地生态用地 | 0.00162 | 4.63 | 水域生态用地—其他生态用地 | 0.00133 | 7.48 | ||
| 农业生产用地—水域生态用地 | 0.00125 | 3.55 | 牧草生态用地—工矿生产用地 | 0.00116 | 6.51 | ||
| 工矿生产用地—城镇生活用地 | 0.00095 | 2.69 | 农业生产用地—城镇生活用地 | 0.00083 | 4.65 | ||
| 牧草生态用地—林地生态用地 | 0.00090 | 2.57 | 牧草生态用地—其他生态用地 | 0.00059 | 3.30 | ||
| 农业生产用地—牧草生态用地 | 0.00066 | 1.87 | 林地生态用地—农业生产用地 | 0.00058 | 3.26 | ||
| 水域生态用地—林地生态用地 | 0.00046 | 1.32 | 牧草生态用地—农业生产用地 | 0.00052 | 2.90 | ||
| 合计 | 0.03497 | 99.59 | 农业生产用地—农村生活用地 | 0.00049 | 2.73 | ||
| 牧草生态用地—水域生态用地 | 0.00036 | 2.02 | |||||
| 林地生态用地—城镇生活用地 | 0.00034 | 1.88 | |||||
| 合计 | 0.01633 | 91.69 |
| [1] |
|
| [2] |
|
| [3] |
黄金川, 林浩曦, 漆潇潇. 面向国土空间优化的三生空间研究进展[J]. 地理科学进展, 2017, 36(3):378-391.
|
| [4] |
吴艳娟, 杨艳昭, 杨玲, 等. 基于“三生空间”的城市国土空间开发建设适宜性评价——以宁波市为例[J]. 资源科学, 2016, 38(11):2 072-2 081.
|
| [5] |
|
| [6] |
|
| [7] |
龙花楼. 论土地利用转型与土地资源管理[J]. 地理研究, 2015, 34(9):1 607-1 618.
|
| [8] |
龙花楼, 屠爽爽. 土地利用转型与乡村振兴[J]. 中国土地科学, 2018, 32(7):1-6.
|
| [9] |
刘永强, 龙花楼. 黄淮海平原农区土地利用转型及其动力机制[J]. 地理学报, 2016, 71(4):666-679.
|
| [10] |
苑韶峰, 朱从谋, 李胜男. 基于格网尺度的杭州城西产业集聚区土地利用格局变化及热点分析[J]. 上海国土资源, 2018, 39(1):44-49.
|
| [11] |
|
| [12] |
宋小青. 论土地利用转型的研究框架[J]. 地理学报, 2017, 72(3):471-487.
|
| [13] |
张佰林, 高江波, 高阳, 等. 中国山区农村土地利用转型解析[J]. 地理学报, 2018, 73(3):503-517.
|
| [14] |
李婷婷, 龙花楼. 基于“人口—土地—产业”视角的乡村转型发展研究——以山东省为例[J]. 经济地理, 2015, 35(10):149-155,138.
|
| [15] |
程建, 程久苗. 中国省际土地利用隐性形态时空格局、驱动力与转型模式[J]. 中国土地科学, 2017, 31(12):60-68.
|
| [16] |
廖柳文, 秦建新, 刘永强, 等. 基于土地利用转型的湖南省生态弹性研究[J]. 经济地理, 2015, 35(9):16-23.
|
| [17] |
|
| [18] |
|
| [19] |
苑韶峰, 唐奕钰. 低碳视角下长江经济带土地利用碳排放的空间分异[J]. 经济地理, 2019, 39(2):190-198.
|
| [20] |
湖南省社会科学院绿色发展研究团队. 长江经济带绿色发展报告(2017)[M]. 北京: 社会科学文献出版社, 2018.
|
| [21] |
|
| [22] |
|
| [23] |
李广东, 方创琳. 城市生态—生产—生活空间功能定量识别与分析[J]. 地理学报, 2016, 71(1):49-65.
|
| [24] |
秦泗刚. 城市边缘区土地利用变化及其生态环境效应[D]. 西安: 西北大学, 2005.
|
| [25] |
|
| [26] |
|
| [27] |
杨清可, 段学军, 王磊, 等. 基于“三生空间”的土地利用转型与生态环境效应——以长江三角洲核心区为例[J]. 地理科学, 2018, 38(1):98-106.
|
| [28] |
胡锋, 安裕伦, 赵海兵. 基于土地利用转型视角的“亚喀斯特”区域生态环境效应研究——以黔中部分地区为例[J]. 地球与环境, 2016, 44(4):447-454.
|
| [29] |
吕立刚, 周生路, 周兵兵, 等. 区域发展过程中土地利用转型及其生态环境响应研究——以江苏省为例[J]. 地理科学, 2013, 33(12):1 442-1 449.
|
| [30] |
罗刚, 廖和平, 李强, 等. 基于“三生空间”的土地利用主导功能转型及其生态环境响应——以重庆市巴南区为例[J]. 西南大学学报:自然科学版, 2018, 40(4):105-113.
|
| [31] |
|
/
| 〈 |
|
〉 |