
空间视角下要素市场扭曲与高技术产业TFP增长——基于电子及通信设备制造业的实证检验
|
汪浩瀚(1964—),男,安徽合肥人,博士,教授,博士生导师。主要研究方向为数量经济与产业经济理论。E-mail:wanghaohan@nbu.edu.cn。 |
收稿日期: 2018-12-28
修回日期: 2019-04-27
网络出版日期: 2025-04-17
基金资助
国家自然科学基金面上项目(71773057)
教育部人文社会科学研究青年基金项目(16YJCZH124)
教育部人文社会科学研究青年基金项目(17YJCZH218)
浙江省科技厅软科学研究项目(2018C35G2070227)
Factor Market Distortion and TFP Growth of High-Tech Industry from the Spatial Perspective:An Empirical Test Based on Manufacturing of Electronic and Communication Equipment
Received date: 2018-12-28
Revised date: 2019-04-27
Online published: 2025-04-17
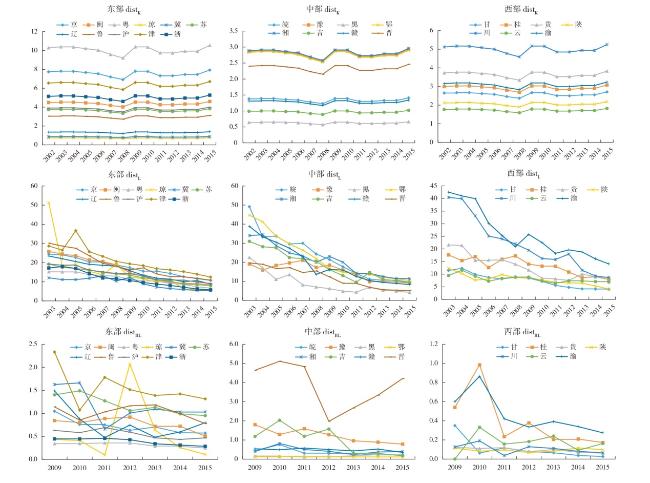
以中国电子及通信设备制造业为例,首先测算资本要素、劳动力要素和研发劳动力要素价格扭曲程度,进而构建空间面板模型检验不同要素价格扭曲对全要素生产率(TFP)的影响并比较其地区差异。结果发现:①资源错配导致的要素价格扭曲程度客观存在,东部资本要素和研发人员要素价格扭曲程度远远高于中西部地区,中西部劳动力要素价格扭曲程度高于东部。②中国电子及通信设备制造业的TFP增长存在显著的空间溢出效应,各类要素市场扭曲对该行业TFP增长呈现显著的抑制作用,抑制作用最大的是劳动力要素市场的扭曲。③不同地区要素市场扭曲对该行业TFP增长的影响差异明显。其中,资本要素扭曲对三大区域TFP增长均呈现显著的抑制作用,劳动力要素仅对东部地区TFP的抑制作用具有统计显著性,研发劳动力要素扭曲能提升东部和中部该行业的TFP,而抑制西部地区该行业的TFP。
汪浩瀚 , 徐建军 , 吕博 . 空间视角下要素市场扭曲与高技术产业TFP增长——基于电子及通信设备制造业的实证检验[J]. 经济地理, 2019 , 39(9) : 129 -137 . DOI: 10.15957/j.cnki.jjdl.2019.09.016
Taking manufacturing industry of China's electronic and telecommunication equipment as a research object, this paper measures the factor market distortion from the perspectives of capital, labor and R&D labor factors, and constructs a spatial panel model to test the effects of different factor distortion on total factor productivity (TFP) growth and compare their regional differences. The results show that: 1) The distortion degree of factor price caused by resource mismatch objectively exists, and the distortion degree of factor price of capital and R&D personnel in eastern China is much higher than that in central and western China, while the distortion degree of labor force in central and western China is higher than that in eastern China; 2) There is a significant spatial spillover effect in the growth of TFP in manufacturing industry of China's electronic and communication equipment, and three factor market distortions have a significant inhibitory effect on the TFP growth, and the biggest inhibitory effect is distortion of labor factor market; 3) Factor market distortions in different regions have significant different impact on the TFP growth. Among them, capital factor distortion has significant inhibition on the TFP growth in the three regions, labor factor only has statistical significance on the TFP growth in the eastern region, and R&D labor factor distortion can restrain industry TFP in the western region and enhance industry TFP in the eastern and central regions.
表1 总样本空间计量模型预检验Tab.1 Pre-test of whole sample based on the spatial econometric model |
| 变量 | noFE | cFE | sFE | tFE | stFE |
|---|---|---|---|---|---|
| C | 0.257***(4.162) | ||||
| lngov | -0.139***(-6.464) | -0.065**(-2.386) | 0.001(0.020) | -0.092***(-3.645) | -0.012(-0.484) |
| lndistk | -0.088**(-2.535) | -0.064*(-1.88) | -0.557***(-5.357) | -0.058*(-1.861) | -1.022***(-6.982) |
| lndistl | -0.025(-0.554) | -0.200***(-3.300) | -0.167(-1.604) | -0.268***(-4.511) | 0.090(0.654) |
| lndistrl | -0.060**(-2.382) | -0.058**(-2.415) | 0.036(0.667) | -0.068***(-3.118) | 0.022(0.542) |
| R2 | 0.222 | 0.291 | 0.465 | 0.381 | 0.684 |
| 0.020 | 0.018 | 0.013 | 0.015 | 0.007 | |
| D-W Stat | 1.835 | 1.828 | 1.366 | 2.225 | 2.125 |
| LogL | 100.375 | 108.871 | 141.542 | 127.314 | 195.954 |
| AIC | -1.059 | -1.141 | -1.226 | -1.278 | -1.124 |
| SC | -0.989 | -1.053 | -0.698 | -1.085 | -1.501 |
| LM Test | 5.562** | 3.018* | 7.177*** | 1.471 | 0.357 |
| Robust LM Test | 4.448** | 13.558*** | 50.497*** | 0.663 | 0.401 |
| LM Test | 16.472*** | 24.787*** | 172.846*** | 2.528 | 1.138 |
| Robust LM Test Error | 15.357*** | 35.327*** | 216.166*** | 1.720 | 1.182 |
| Wald Test(SLM) | 36.721*** | 22.012*** | 84.285*** | ||
| LR Test(SLM) | 33.457*** | 18.452*** | 79.505*** | ||
| Wald Test(SEM) | 12.530** | 19.595*** | 10.692** | ||
| LR Test(SEM) | 27.833*** | 7.061** | 11.469** |
表2 总样本空间面板模型的估计结果Tab.2 Estimation results of whole sample based on the spatial panel model with |
| 变量 | SDPDM | SEPDM | ||||
|---|---|---|---|---|---|---|
| noFE | sFE | noFE | cFE | sFE | ||
| C | 0.287*** | |||||
| (4.691) | ||||||
| lngov | -0.081*** | -0.010 | -0.148*** | -0.079*** | -0.006 | |
| (-3.297) | (-0.36) | (-6.778) | (-3.129) | (-0.205) | ||
| lndistk | -0.065** | -1.057*** | -0.095*** | -0.066** | -1.012*** | |
| (-2.052) | (-6.529) | (-2.823) | (-2.038) | (-6.616) | ||
| lndistl | -0.269*** | 0.120 | -0.057 | -0.248*** | 0.082 | |
| (-4.442) | (0.784) | (-1.221) | (-4.119) | (0.564) | ||
| lndistrl | -0.059** | 0.050 | -0.061** | -0.061** | 0.030 | |
| (-2.330) | (1.077) | (-2.416) | (-2.547) | (0.676) | ||
| W·lngov | 0.022 | -0.018 | ||||
| (0.415) | (-0.162) | |||||
| W·lndistk | 0.219* | 1.098*** | ||||
| (1.662) | (5.437) | |||||
| W·lndistl | 0.280* | -0.420 | ||||
| (1.728) | (-1.31) | |||||
| W·lndistrl | -0.023 | 0.172 | ||||
| (-0.215) | (0.682) | |||||
| ρ/υ | 0.371** | 0.543*** | 0.527*** | 0.527*** | 0.787*** | |
| (2.544) | (4.870) | (4.482) | (4.482) | (13.999) | ||
| ad-R2 | 0.209 | 0.649 | 0.209 | 0.29 | 0.448 | |
| σ2 | 0.018 | 0.009 | 0.018 | 0.016 | 0.009 | |
| LogL | 105.719 | 185.263 | 105.719 | 116.105 | 179.528 | |
表3 子样本空间面板模型的预检验Tab.3 Pre-test of sub-sample based on the spatial panel model |
| 变量 | 东部 | 中部 | 西部 | ||||||
|---|---|---|---|---|---|---|---|---|---|
| cFE | sFE | sFE | cFE | sFE | tFE | stFE | |||
| LM Test | 1.902 | 10.579*** | 0.669 | 3.188* | 3.252* | 1.912 | 2.587 | ||
| Robust LM Test | 4.570** | 17.089*** | 8.818*** | 0.361 | 2.659 | 3.723* | 2.565 | ||
| LM Test | 6.819*** | 65.478*** | 7.426*** | 6.706*** | 20.647*** | 3.684* | 7.434*** | ||
| Robust LM Test | 9.487*** | 71.989*** | 15.575*** | 3.880** | 20.053*** | 5.494** | 7.412*** | ||
| Wald Test(SLM) | 70.736*** | ||||||||
| LR Test(SLM) | 55.468*** | ||||||||
| Wald Test(SEM) | 12.910** | ||||||||
| LR Test(SEM) | 14.586*** | ||||||||
表4 子样本空间计量模型的估计结果Tab.4 Estimation results of sub-sample based on the spatial panel model |
| 变量 | 东部 | 中部 | 西部 | |||||||
|---|---|---|---|---|---|---|---|---|---|---|
| SEPDM | SDPDM | SEPDM | SEPDM | |||||||
| cFE | sFE | sFE | sFE | cFE | sFE | tFE | stFE | |||
| C | 0.383*** | 0.147** | ||||||||
| (3.071) | (2.107) | |||||||||
| lngov | -0.074** | -0.062** | -0.066** | 0.045 | -0.073 | 0.035 | -0.097** | 0.011 | ||
| (-1.970) | (-1.991) | (-2.202) | (0.805) | (-1.641) | (0.804) | (-2.185) | (0.287) | |||
| lndistk | -0.018 | -1.303*** | -1.413*** | -0.704** | -0.323*** | -0.730*** | -0.489*** | -0.935*** | ||
| (-0.474) | (-7.272) | (-7.475) | (-2.088) | (-2.661) | (-4.232) | (-4.028) | (-5.242) | |||
| lndistl | -0.312** | 0.163 | 0.321 | -0.089 | 0.032 | -0.059 | 0.172 | 0.083 | ||
| (-2.313) | (0.877) | (1.639) | (-0.288) | (0.245) | (-0.364) | (1.409) | (0.532) | |||
| lndistrl | -0.092 | 0.203*** | 0.181*** | -0.106 | -0.060 | 0.053 | -0.096* | 0.060 | ||
| (-1.537) | (3.713) | (3.335) | (-1.02) | (-1.026) | (0.883) | (-1.779) | (1.044) | |||
| W*lngov | -0.011 | |||||||||
| (-0.125) | ||||||||||
| W*lndistk | 1.710*** | |||||||||
| (6.620) | ||||||||||
| W*lndistl | -0.199 | |||||||||
| (-0.734) | ||||||||||
| W*lndistrl | -0.450** | |||||||||
| (-2.047) | ||||||||||
| ρ/υ | 0.441*** | 0.789*** | 0.628*** | 0.532*** | 0.408*** | 0.591*** | -0.988*** | -0.547* | ||
| (3.286) | (14.069) | (7.078) | (4.506) | (2.676) | (5.407) | (-3.119) | (-1.828) | |||
| ad-R2 | 0.324 | 0.539 | 0.784 | 0.359 | 0.402 | 0.614 | 0.479 | 0.787 | ||
| σ2 | 0.013 | 0.004 | 0.004 | 0.018 | 0.009 | 0.005 | 0.006 | 0.002 | ||
| LogL | 56.494 | 101.759 | 109.051 | 34.013 | 44.054 | 61.23 | 57.709 | 84.850 | ||
| [1] |
王宁. 生产要素市场扭曲的结构效应分析[D]. 杭州: 浙江大学, 2016.
|
| [2] |
白俊红, 卞元超. 要素市场扭曲与中国创新生产的效率损失[J]. 中国工业经济, 2016(11):39-55.
|
| [3] |
钟世川. 中国制造业要素市场扭曲程度的测算及其分解——基于技术进步偏向和资本深化的视角[J]. 经济经纬, 2017, 34(1):88-93.
|
| [4] |
张杰, 周晓艳, 李勇. 要素市场扭曲抑制了中国企业R&D?[J]. 经济研究, 2011, 46(8):78-91.
|
| [5] |
李平, 季永宝. 要素价格扭曲是否抑制了我国自主创新?[J]. 世界经济研究, 2014(1):10-15.
|
| [6] |
吴友军. 我国电子及通信设备制造业技术创新能力研究[D]. 武汉: 武汉理工大学, 2003.
|
| [7] |
刘乃全. 空间集聚论[M]. 上海: 上海财经大学出版社, 2012.
|
| [8] |
陈秀山, 徐瑛. 中国制造业空间结构变动及其对区域分工的影响[J]. 经济研究, 2008, 43(10):104-116.
|
| [9] |
蒋含明. 要素价格扭曲与我国居民收入差距扩大[J]. 统计研究, 2013, 30(12):56-63.
|
| [10] |
赵自芳, 史晋川. 中国要素市场扭曲的产业效率损失——基于DEA方法的实证分析[J]. 中国工业经济, 2006(10):40-48.
|
| [11] |
夏晓华, 李进一. 要素价格异质性扭曲与产业结构动态调整[J]. 南京大学学报:哲学·人文科学·社会科学版, 2012, 49(3):40-48.
|
| [12] |
|
| [13] |
尚晓晔. 要素市场扭曲对中国产业结构优化升级的影响[J]. 求索, 2016(9):114-118.
|
| [14] |
戴魁早, 刘友金. 要素市场扭曲、区域差异与R&D投入——来自中国高技术产业与门槛模型的经验证据[J]. 数量经济技术经济研究, 2015, 32(9):3-20.
|
/
| 〈 |
|
〉 |