
晋陕蒙地区经济增长与碳排放时空耦合关系
|
武娜(1982—),女,山西长治人,博士研究生。主要研究方向为能源经济与能源安全、碳排放等。E-mail:wun.16b@igsnrr.ac.cn。 |
收稿日期: 2018-12-12
修回日期: 2019-06-27
网络出版日期: 2025-04-17
基金资助
中国科学院战略性先导科技专项(A类)(XDA19040102)
科技部国家重点研发计划(2016YFA0602802)
国家自然科学基金面上项目(41771566)
Spatio-Temporal Coupling Relationship between Economic Growth and Carbon Emission in Shanxi-Shaanxi-Inner Mongolia
Received date: 2018-12-12
Revised date: 2019-06-27
Online published: 2025-04-17
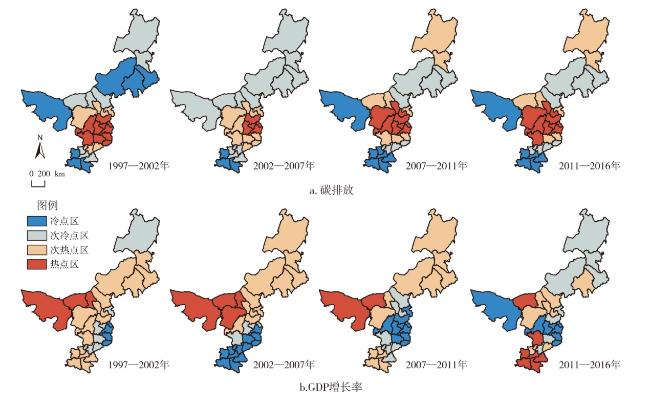
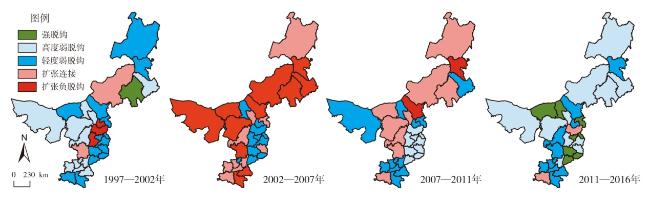
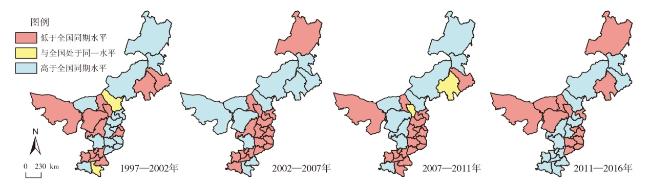
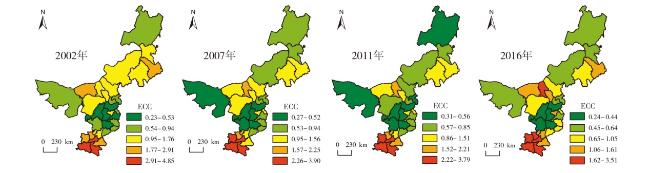
晋陕蒙地区作为重要的能源输出基地,能源消费带动经济增长的同时,产生的大量碳排放,对经济增长带来负面影响。因此,探讨经济增长与碳排放的关系尤为重要。根据“驱动力—压力—状态—影响—响应”即DPSIR模型,制定经济增长与碳排放关系的脱钩指标,构建脱钩模型分析碳排放与经济增长间的脱钩关系,并且运用GIS方法评价晋陕蒙地区经济增长与碳排放的时空演变规律。结果表明:①1997—2016年晋陕蒙地区碳排放与经济增长热点区和冷点区空间格局变化显著;②晋陕蒙地区经济增长与碳排放的脱钩状态经历了从“弱脱钩”到“扩张连接、扩张负脱钩”再到“弱脱钩”的演变过程;③2002—2016年山西碳排放与经济增长的脱钩程度低于全国同期水平。
武娜 , 沈镭 , 钟帅 , 张超 . 晋陕蒙地区经济增长与碳排放时空耦合关系[J]. 经济地理, 2019 , 39(9) : 17 -23 . DOI: 10.15957/j.cnki.jjdl.2019.09.003
Energy consumption drives economic growth in Shanxi Province, Shaanxi Province and Inner Mongolia Autonomous Region which are the most important parts of energy output, at the same time, the large amount of carbon emissions has a negative impact on economic growth. Therefore, it is particularly important to discuss the relationship between economic growth and carbon emission. According to the "Driving Force-Pressure-State-Impact-Response", namely the DPSIR model, this article selects decoupling index of carbon emissions and economic growth, builds a decoupling model to analyze decoupling relationship between carbon emissions and economic growth, and uses the GIS to evaluate the spatio-temporal evolution of carbon emission and economic growth. The results show that hot spots and cold spots of carbon emission and economic growth in Shanxi, Shaanxi and Inner Mongolia change significantly from 1997 to 2016.The decoupling state of carbon emission and economic growth in Shanxi, Shaanxi and Inner Mongolia has experienced an evolutionary process from "weak decoupling" to "expansion connection, expansion negative decoupling" and then to "weak decoupling".The degree of decoupling between carbon emission and economic growth in Shanxi Province from 2002 to 2016 is lower than of the national average at the same period in China. Grasping the coupling relationship and development trend between economic growth and carbon emission can provide some references in formulating emission reduction policies.
表1 碳排放与经济增长脱钩程度判定标准Tab.1 Criterion for decoupling degree between carbon emission and economic growth |
| 脱钩程度 | ∆C | ∆G | 脱钩弹性t |
|---|---|---|---|
| 脱钩 强脱钩Ⅰ | |||
| 弱脱钩Ⅱ | |||
| 衰退脱钩Ⅲ | |||
| 连接 扩张连接Ⅳ | |||
| 衰退连接Ⅴ | |||
| 负脱钩 扩张负脱钩Ⅵ | |||
| 弱负脱钩Ⅶ | |||
| 强负脱钩Ⅷ |
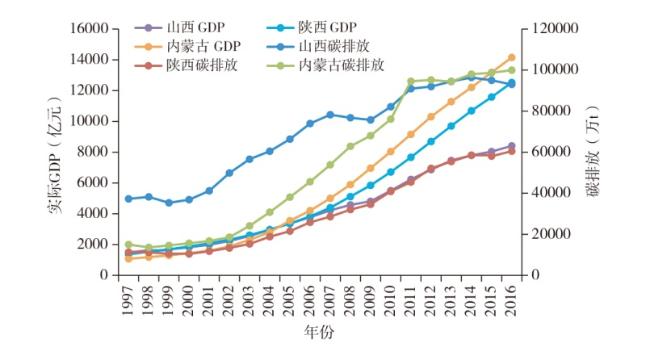
图2 1997—2016年晋陕蒙GDP与碳排放总量变动趋势比较Fig.2 Comparison of GDP and total carbon emission in Shanxi-Shaanxi-Inner Mongolia from 1997 to 2016 |
表2 1997—2016年晋陕蒙GDP与碳排放脱钩相关指标结果Tab.2 Decoupling elasticity of GDP and carbon emission in Shanxi-Shaanxi-Inner Mongolia from 1997 to 2016 |
| T1 | T2 | T3 | T4 | ||||||||||||
|---|---|---|---|---|---|---|---|---|---|---|---|---|---|---|---|
| g1 | c1 | t1 | g2 | c2 | t2 | g3 | c3 | t3 | g3 | c3 | t3 | ||||
| 呼伦贝尔 | 0.452 | 0.261 | 0.577 | 1.364 | 1.504 | 1.102 | 0.770 | 0.721 | 0.936 | 0.558 | 0.035 | 0.062 | |||
| 兴安 | 0.531 | 0.394 | 0.742 | 0.840 | 1.391 | 1.656 | 0.657 | 0.995 | 1.514 | 0.567 | 0.230 | 0.405 | |||
| 锡林郭勒 | 0.524 | 0.586 | 1.119 | 1.639 | 3.152 | 1.923 | 0.870 | 0.989 | 1.137 | 0.573 | 0.153 | 0.266 | |||
| 通辽 | 0.874 | 0.147 | 0.169 | 1.448 | 2.406 | 1.662 | 0.848 | 0.564 | 0.666 | 0.558 | 0.167 | 0.298 | |||
| 赤峰 | 0.434 | -0.002 | -0.004 | 1.381 | 1.772 | 1.283 | 0.835 | 0.689 | 0.825 | 0.551 | 0.097 | 0.177 | |||
| 乌兰察布 | 0.867 | 0.373 | 0.430 | 1.456 | 2.281 | 1.567 | 0.619 | 0.867 | 1.402 | 0.492 | 0.212 | 0.431 | |||
| 阿拉善 | 0.819 | 0.328 | 0.400 | 1.822 | 2.339 | 1.284 | 1.207 | 0.730 | 0.605 | 0.570 | 0.069 | 0.121 | |||
| 包头 | 0.745 | 0.115 | 0.154 | 2.008 | 1.571 | 0.783 | 0.884 | 0.519 | 0.586 | 0.552 | -0.077 | -0.140 | |||
| 巴彦淖尔 | 0.602 | 0.366 | 0.609 | 1.252 | 2.151 | 1.718 | 0.762 | 0.838 | 1.099 | 0.488 | -0.081 | -0.167 | |||
| 呼和浩特 | 1.201 | 0.411 | 0.342 | 1.753 | 1.633 | 0.931 | 0.656 | 0.539 | 0.822 | 0.537 | 0.031 | 0.058 | |||
| 大同 | 0.488 | 0.287 | 0.588 | 0.499 | 0.539 | 1.081 | 0.411 | 0.271 | 0.659 | 0.409 | -0.038 | -0.093 | |||
| 鄂尔多斯 | 1.294 | 0.295 | 0.228 | 2.387 | 3.067 | 1.285 | 1.071 | 1.238 | 1.156 | 0.546 | 0.096 | 0.177 | |||
| 朔州 | 0.299 | 0.378 | 1.264 | 1.012 | 0.674 | 0.665 | 0.617 | 0.441 | 0.716 | 0.294 | 0.208 | 0.706 | |||
| 乌海 | 0.902 | 0.127 | 0.140 | 1.970 | 1.290 | 0.655 | 0.971 | 0.466 | 0.480 | 0.574 | -0.104 | -0.181 | |||
| 忻州 | 0.304 | 0.472 | 1.556 | 0.884 | 0.664 | 0.752 | 0.471 | 0.156 | 0.332 | 0.373 | 0.303 | 0.811 | |||
| 榆林 | 0.579 | 0.182 | 0.314 | 1.408 | 1.436 | 1.020 | 0.931 | 0.833 | 0.894 | 0.471 | 0.345 | 0.732 | |||
| 吕梁 | 0.208 | 0.324 | 1.561 | 1.073 | 0.623 | 0.581 | 0.568 | 0.191 | 0.336 | 0.180 | 0.058 | 0.320 | |||
| 阳泉 | 0.411 | 0.215 | 0.524 | 0.761 | 0.511 | 0.671 | 0.511 | 0.151 | 0.295 | 0.265 | -0.014 | -0.054 | |||
| 太原 | 0.565 | 0.313 | 0.553 | 0.993 | 0.510 | 0.514 | 0.353 | 0.092 | 0.261 | 0.445 | -0.035 | -0.079 | |||
| 晋中 | 0.451 | 0.319 | 0.707 | 0.896 | 0.611 | 0.682 | 0.504 | 0.140 | 0.279 | 0.436 | 0.048 | 0.111 | |||
| 延安 | 0.748 | 0.716 | 0.957 | 1.156 | 2.383 | 2.062 | 0.645 | 0.591 | 0.916 | 0.288 | 0.207 | 0.719 | |||
| 长治 | 0.552 | 0.307 | 0.556 | 0.923 | 0.844 | 0.914 | 0.591 | 0.140 | 0.237 | 0.281 | 0.010 | 0.036 | |||
| 临汾 | 0.639 | 0.361 | 0.565 | 0.841 | 0.395 | 0.469 | 0.464 | 0.096 | 0.207 | 0.296 | -0.058 | -0.197 | |||
| 晋城 | 0.554 | 0.251 | 0.453 | 0.940 | 0.600 | 0.638 | 0.525 | 0.144 | 0.275 | 0.365 | -0.050 | -0.136 | |||
| 渭南 | 0.538 | 0.045 | 0.083 | 0.787 | 0.665 | 0.845 | 0.758 | 0.528 | 0.697 | 0.653 | 0.253 | 0.388 | |||
| 运城 | 0.664 | 0.475 | 0.715 | 0.979 | 0.582 | 0.595 | 0.507 | 0.148 | 0.293 | 0.309 | -0.002 | -0.007 | |||
| 铜川 | 0.548 | 0.178 | 0.325 | 0.873 | 0.609 | 0.698 | 0.809 | 0.464 | 0.573 | 0.691 | 0.319 | 0.462 | |||
| 咸阳 | 0.764 | 0.126 | 0.165 | 0.843 | 0.898 | 1.065 | 0.735 | 0.502 | 0.684 | 0.686 | 0.306 | 0.447 | |||
| 宝鸡 | 0.633 | 0.093 | 0.146 | 0.907 | 0.731 | 0.806 | 0.740 | 0.534 | 0.722 | 0.741 | 0.325 | 0.439 | |||
| 西安 | 0.841 | 0.106 | 0.126 | 0.935 | 0.879 | 0.940 | 0.735 | 0.497 | 0.676 | 0.610 | 0.246 | 0.403 | |||
| 商洛 | 0.727 | 0.251 | 0.346 | 0.650 | 1.852 | 2.849 | 0.747 | 0.355 | 0.475 | 0.755 | 0.413 | 0.548 | |||
| 安康 | 0.418 | 0.182 | 0.436 | 0.622 | 1.444 | 2.323 | 0.763 | 0.554 | 0.726 | 0.821 | 0.619 | 0.754 | |||
| 汉中 | 0.444 | 0.322 | 0.726 | 0.729 | 0.829 | 1.138 | 0.732 | 0.666 | 0.910 | 0.731 | 0.623 | 0.852 |
| [1] |
|
| [2] |
|
| [3] |
易艳春, 宋德勇. 经济增长与我国碳排放:基于环境库兹涅茨曲线的分析[J]. 经济体制改革, 2011(3):35-38.
|
| [4] |
|
| [5] |
赵爱文, 李东. 中国碳排放与经济增长的协整与因果关系分析[J]. 长江流域资源与环境, 2011, 20(11):1 297-1 303.
|
| [6] |
刘惠敏. 中国经济增长与能源消耗的脱钩——东部地区的时空分异研究[J]. 中国人口·资源与环境, 2016, 26(12):157-163.
|
| [7] |
彭佳雯, 黄贤金, 钟太洋, 等. 中国经济增长与能源碳排放的脱钩研究[J]. 资源科学, 2011, 33(4):626-633.
|
| [8] |
赵可, 徐唐奇, 张安录. 城市用地扩张、规模经济与经济增长质量[J]. 自然资源学报, 2016, 31(3):390-401.
|
| [9] |
黄木易, 岳文泽, 何翔. 长江经济带城市扩张与经济增长脱钩关系及其空间异质性[J]. 自然资源学报, 2018, 33(2):219-232.
|
| [10] |
赵兴国, 潘玉君, 赵波, 等. 区域资源环境与经济发展关系的时空分析[J]. 地理科学进展, 2011, 30(6):706-714.
|
| [11] |
|
| [12] |
|
| [13] |
|
| [14] |
滕飞, 曹丹, 全紫薇, 等. 东北三省碳排放与经济增长脱钩关系的实证分析[J]. 吉林师范大学学报(自然科学版), 2018, 39(3):56-63.
|
| [15] |
郭炳南, 林基, 刘堂发. 长三角地区二氧化碳排放与经济增长脱钩关系的实证研究[J]. 生态经济, 2017, 33(4):25-29.
|
| [16] |
杨嵘, 常烜钰. 西部地区碳排放与经济增长关系的脱钩及驱动因素[J]. 经济地理, 2012, 32(12):34-39.
|
| [17] |
孙耀华, 李忠民. 中国各省区经济发展与碳排放脱钩关系研究[J]. 中国人口·资源与环境, 2011, 21(5):87-92.
|
| [18] |
盖美, 曹桂艳, 田成诗, 等. 辽宁沿海经济带能源消费碳排放与区域经济增长脱钩分析[J]. 资源科学, 2014, 36(6):1267-1 277.
|
| [19] |
陈芷君, 刘毅华, 林华荣. 广东省土地利用碳排放与经济增长之间的脱钩分析[J]. 生态经济, 2018, 34(5):26-32.
|
| [20] |
齐绍洲, 林屾, 王班班. 中部六省经济增长方式对区域碳排放的影响——基于Tapio脱钩模型、面板数据的滞后期工具变量法的研究[J]. 中国人口·资源与环境, 2015, 25(5):59-66.
|
| [21] |
马荣华, 蒲英霞, 马晓冬. GIS空间关联模式发现[M]. 北京: 科学出版社, 2007.
|
| [22] |
彭翀, 常黎丽. 湖南省县域城镇化时空格局及其经济发展相关性研究[J]. 经济地理, 2013, 33(8):73-78.
|
| [23] |
王刚, 张华兵, 薛菲, 等. 成都市县域土地利用碳收支与经济发展关系研究[J]. 自然资源学报, 2017, 32(7):1 170-1 182.
|
| [24] |
沈镭, 高丽. 中国西部能源及矿业开发与环境保护协调发展研究[J]. 中国人口·资源与环境, 2013, 23(10):17-23.
|
| [25] |
沈明, 沈镭, 张超, 等. 陕西省能源供给与经济及生态环境协调性分析[J]. 地域研究与开发, 2015, 34(1):123-126,143.
|
| [26] |
沈明, 沈镭, 张艳, 等. 陕西省能源供给系统稳定性及其影响因素分析[J]. 经济地理, 2015, 35(7):39-46.
|
/
| 〈 |
|
〉 |