
中国城乡居民消费的空间结构演变及城镇化影响
|
温桂荣(1970—),女,陕西户县人,硕士,副教授,研究方向为财税政策与收入分配。E-mail:573838630@qq.com |
收稿日期: 2020-10-12
修回日期: 2021-04-26
网络出版日期: 2025-04-17
基金资助
国家社会科学基金一般项目(18BJY219)
国家自然科学基金面上项目(72073041)
Spatial Structure Evolution of Urban and Rural Residents' Consumption and the Impact of Urbanization in China
Received date: 2020-10-12
Revised date: 2021-04-26
Online published: 2025-04-17
运用我国1998—2018年31个省份面板数据,首先将时间划分为四个阶段,将消费分为八大类,基于莫兰散点图分析城乡居民消费的空间结构演变规律;其次,采用空间杜宾模型分析城镇化对城乡居民消费的影响。空间结构演变分析发现:城镇居民人均消费在空间上呈现增强趋势,但交通、教育和医疗消费在第四阶段(2013—2018:经济新常态)的“虹吸效应”减弱,空间集聚状态呈现出高高、低低集聚形态;农村居民的交通、教育和医疗消费结构与城镇相似,但其空间结构较为稳定,变化趋势不大。空间杜宾模型检验中发现:城镇化对城乡居民消费影响显著,存在正向直接效应,对城乡居民消费存在较强的负向空间溢出效应。中国地域广阔,为保证区域协调发展,应避免较强的“虹吸效应”,保证经济要素有效流动,促使要素资源在城乡及省域之间多向流动;各省份需要提高自身发展能力,通过新型城镇化建设促进就业,提高居民收入,促进居民消费,从而避免消费等资源外流。
温桂荣 , 黄纪强 , 吴慧桢 . 中国城乡居民消费的空间结构演变及城镇化影响[J]. 经济地理, 2021 , 41(5) : 85 -94 . DOI: 10.15957/j.cnki.jjdl.2021.05.010
Based on the data of 31 provinces and cities from 1998 to 2018, this paper firstly divides the time period into four stages and classifies the total consumption into eight categories, then analyzes the spatial structure evolution of urban and rural residents' consumption with the Moran index. Based on the panel data of provinces and cities from 2008 to 2018,it adopts the spatial Durbin model to analyze the impact of urbanization on urban and rural residents' consumption. In the evolution of spatial structure,it is found that the per capita consumption of urban residents presents an increasing trend in space,but the "siphon effect" of consumption in transportation,education and medical care are weakened in the fourth stage which is the new normal of China's economy from 2013 to 2018. Besides,the spatial agglomeration shows an uneven trend. The structure of rural residents' consumption in transportation,education and medical treatment is similar to that in cities and towns,but its spatial structure is relatively stable with little change. In the spatial Durbin model test,it is found that urbanization has a significant positive direct impact on the consumption of urban and rural residents,and a strong spatial spillover effect on the consumption of urban and rural residents. To ensure the coordinated development between different regions,China should avoid a strong "siphon effect",ensure the effective mobilization of economic factors,and promote the multi-directional flow of resources between urban and rural areas and provinces. From the aspect of provinces and cities,it need to improve their own development capacity to promote employment,increase residents' income and promote residents' consumption by building a new type of urbanization,so as to avoid the outflow of consumption and other resources.
表1 变量定义及说明Tab.1 Variable definition and description |
| 变量类型 | 变量名称(符号) | 变量计算 |
|---|---|---|
| 被解释变量 | 城镇居民人均消费(czconit) | 城镇居民人均消费取对数 |
| 农村居民人均消费(ncconit) | 农村居民人均消费取对数 | |
| 解释变量 | 城镇化(urbanit) | 城镇居民占常住人口比重 |
| 控制变量 | 城镇人均可支配收入(czincit) | 城镇人均可支配收入取对数 |
| 农村人均可支配收入(ncincit) | 农村人均可支配收入取对数 | |
| GDP(gdpit) | GDP取对数 | |
| 第三产业比重(scyit) | 第三产业增加值占GDP比重 | |
| 商品房价格(spfjgit) | 商品房价格取对数 | |
| 公路铁路拥有量(mjit) | 公路铁路(万km)/省份总面积(万km2) | |
| 互联网宽带接入端口(wlit) | 互联网宽带接入端口(万)取对数 | |
| 财政支出(czzcit) | 财政支出取对数 | |
| 城镇消费价格指数(czcpiit) | 城镇消费价格指数 | |
| 农村消费价格指数(nccpiit) | 农村消费价格指数 |
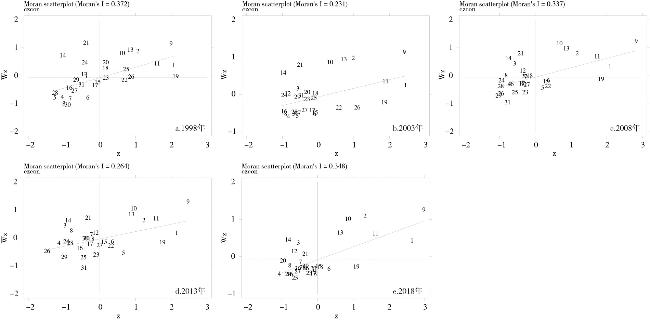
表2 各阶段城镇居民各项消费的空间平均自相关系数Tab.2 The spatial average autocorrelation coefficient of various consumption of urban residents in each stage |
| 阶段 | 人均消费 | 食品 | 衣着 | 居住 | 设备服务 | 交通 | 文教娱乐 | 医疗 | 其他 |
|---|---|---|---|---|---|---|---|---|---|
| 1998—2002 | 0.295 | 0.429 | 0.261 | 0.315 | 0.349 | 0.221 | 0.191 | 0.134 | 0.195 |
| 2003—2007 | 0.280 | 0.395 | 0.243 | 0.357 | 0.312 | 0.202 | 0.250 | 0.258 | 0.164 |
| 2008—2012 | 0.307 | 0.352 | 0.307 | 0.409 | 0.256 | 0.334 | 0.376 | 0.391 | 0.204 |
| 2013—2018 | 0.315 | 0.292 | 0.436 | 0.268 | 0.405 | 0.229 | 0.178 | 0.155 | 0.239 |
注:在计算1998—2018年的各项消费空间自相关系数时,99%的变量均通过了1%、5%及10%的显著性水平的检验,由于上述计算的是平均值,所以Z值和显著性水平符号没有进行报告。具体各项年份的莫兰指数,感兴趣的可以联系作者。各项消费均表示人均消费,下同。 |
表3 城镇居民消费的空间聚集变化表Tab.3 Spatial aggregation change table of urban residents' consumption |
| 象限 | 状态 | 1998 | 2003 | 2008 | 2013 | 2018 |
|---|---|---|---|---|---|---|
| 第一象限 | HH | 12 | 6 | 6 | 6 | 6 |
| 第二象限 | LH | 5 | 7 | 5 | 6 | 4 |
| 第三象限 | LL | 12 | 15 | 15 | 14 | 18 |
| 第四象限 | HL | 2 | 3 | 5 | 5 | 3 |
注:HH、LH、LL和HL分别表示高观测值被高观测值包围、低观测值被高观测值包围、低观测值被低观测值包围和高观测值被低观测值包围,表5同。 |
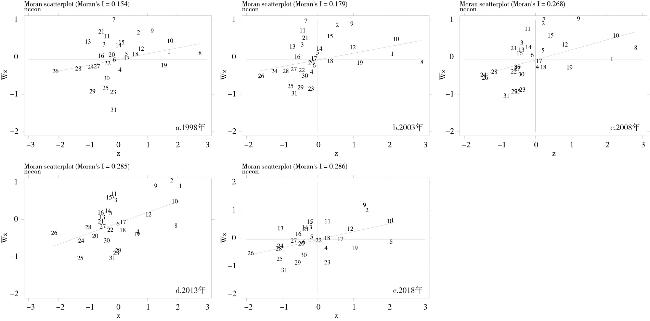
表4 各阶段农村居民各项消费的空间平均自相关系数Tab.4 The spatial average autocorrelation coefficient of various consumption of rural residents in each stage |
| 阶段 | 人均消费 | 食品 | 衣着 | 居住 | 设备服务 | 交通 | 文教娱乐 | 医疗 | 其他 |
|---|---|---|---|---|---|---|---|---|---|
| 1998—2002 | 0.168 | 0.133 | 0.334 | 0.221 | 0.146 | 0.250 | 0.216 | 0.172 | 0.175 |
| 2003—2007 | 0.185 | 0.125 | 0.327 | 0.204 | 0.138 | 0.286 | 0.284 | 0.156 | 0.237 |
| 2008—2012 | 0.218 | 0.146 | 0.411 | 0.140 | 0.212 | 0.273 | 0.346 | 0.188 | 0.336 |
| 2013—2018 | 0.206 | 0.104 | 0.409 | 0.238 | 0.195 | 0.249 | 0.266 | 0.138 | 0.172 |
图2 中国农村居民各阶段人均消费的莫兰散点图Fig.2 Moran scatter plot of the per capita consumption of Chinese rural residents in each stage |
表5 农村居民消费的空间聚集变化表Tab.5 Spatial aggregation change table of rural residents' consumption |
| 象限 | 状态 | 1998 | 2003 | 2008 | 2013 | 2018 |
|---|---|---|---|---|---|---|
| 第一象限 | HH | 10 | 6 | 10 | 6 | 8 |
| 第二象限 | LH | 9 | 9 | 7 | 9 | 8 |
| 第三象限 | LL | 10 | 14 | 10 | 12 | 12 |
| 第四象限 | HL | 2 | 2 | 4 | 4 | 3 |
表6 城乡居民人均消费效应空间计量回归Tab.6 Spatial econometric regression of the per capita consumption effect of urban and rural residents |
| 变量 | 模型(1):城镇居民 | 模型(2):农村居民 | ||||||
|---|---|---|---|---|---|---|---|---|
| 直接效应 | 间接效应 | 总效应 | 直接效应 | 间接效应 | 总效应 | |||
| urbanit | 0.444***(5.60) | -0.792***(-4.59) | -0.348**(-1.98) | 0.330*(1.80) | -2.356***(-4.44) | -2.026***(-3.80) | ||
| czinit,ncinit | 0.708***(16.37) | 0.228***(5.70) | 0.936***(20.64) | 0.941***(11.95) | 0.371***(5.74) | 1.312***(16.38) | ||
| gdpit | 0.058***(3.28) | 0.019***(2.57) | 0.077***(3.18) | -0.002(-0.06) | -0.001(-0.04) | -0.003(-0.05) | ||
| scyit | 0.061(0.91) | 0.020(0.88) | 0.081(0.91) | 0.181(1.42) | 0.072(1.34) | 0.253(1.41) | ||
| spfjgit | 0.050***(2.80) | 0.016***(2.44) | 0.066**(2.80) | -0.051(-1.59) | -0.02(-1.48) | -0.071(-1.58) | ||
| mjit | -0.048**(-2.42) | -0.015**(-2.17) | -0.063(-2.41) | 0.037(0.54) | 0.014(0.51) | 0.052(0.53) | ||
| wlit | -0.029**(-5.54) | -0.010**(-2.07) | -0.039**(-2.45) | 0.008(0.37) | 0.003(0.31) | 0.011(0.36) | ||
| czzcit | 0.090*(1.71) | 0.029*(1.66) | 0.119*(1.75) | -0.142(-1.24) | -0.056(-1.19) | -0.198(-1.24) | ||
| czcpiit,nccpiit | -0.002(-1.62) | -0.001(-1.55) | -0.002(-1.62) | -0.002(-1.20) | -0.001(-1.15) | -0.003(-1.20) | ||
| 时间 | 是 | 是 | ||||||
| 省份 | 是 | 是 | ||||||
| rho | 0.255***(6.65) | 0.300***(6.10) | ||||||
| N | 341 | 341 | ||||||
| R2 | 0.9594 | 0.8872 | ||||||
注:*、**和***分别表示在10%、5%和1%的显著性水平下显著,括号内表示的是T值,模型均采用稳健性标准估计,在变量一列中的2个变量,其中czinit、czcpiit表示对城镇的影响,ncinit、nccpiit表示对农村的影响,其他的变量均一致,下同。 |
| [1] |
|
| [2] |
黄彩虹, 张晓青. 创新驱动、空间溢出与居民消费需求[J]. 经济问题探索, 2020(2):11-20.
|
| [3] |
毛中根, 武优勐. 中国西部地区城市群消费水平空间结构演变分析——以成渝城市群为例[J]. 湘潭大学学报:哲学社会科学版, 2020, 44(2):50-55.
|
| [4] |
尹向来, 张晓青, 白晨, 等. 社会消费水平时空演变及其影响机制——基于地级市面板数据的空间计量研究[J]. 消费经济, 2018, 34(1):80-90,97-99.
|
| [5] |
刘明. 中国居民消费空间效应问题研究——基于消费理论的检验[J]. 经济问题探索, 2015(10):27-32.
|
| [6] |
龚志民, 李华郁. 二十一世纪以来我国地区消费结构差异研究[J]. 邵阳学院学报:自然科学版, 2019(1):15-26.
|
| [7] |
|
| [8] |
张忠杰, 凌雪. 中国城镇化对居民消费影响的实证研究[J]. 统计与决策, 2019, 35(8):126-130.
|
| [9] |
刘冬辉, 孟令杰, 陈立梅. 江苏省农村信息消费的空间格局及其动态演变[J]. 中国农业资源与区划, 2019, 40(12):147-153.
|
| [10] |
陈星星. 集聚还是分散:中国行业能源消费存在空间异质性吗[J]. 山西财经大学学报, 2018, 40(9):48-61.
|
| [11] |
|
| [12] |
|
| [13] |
|
| [14] |
|
| [15] |
|
| [16] |
汪希成, 谢冬梅. 我国农村居民食物消费结构的合理性与空间差异[J]. 财经科学, 2020(3):120-132.
|
| [17] |
唐为, 王媛. 行政区划调整与人口城市化:来自撤县设区的经验证据[J]. 经济研究, 2015, 50(9):72-85.
|
| [18] |
邹小芳. 乡城人口迁移对我国居民消费增长动态影响的实证分析——基于变参数状态空间模型方法(英文)[J]. Agricultural Science & Technology, 2016, 17(2):471-475.
|
| [19] |
温涛, 王汉杰, 韩佳丽. 城镇化有效驱动了居民消费吗?——兼论人口城镇化与空间城镇化效应[J]. 中国行政管理, 2017(10):92-99.
|
| [20] |
田龙鹏. 住房价格、居民收入水平与消费升级——基于面板分位数回归方法的分析[J]. 消费经济, 2019, 35(6):61-69.
|
| [21] |
马忠玉, 肖宏伟. 空间效应视角下城镇化发展对中国经济增长的影响[J]. 经济与管理研究, 2017, 38(9):26-35.
|
| [22] |
|
| [23] |
郑得坤, 李凌. 城镇化、人口密度与居民消费率[J]. 首都经济贸易大学学报, 2020, 22(2):13-24.
|
| [24] |
范剑平, 向书坚. 我国城乡人口二元社会结构对居民消费率的影响[J]. 管理世界, 1999(5):3-5.
|
| [25] |
李通屏, 郭熙保. 扩大内需的人口经济学:理论与实证[J]. 经济理论与经济管理, 2011(6):20-28.
|
| [26] |
熊湘辉, 徐璋勇. 中国新型城镇化水平及动力因素测度研究[J]. 数量经济技术经济研究, 2018, 35(2):44-63.
|
| [27] |
勒施. 经济空间秩序[M]. 北京: 商务印书馆, 2010.
|
| [28] |
|
| [29] |
|
| [30] |
桂河清, 于开红, 孙豪. 农业转移人口市民化扩大其消费需求的实证研究——基于倾向得分匹配及23无条件分位数分解的方法[J]. 农业技术经济, 2018(8):54-62.
|
| [31] |
威廉·配第. 政治算术[M]. 北京: 中国社会科学出版社, 2010.
|
| [32] |
陈斌开, 陆铭, 钟宁桦. 户籍制约下的居民消费[J]. 经济研究, 2010, 45(S1):62-71.
|
| [33] |
程杰, 尹熙. 流动人口市民化的消费潜力有多大?——基于新时期中国流动人口消费弹性估算[J]. 城市与环境研究, 2020(1):34-54.
|
| [34] |
王一鸣. 改革开放以来我国宏观经济政策的演进与创新[J]. 管理世界, 2018, 34(3):1-10.
|
| [35] |
黄莘绒, 李红波, 胡昊宇. 乡村居民消费空间的特征及其影响机制——以南京“五朵金花”为例[J]. 地域研究与开发, 2018, 37(4):162-167.
|
| [36] |
李亮, 付婷婷. 收入、消费观念与农村迁移人口消费[J]. 消费经济, 2016, 32(1):23-27.
|
| [37] |
王小华, 温涛. 城乡居民消费行为及结构演化的差异研究[J]. 数量经济技术经济研究, 2015, 32(10):90-107.
|
| [38] |
高军波, 韩勇, 喻超, 等. 个体行为视角下中小城市居民就医空间及社会分异研究——兼议与特大城市比较[J]. 人文地理, 2018, 33(6):28-34,86.
|
/
| 〈 |
|
〉 |