
2006—2018年中国区域创新结构演变
|
周麟(1988—),男,河北保定人,博士,助理研究员,研究方向为产业经济与城乡土地利用、城市与区域结构演化。E-mail:darkbluezl@163.com |
收稿日期: 2020-10-09
修回日期: 2021-04-19
网络出版日期: 2025-04-17
基金资助
国家社会科学基金青年项目(20CJL004)
Evolution of China’s Regional Innovation Structure in 2006-2018
Received date: 2020-10-09
Revised date: 2021-04-19
Online published: 2025-04-17
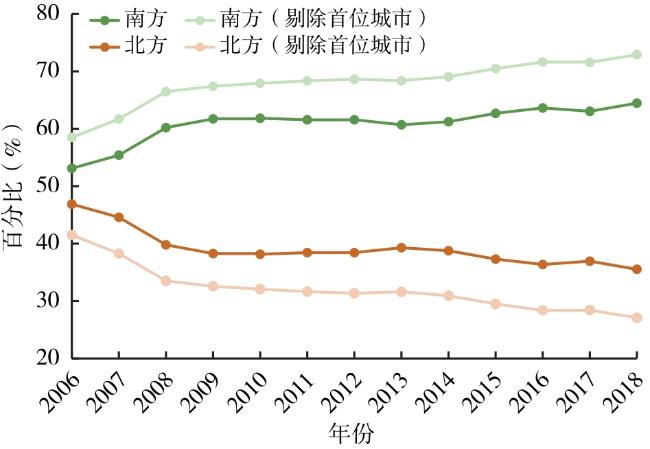
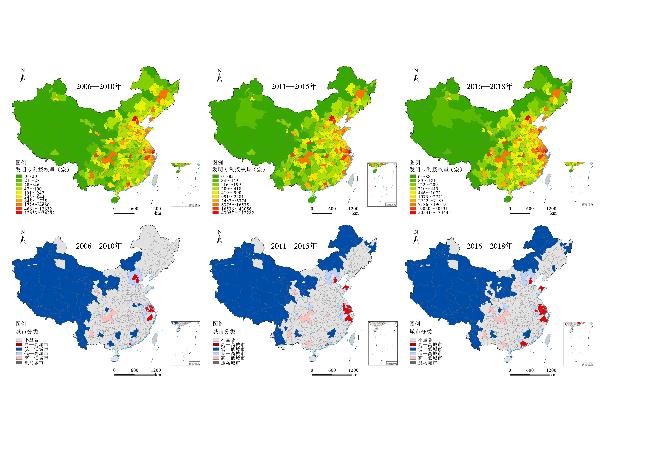
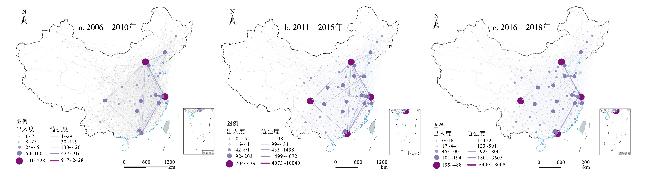
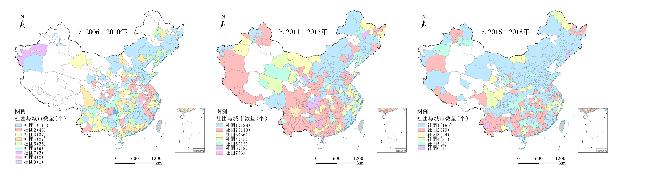
选取中国地级及以上城市作为基本分析单元,基于国家知识产权局公布的2006—2018年国内发明专利数据,通过甄别不断嬗变的区域创新格局,梳理错综复杂的区域创新网络,揭示“十一五”以来中国区域创新结构的演变历程。主要结论包含:①中国区域创新结构整体上存在两个演变趋势:一为南北分异的持续显现,二为区域创新“菱形构架”的日益稳固。②重点城市群的协同创新模式迥异。南方城市群创新分布趋向均衡,各城市群内部创新能级差异逐渐缩小,合作与日俱增。北方城市群则出现极化趋势,不仅城市群内部创新分异加剧,合作减少,城市群之间合作也相对乏力。③中国区域创新结构兼具集聚经济与跨区域协同的双重特征,一小部分创新增长极不仅集聚着越来越多的创新活动,在区域创新网络中也扮演着越发重要的中枢角色。随后,文章从抑制南北创新分异、建立更加有效的城市群协同创新机制、充分发挥成都与成渝城市群在国家区域创新体系建设中的关键作用以及构建数字化区域协同创新平台等方面,对中国区域创新发展提出一系列政策建议。
周麟 , 古恒宇 , 何泓浩 . 2006—2018年中国区域创新结构演变[J]. 经济地理, 2021 , 41(5) : 19 -28 . DOI: 10.15957/j.cnki.jjdl.2021.05.003
Optimizing the structure of regional innovation is the core driving force of China's high-quality economic development in the new era. This paper sheds light on the evolution patterns as well as the networks of the regional innovation in China,aiming at revealing the characteristics of China's regional innovation structure from 2006 to 2018. The findings of the paper can be concluded as follows. Firstly,the results unveil two trends in the patterns of innovation: increased North-South differentiation,and a notable "diamond" structure. Secondly,primary urban agglomerations have presented distinct patterns in innovation,where southern cities show a balanced trend in their innovation,with narrowing in the gap and more frequent innovation cooperation. In contrast,northern cities exhibit a highly concentrated pattern not only represented by an increased difference in inner-agglomeration,but a decreased in innovation cooperation both in inner-agglomeration and inter-agglomeration. Thirdly,characteristics of the economic cluster and cross-regional collaboration are seen in playing a role in China's innovation pattern,where a few areas as the innovation pole have concentrated massive innovation activities and become more crucial in the regional innovation cooperation network. We further put forward some recommendations for regional innovation development on suppressing the difference in innovation between the North of China and the South,establishing a more effective collaborative innovation mechanism for urban agglomerations,enhancing the status of Chengdu and Chengdu-Chongqing urban agglomeration in the construction of national regional innovation system,and the distribution of Comprehensive National Science Centre,and building digital regional collaborative innovation platform.
表1 不同时期重点城市群与部分城市发明专利授权量占总量比(%)Tab.1 The proportion of the total number of invention patents granted in key city clusters and some cities in different periods (%) |
| 2006—2010 | 2011—2015 | 2016—2018 | |
|---|---|---|---|
| 重点城市群 | 89.586 | 89.463 | 90.039 |
| 前1%城市 | 38.523 | 30.570 | 26.800 |
| 前5%城市 | 68.694 | 61.788 | 55.995 |
| 前20%城市 | 90.962 | 88.877 | 88.789 |
表2 不同区域、城市群发明专利授权量HHI指数Tab.2 HHI of invention patent grants in different regions and city clusters |
| 区域 | 2006—2010 | 2011—2015 | 2016—2018 | 变化趋势 | |
|---|---|---|---|---|---|
| 南方 | - | 0.090 | 0.054 | 0.040 | 下降—下降 |
| 北方 | - | 0.187 | 0.173 | 0.179 | 下降—上升 |
| 京津冀城市群 | 北方 | 0.621 | 0.658 | 0.671 | 上升—上升 |
| 山东半岛城市群 | 北方 | 0.147 | 0.148 | 0.182 | 上升—上升 |
| 哈长城市群 | 北方 | 0.367 | 0.407 | 0.412 | 上升—上升 |
| 中原城市群 | 北方 | 0.277 | 0.251 | 0.234 | 下降—下降 |
| 关中城市群 | 北方 | 0.688 | 0.772 | 0.834 | 上升—上升 |
| 长三角城市群 | 南方 | 0.200 | 0.122 | 0.098 | 下降—下降 |
| 珠三角城市群 | 南方 | 0.540 | 0.389 | 0.263 | 下降—下降 |
| 长江中游城市群 | 南方 | 0.290 | 0.257 | 0.247 | 下降—下降 |
| 成渝城市群 | 南方 | 0.393 | 0.370 | 0.366 | 下降—下降 |
| 海峡西岸城市群 | 南方 | 0.175 | 0.164 | 0.161 | 下降—下降 |
图4 不同时期区域创新网络的空间分布特征Fig.4 The spatial distribution characteristics of regional innovation networks in different periods |
表3 不同时期网络中心(出入度)与Top1、Top3中心(腹地数量)Tab.3 Network centers (degree of access) and Top1,Top3 centers (number of hinterlands) in different periods |
| 2006—2010 | 2011—2015 | 2016—2018 | ||||||||
|---|---|---|---|---|---|---|---|---|---|---|
| 网络中心 (出入度) | Top1中心 (腹地数量) | Top3中心 (腹地数量) | 网络中心 (出入度) | Top1中心 (腹地数量) | Top3中心 (腹地数量) | 网络中心 (出入度) | Top1中心 (腹地数量) | Top3中心 (腹地数量) | ||
| 北京(228) | 北京(99) | 北京(145) | 北京(440) | 北京(131) | 北京(236) | 北京(488) | 北京(189) | 北京(257) | ||
| 上海(153) | 上海(31) | 上海(77) | 上海(261) | 深圳(30) | 深圳(84) | 深圳(296) | 深圳(26) | 深圳(106) | ||
| 深圳(100) | 深圳(15) | 深圳(43) | 深圳(255) | 上海(23) | 上海(82) | 成都(277) | 成都(14) | 成都(60) | ||
| 南京(89) | 天津(11) | 杭州(31) | 成都(224) | 成都(20) | 成都(48) | 上海(250) | 佛山(10) | 上海(54) | ||
| 成都(87) | 长沙(11) | 南京(27) | 南京(203) | 广州(20) | 南京(40) | 武汉(194) | 昆明(8) | 武汉(37) | ||
| 天津(79) | 杭州(11) | 天津(24) | 武汉(177) | 武汉(14) | 武汉(35) | 南京(185) | 南京(8) | 南京(36) | ||
| 杭州(78) | 广州(10) | 成都(23) | 广州(173) | 昆明(13) | 广州(34) | 广州(182) | 武汉(8) | 广州(27) | ||
| 广州(70) | 成都(9) | 广州(19) | 天津(157) | 南京(11) | 杭州(30) | 天津(170) | 上海(7) | 杭州(26) | ||
| 武汉(60) | 昆明(8) | 沈阳(15) | 杭州(148) | 杭州(10) | 济南(27) | 苏州(163) | 广州(7) | 西安(23) | ||
| 苏州/长沙(57) | 苏州(8) | 长沙/青岛(13) | 苏州(146) | 青岛(9) | 天津(26) | 西安(160) | 长沙(6) | 苏州(21) | ||
表4 2006—2010年重点城市群之间及其内部协同创新关系 (%)Tab.4 Collaborative innovation relationships among and within key urban agglomerations from 2006 to 2010 (%) |
| 城市群 | 京津冀 | 山东半岛 | 哈长 | 中原 | 关中 | 长三角 | 珠三角 | 长江中游 | 成渝 | 海峡西岸 |
|---|---|---|---|---|---|---|---|---|---|---|
| 京津冀 | 15.131 | 4.091 | 2.651 | 1.897 | 1.554 | 33.326 | 12.160 | 3.154 | 7.110 | 0.980 |
| 山东半岛 | 26.560 | 12.166 | 1.039 | 5.638 | 1.335 | 17.359 | 10.831 | 2.226 | 19.436 | 0.593 |
| 哈长 | 55.769 | 3.365 | 8.654 | 0.962 | 0.000 | 8.654 | 5.769 | 1.442 | 1.923 | 1.442 |
| 中原 | 34.016 | 15.574 | 0.820 | 6.557 | 0.000 | 17.213 | 11.066 | 2.049 | 2.459 | 1.230 |
| 关中 | 32.075 | 4.245 | 0.000 | 0.000 | 5.660 | 31.604 | 7.075 | 3.302 | 5.189 | 0.472 |
| 长三角 | 26.533 | 2.129 | 0.328 | 0.764 | 1.219 | 33.048 | 24.422 | 2.293 | 3.494 | 0.983 |
| 珠三角 | 14.037 | 1.926 | 0.317 | 0.712 | 0.396 | 35.409 | 38.628 | 2.480 | 3.562 | 0.528 |
| 长江中游 | 26.136 | 2.841 | 0.568 | 0.947 | 1.326 | 23.864 | 17.803 | 12.500 | 4.356 | 0.758 |
| 成渝 | 33.513 | 14.116 | 0.431 | 0.647 | 1.185 | 20.690 | 14.547 | 2.478 | 5.603 | 0.970 |
| 海西 | 22.396 | 2.083 | 1.563 | 1.563 | 0.521 | 28.125 | 10.417 | 2.083 | 4.688 | 17.708 |
表5 2011—2015年重点城市群之间及其内部协同创新关系 (%)Tab.5 Collaborative innovation relationships among and within key urban agglomerations from 2011 to 2015 (%) |
| 城市群 | 京津冀 | 山东半岛 | 哈长 | 中原 | 关中 | 长三角 | 珠三角 | 长江中游 | 成渝 | 海峡西岸 |
|---|---|---|---|---|---|---|---|---|---|---|
| 京津冀 | 17.954 | 4.176 | 4.470 | 2.284 | 1.149 | 30.850 | 11.200 | 3.712 | 7.609 | 2.284 |
| 山东半岛 | 25.045 | 14.873 | 1.198 | 5.222 | 0.769 | 18.219 | 9.607 | 1.741 | 17.450 | 0.565 |
| 哈长 | 57.967 | 2.590 | 5.474 | 1.124 | 0.635 | 10.850 | 5.327 | 0.684 | 3.763 | 1.369 |
| 中原 | 22.722 | 8.661 | 0.862 | 3.525 | 0.412 | 37.720 | 3.862 | 4.387 | 4.612 | 0.412 |
| 关中 | 26.203 | 2.921 | 1.117 | 0.945 | 6.014 | 24.141 | 9.794 | 4.467 | 6.959 | 0.773 |
| 长三角 | 25.315 | 2.493 | 0.687 | 3.111 | 0.869 | 28.506 | 26.378 | 1.920 | 3.532 | 1.058 |
| 珠三角 | 15.343 | 2.194 | 0.563 | 0.532 | 0.589 | 44.035 | 18.874 | 3.676 | 6.334 | 1.265 |
| 长江中游 | 27.676 | 2.164 | 0.393 | 3.287 | 1.461 | 17.449 | 20.006 | 11.801 | 5.676 | 0.927 |
| 成渝 | 29.840 | 11.410 | 1.138 | 1.818 | 1.197 | 16.879 | 18.135 | 2.986 | 7.213 | 0.709 |
| 海西 | 33.097 | 1.365 | 1.529 | 0.601 | 0.492 | 18.678 | 13.381 | 1.802 | 2.622 | 21.518 |
表6 2016—2018年重点城市群之间及其内部协同创新关系 (%)Tab.6 Collaborative innovation relationships among and within key urban agglomerations from 2016 to 2018 (%) |
| 城市群 | 京津冀 | 山东半岛 | 哈长 | 中原 | 关中 | 长三角 | 珠三角 | 长江中游 | 成渝 | 海峡西岸 |
|---|---|---|---|---|---|---|---|---|---|---|
| 京津冀 | 19.451 | 6.673 | 2.307 | 3.352 | 1.327 | 30.089 | 8.585 | 4.618 | 6.191 | 4.422 |
| 山东半岛 | 44.565 | 11.025 | 0.642 | 3.434 | 0.558 | 11.405 | 6.261 | 2.032 | 14.827 | 0.535 |
| 哈长 | 49.259 | 2.051 | 9.039 | 0.987 | 1.101 | 14.850 | 5.849 | 1.481 | 5.013 | 1.595 |
| 中原 | 37.014 | 5.678 | 0.511 | 2.279 | 0.668 | 21.041 | 7.328 | 4.460 | 6.601 | 0.255 |
| 关中 | 37.964 | 2.392 | 1.476 | 1.730 | 3.766 | 14.606 | 8.499 | 5.242 | 7.583 | 1.374 |
| 长三角 | 37.394 | 2.122 | 0.864 | 2.368 | 0.635 | 24.642 | 17.698 | 3.086 | 4.178 | 1.585 |
| 珠三角 | 17.706 | 1.933 | 0.565 | 1.368 | 0.613 | 29.369 | 19.951 | 5.888 | 12.826 | 2.198 |
| 长江中游 | 33.471 | 2.205 | 0.503 | 2.927 | 1.328 | 17.999 | 20.694 | 7.839 | 5.273 | 0.954 |
| 成渝 | 27.092 | 9.716 | 1.028 | 2.616 | 1.160 | 14.714 | 27.217 | 3.184 | 5.014 | 1.292 |
| 海西 | 44.947 | 0.814 | 0.759 | 0.235 | 0.488 | 12.963 | 10.830 | 1.338 | 3.001 | 21.407 |
| [1] |
|
| [2] |
|
| [3] |
|
| [4] |
|
| [5] |
|
| [6] |
刘曙光, 韩静. 2005—2015年我国区域创新空间格局演化问题研究[J]. 科技管理研究, 2018(20):103-111.
|
| [7] |
赵勇, 白永秀. 知识溢出:一个文献综述[J]. 经济研究, 2009(1):144-156.
|
| [8] |
|
| [9] |
王秋玉, 曾刚, 吕国庆. 中国装备制造业产学研合作创新网络初探[J]. 地理学报, 2016, 71(2):251-264.
|
| [10] |
曾刚, 王秋玉, 曹贤忠. 创新经济地理研究述评与展望[J]. 经济地理, 2018, 38(4):19-25.
|
| [11] |
|
| [12] |
|
| [13] |
|
| [14] |
马海涛. 知识流动空间的城市关系建构与创新网络模拟[J]. 地理学报, 2020, 75(4):708-721.
|
| [15] |
|
| [16] |
|
| [17] |
|
| [18] |
|
| [19] |
|
| [20] |
方创琳. 中国城市群研究取得的重要进展与未来发展方向[J]. 地理学报, 2014, 69(8):1130-1144.
|
| [21] |
周锐波, 刘叶子, 杨卓文. 中国城市创新能力的时空演化及溢出效应[J]. 经济地理, 2019, 39(4):85-92.
|
| [22] |
刘汉初, 樊杰, 周侃. 中国科技创新发展格局与类型划分——基于投入规模和创新效率的分析[J]. 地理研究, 2018, 37(5):910-924.
|
| [23] |
|
| [24] |
|
| [25] |
|
| [26] |
|
| [27] |
|
| [28] |
|
| [29] |
周灿, 曾刚, 曹贤忠. 中国城市创新网络结构与创新能力研究[J]. 地理研究, 2017(7):1297-1308.
|
| [30] |
段德忠, 杜德斌, 谌颖, 等. 中国城市创新网络的时空复杂性及生长机制研究[J]. 地理科学, 2018(11):1759-1768.
|
| [31] |
孙天阳, 成丽红. 中国协同创新网络的结构特征及格局演化研究[J]. 科学学研究, 2019(8):1498-1505.
|
| [32] |
盛来运, 郑鑫, 周平, 等. 我国经济发展南北差距扩大的原因分析[J]. 管理世界, 2018(9):16-24.
|
| [33] |
董雪兵, 池若楠. 中国区域经济差异与收敛的时空演进特征[J]. 经济地理, 2020, 40(10):11-21.
|
| [34] |
|
| [35] |
吴康, 方创琳, 赵渺希. 中国城市网络的空间组织及其复杂性结构特征[J]. 地理研究, 2015(4):711-728.
|
| [36] |
赖建波, 潘竟虎. 基于腾讯迁徙数据的中国“春运”城市间人口流动空间格局[J]. 人文地理, 2019(3):108-117.
|
| [37] |
樊杰, 王亚飞, 梁博. 中国区域发展格局演变过程与调控[J]. 地理学报, 2019(12):2437-2454.
|
/
| 〈 |
|
〉 |
