
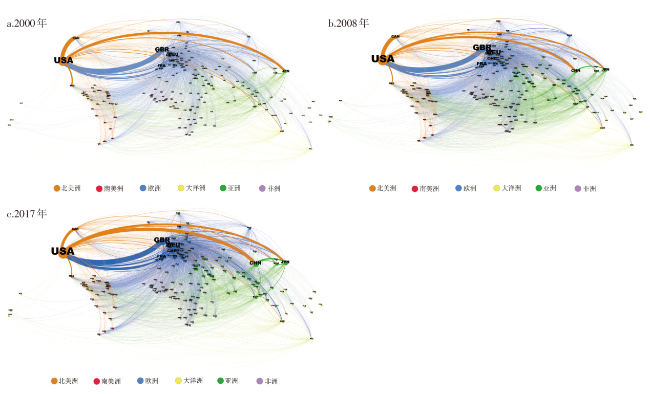
2000年以来全球文化贸易网络演化
|
韩增林(1956—),男,山东商河人,博士,教授,研究方向为区域发展规划、交通运输地理及海洋经济地理。E-mail:hzl@lnnu.edu.cn |
收稿日期: 2020-03-31
修回日期: 2021-02-27
网络出版日期: 2025-04-17
基金资助
国家自然科学基金青年项目(41976206)
教育部人文社会科学重点研究基地重大课题(18JJD790005)
辽宁省社会科学基金青年项目(L17CJL001)
Evolution of Global Cultural Trade Network After 2000
Received date: 2020-03-31
Revised date: 2021-02-27
Online published: 2025-04-17
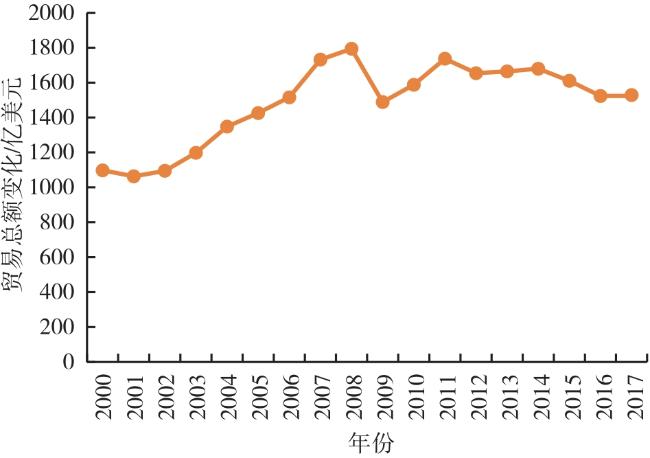
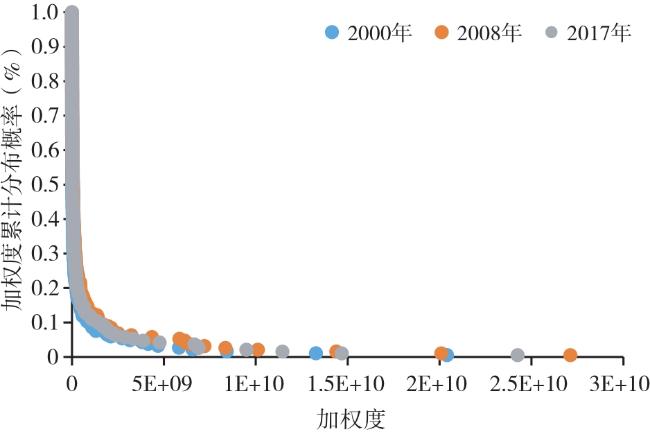
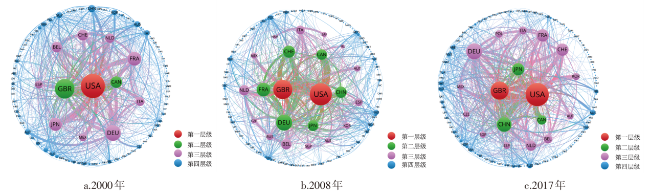
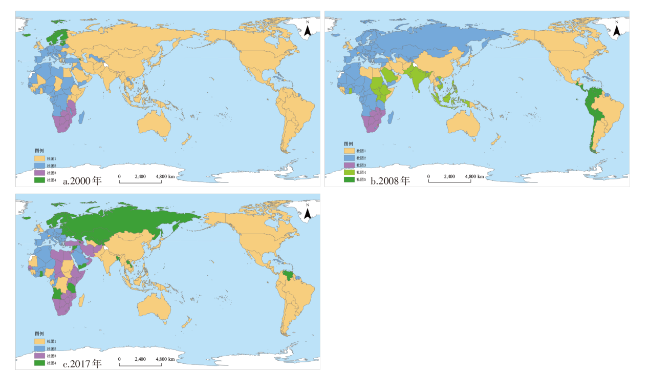
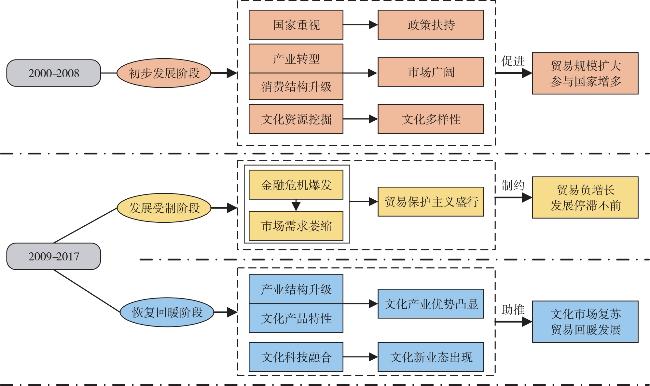
随着经济全球化的深入发展,文化贸易已成为国际贸易的重要组成部分,对世界贸易格局产生重要影响。基于全球文化贸易数据,借助网络分析软件,运用复杂网络分析方法,探讨2000—2017年重要时间节点的全球文化贸易网络时空演化。研究发现:①2000年以来,受2008年金融危机影响,全球文化贸易规模呈现波动增长趋势,总体发展态势良好。美国、英国和德国文化贸易总额始终位居前三,中国文化贸易总额增长明显,国家间文化贸易额位居前列的主要是欧美国家。②全球文化贸易网络密度整体较高,呈现稠密化趋势,国家间文化贸易往来密切,网络发育具有明显的小世界性和无标度特征,两极分化显著。③全球文化贸易网络三个中心性统计特征量存在显著的空间分异性,重要节点国家稳中有变,网络中处于核心地位的国家和中介能力强的国家存在差异。④全球文化贸易网络核心—边缘结构明显,核心国家主要是以美国、英国等为主的欧美国家和以中国、日本为主的东亚国家,边缘国家数量在逐渐减少,整个文化贸易网络联系更加紧密。⑤全球文化贸易网络社团划分明显,社团间存在整合分裂的演化特征,空间上连续性与分割性并存。
韩增林 , 李欣 , 彭飞 , 杨鑫 , 袁莹莹 . 2000年以来全球文化贸易网络演化[J]. 经济地理, 2021 , 41(5) : 103 -112 . DOI: 10.15957/j.cnki.jjdl.2021.05.012
With the in-depth development of economic globalization,cultural trade has become an important part of international trade and has an important impact on the world trade pattern. Based on the data of global cultural trade,this paper analyzes the spatio-temporal evolution of global cultural trade network at important time nodes from 2000 to 2017 by the means of network analysis software and complex network analysis method. The research finds that: 1) Affected by the financial crisis in 2008,the scale of global cultural trade showed a trend of fluctuating growth after 2000,but the overall development trend was good. Top-three countries of the cultural trade volume were the United States,the United Kingdom and Germany respectively,and the cultural trade volume of China had increased significantly. 2) Overall,the global cultural trade network density was higher and presented the dense trend. the cultural trade relationship between countries was close. The network development showed the characteristics of obvious small cosmopolitan,scale-free and significant polarization. 3) The three central statistical characteristics of the global cultural trade network had significant spatial differentiation. The important node countries were changing steadily,and there were differences between the countries at the core of the network and the countries with strong intermediary capacity. 4) The core-edge structure of the global cultural trade network was obvious,the core countries were mainly European and American countries(such as the United States and the United Kingdom),and East Asian countries (such as China and Japan), the number of peripheral countries was gradually reduced,the whole cultural trade network was more closely linked. 5) The global cultural trade network communities were clearly divided,and there was an evolutionary feature of integration and division among the communities,and the spatial continuity and segmentation coexist.
表1 2000—2017年全球文化贸易总额排名前10的国家Tab.1 Top 10 countries with global cultural trade volume in 2000-2017 |
| 排名 | 2000 | 2008 | 2017 |
|---|---|---|---|
| 1 | 美国 | 美国 | 美国 |
| 2 | 英国 | 英国 | 英国 |
| 3 | 德国 | 德国 | 德国 |
| 4 | 法国 | 法国 | 中国 |
| 5 | 日本 | 瑞士 | 瑞士 |
| 6 | 加拿大 | 中国 | 法国 |
| 7 | 瑞士 | 日本 | 日本 |
| 8 | 比利时 | 加拿大 | 荷兰 |
| 9 | 荷兰 | 比利时 | 加拿大 |
| 10 | 意大利 | 荷兰 | 比利时 |
表2 2000—2017年全球文化贸易网络统计特征量Tab.2 Statistical characteristics of global cultural trade network in 2000-2017 |
| 年份 | 孤立节点 | 边 | 平均度 | 网络密度 | 平均加权度 |
|---|---|---|---|---|---|
| 2000 | 9 | 4 708 | 48.287 | 0.249 | 505 418 237.43 |
| 2008 | 4 | 6 939 | 71.169 | 0.367 | 826 309 585.31 |
| 2017 | 3 | 6 049 | 62.041 | 0.32 | 668 991 111.33 |
表3 2000—2017年全球文化贸易网络小世界性统计指标Tab.3 Statistical indicators of global cultural trade network in 2000-2017 |
| 统计特征 | 2000 | 2008 | 2017 |
|---|---|---|---|
| 平均聚类系数 | 0.798 | 0.791 | 0.812 |
| 平均路径长度 | 1.743 | 1.618 | 1.677 |
表4 2000—2017年全球文化贸易网络中心性指标排名前10的国家Tab.4 Top 10 countries in centrality index of the global cultural trade network in 2000-2017 |
| 年份 | 国家 | 度中 心性 | 国家 | 接近 中心性 | 国家 | 中介 中心性 |
|---|---|---|---|---|---|---|
| 2000 | 美国 | 2.031 | 美国 | 0.934 | 美国 | 0.080 |
| 英国 | 1.324 | 英国 | 0.930 | 英国 | 0.054 | |
| 德国 | 0.844 | 法国 | 0.911 | 法国 | 0.044 | |
| 法国 | 0.653 | 比利时 | 0.869 | 加拿大 | 0.037 | |
| 日本 | 0.579 | 荷兰 | 0.869 | 荷兰 | 0.033 | |
| 加拿大 | 0.466 | 加拿大 | 0.860 | 比利时 | 0.033 | |
| 瑞士 | 0.413 | 德国 | 0.833 | 澳大利亚 | 0.032 | |
| 比利时 | 0.380 | 澳大利亚 | 0.808 | 德国 | 0.028 | |
| 荷兰 | 0.314 | 瑞士 | 0.794 | 意大利 | 0.021 | |
| 意大利 | 0.272 | 意大利 | 0.791 | 日本 | 0.019 | |
| 2008 | 美国 | 2.114 | 美国 | 0.960 | 美国 | 0.029 |
| 英国 | 1.568 | 英国 | 0.960 | 英国 | 0.028 | |
| 德国 | 1.125 | 德国 | 0.941 | 瑞士 | 0.025 | |
| 法国 | 0.788 | 瑞士 | 0.941 | 中国 | 0.025 | |
| 瑞士 | 0.650 | 中国 | 0.941 | 法国 | 0.024 | |
| 中国 | 0.563 | 法国 | 0.936 | 西班牙 | 0.023 | |
| 日本 | 0.503 | 比利时 | 0.927 | 德国 | 0.022 | |
| 加拿大 | 0.481 | 西班牙 | 0.922 | 比利时 | 0.022 | |
| 比利时 | 0.479 | 加拿大 | 0.918 | 加拿大 | 0.021 | |
| 荷兰 | 0.456 | 荷兰 | 0.900 | 荷兰 | 0.019 | |
| 2017 | 美国 | 2.342 | 法国 | 0.960 | 美国 | 0.044 |
| 英国 | 1.418 | 英国 | 0.950 | 法国 | 0.043 | |
| 德国 | 1.106 | 美国 | 0.936 | 英国 | 0.039 | |
| 中国 | 0.920 | 荷兰 | 0.936 | 中国 | 0.036 | |
| 瑞士 | 0.666 | 加拿大 | 0.927 | 荷兰 | 0.035 | |
| 法国 | 0.659 | 比利时 | 0.910 | 加拿大 | 0.033 | |
| 日本 | 0.643 | 中国 | 0.905 | 韩国 | 0.029 | |
| 荷兰 | 0.460 | 韩国 | 0.893 | 比利时 | 0.029 | |
| 加拿大 | 0.374 | 瑞士 | 0.868 | 瑞士 | 0.021 | |
| 比利时 | 0.325 | 奥地利 | 0.853 | 西班牙 | 0.021 |
| [1] |
叶南客. 当代文化经济一体化的生成动因与实现途径[J]. 江海学刊, 2004(4):81-87,223.
|
| [2] |
杨京英, 王金萍. 中国与世界主要国家文化产品进出口统计比较研究[J]. 统计研究, 2007(1):27-31.
|
| [3] |
周升起, 兰珍先. 中国文化贸易研究进展述评[J]. 国际贸易问题, 2013(1):117-130.
|
| [4] |
李小牧. 中国国际文化贸易发展报告[M]. 北京: 社会科学文献出版社, 2018.
|
| [5] |
|
| [6] |
|
| [7] |
|
| [8] |
|
| [9] |
|
| [10] |
|
| [11] |
|
| [12] |
|
| [13] |
周成名. 关于中国对外文化贸易的思考[J]. 湖南涉外经济学院学报, 2006(7):23-28.
|
| [14] |
卢倩. 国际文化贸易的发展及中美文化贸易的对比分析[D]. 厦门: 厦门大学, 2008.
|
| [15] |
霍步刚. 中国文化贸易偏离需求相似理论的实证检验[J]. 财经问题研究, 2008(7):15-18.
|
| [16] |
季羡林. 论东西文化的互补关系[N]. 北京日报,2001-09-24.
|
| [17] |
白玲, 吕东峰. 国际贸易中的文化互补理论[J]. 北京工商大学学报:社会科学版, 2001(6):48-51.
|
| [18] |
陈晓清, 詹正茂. 国际文化贸易影响因素的实证分析——以美国1996—2006年对外文化贸易双边数据样本为例[J]. 南京社会科学, 2008(4):90-94.
|
| [19] |
方英, 马芮. 中国与“一带一路”沿线国家文化贸易潜力及影响因素:基于随机前沿引力模型的实证研究[J]. 世界经济研究, 2018(1):112-121,136.
|
| [20] |
贾晓朋, 吕拉昌. 中国文化贸易的影响因素分析——以核心文化产品出口为例[J]. 地理科学, 2017, 37(8):1145-1150.
|
| [21] |
曲如晓, 韩丽丽. 文化距离对中国文化产品贸易影响的实证研究[J]. 黑龙江社会科学, 2011(4):34-39.
|
| [22] |
田晖. 国家文化距离对中国进出口贸易影响的区域差异[J]. 经济地理, 2015, 35(2):22-29.
|
| [23] |
韩会朝, 徐康宁. 地理、文化与贸易增长[J]. 经济学动态, 2015(9):33-40.
|
| [24] |
方慧, 尚雅楠. 基于动态钻石模型的中国文化贸易竞争力研究[J]. 世界经济研究, 2012(1):44-50,88.
|
| [25] |
顾江, 朱文静. 中日韩文化贸易的竞争性及市场分布研究[J]. 现代经济探讨, 2012(10):53-57.
|
| [26] |
李正彪, 薛勇军. 基于AHP模型的文化产业竞争力评价——以云南省为例[J]. 资源开发与市场, 2016, 32(3):293-297.
|
| [27] |
方英, 李怀亮, 孙丽岩. 中国文化贸易结构和贸易竞争力分析[J]. 商业研究, 2012(1):23-28.
|
| [28] |
|
| [29] |
|
| [30] |
|
| [31] |
滕堂伟, 翁玲玲, 韦素琼. 中国文化产业发展的区域差异[J]. 经济地理, 2014, 34(7):97-102.
|
| [32] |
张蔷. 中国城市文化创意产业现状、布局及发展对策[J]. 地理科学进展, 2013, 32(8):1227-1236.
|
| [33] |
杨头平, 潘桑桑. 中部地区文化产业竞争力评价与差异分析[J]. 经济地理, 2018, 38(12):119-125.
|
| [34] |
赵继敏, 刘卫东. 文化创意产业的地理学研究进展[J]. 地理科学进展, 2009, 28(4):503-510.
|
| [35] |
许和连, 郑川, 吴钢. 后金融危机时代的全球文化产品贸易格局:社会网络分析视角[J]. 现代财经(天津财经大学学报), 2014, 34(2):18-28.
|
| [36] |
李小牧, 李嘉珊. 国际文化贸易:关于概念的综述和辨析[J]. 国际贸易, 2007(2):41-44.
|
| [37] |
|
| [38] |
宋周莺, 车姝韵, 杨宇. “一带一路”贸易网络与全球贸易网络的拓扑关系[J]. 地理科学进展, 2017, 36(11):1340-1348.
|
| [39] |
宋周莺, 车姝韵, 张薇. 我国与“一带一路”沿线国家贸易特征研究[J]. 中国科学院院刊, 2017, 32(4):363-369.
|
/
| 〈 |
|
〉 |