
基于复杂网络的长江中游城市群人口迁徙网络空间结构
|
郑伯红(1966—),男,广东韶关人,博士,教授,博士生导师。主要研究方向为大数据与城乡规划。E-mail:2543930211@qq.com。 |
收稿日期: 2019-03-07
修回日期: 2019-08-10
网络出版日期: 2025-04-17
基金资助
国家社会科学基金项目(04CJL022)
江西省高校人文社会科学项目(YS17239)
Study on Spatial Structure of Population Migration Network of Urban Agglomeration in the Middle Yangtze River Based on Complex Network
Received date: 2019-03-07
Revised date: 2019-08-10
Online published: 2025-04-17
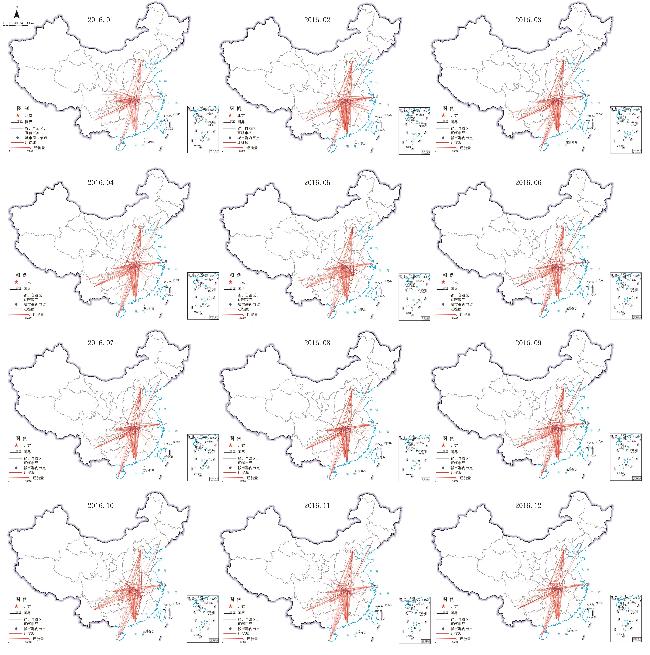
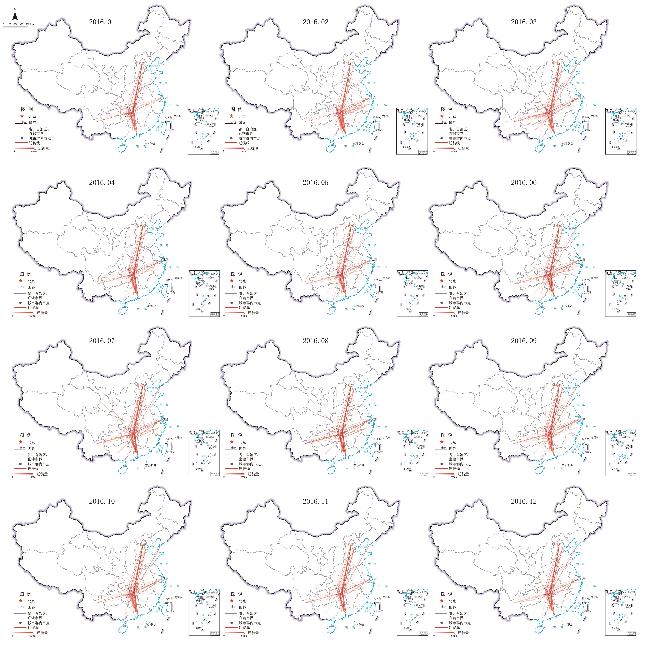
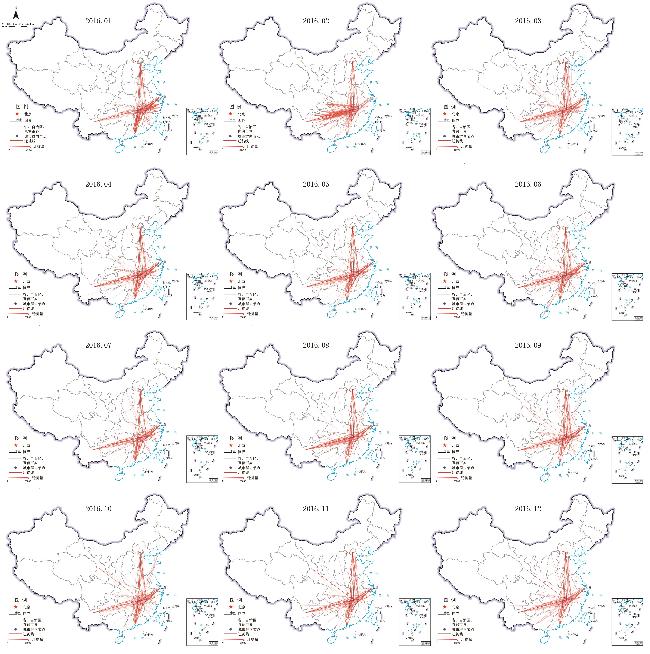
以2016年腾讯位置大数据人口迁徙数据为基础,通过节点指标、网络指标、空间结构三方面,分析长江中游城市群人口迁徙网络空间结构特征,得出主要结论:①通过节点对称性与节点重要度分析,得出城市群节点等级性明显。武汉城市圈节点等级联系特征为“强核心城市—边缘城市”,环长株潭城市群为“核心城市—次级城市—边缘城市”,环鄱阳湖城市群为“弱核心城市—边缘城市”+“非核心城市—边缘城市”。②通过平均点权与网络结构熵分析,得出城市群网络连通性存在差异。三子城市群分别表现出鲁棒性、持续性、脆弱性特征。③通过人口迁徙空间网络变迁图,分析城市群空间结构,得出各城市群空间结构呈现多样化。三子城市群空间结构分别呈现  +触角发散状”“
  +触角发散状”“
  +触角发散状”。
郑伯红 , 钟延芬 . 基于复杂网络的长江中游城市群人口迁徙网络空间结构[J]. 经济地理, 2020 , 40(5) : 118 -128 . DOI: 10.15957/j.cnki.jjdl.2020.05.013
Based on the population migration data of Tencent location big data in 2016, this paper analyses the spatial structure characteristics of population migration network in the middle reaches of the Yangtze River through three aspects of node index, network index and spatial structure, and draws the main conclusions: 1) Through the analysis of node symmetry and node importance, it is concluded that the node hierarchy of urban agglomeration is obvious. The characteristics of node hierarchy in Wuhan urban agglomeration are "strong core city-fringe city", Changsha-Zhuzhou-Xiangtan Urban Agglomeration are "core city-secondary city-fringe city" and Poyang Lake Urban Agglomeration are "weak core city-fringe city"+ "non-core city-fringe city". 2) Through the analysis of average point weight and network structure entropy, it is concluded that there are differences in network connectivity of urban agglomerations. Three sub-urban agglomerations show robustness, sustainability and vulnerability respectively. 3) By analyzing the spatial structure of urban agglomerations through the spatial network transition map of population migration, it is concluded that the spatial structure of urban agglomerations is diversified. The spatial structure of the three sub-urban agglomerations presents "  +antenna divergence", "
  +antenna divergence" and "
  +antenna divergence".
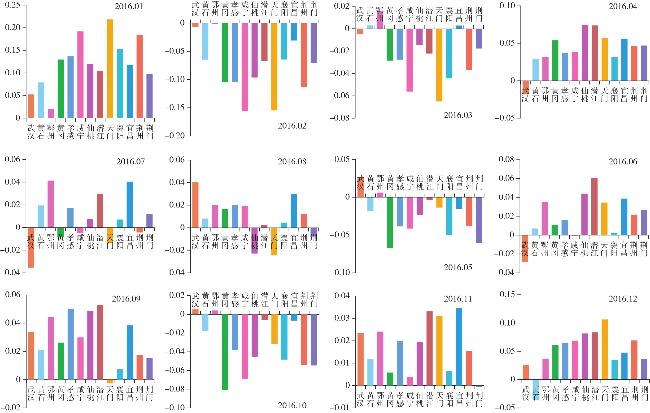
表1 武汉城市圈节点对称性(部分)(2016)Tab.1 Node symmetry of Wuhan Urban Agglomeration (Part)(2016) |
| 月份 | 指标 | 武汉 | 黄石 | 鄂州 | 黄冈 | 孝感 | 咸宁 | 仙桃 | 潜江 | 天门 | 荆门 | … |
|---|---|---|---|---|---|---|---|---|---|---|---|---|
| 01 | 0.053 | 0.079 | 0.020 | 0.129 | 0.137 | 0.192 | 0.120 | 0.105 | 0.218 | 0.098 | … | |
| 02 | -0.006 | -0.065 | -0.001 | -0.104 | -0.104 | -0.155 | -0.096 | -0.067 | -0.154 | -0.071 | … | |
| 03 | -0.005 | 0.003 | 0.016 | -0.029 | -0.028 | -0.056 | -0.015 | -0.022 | -0.065 | -0.018 | … | |
| … | … | … | … | … | … | … | … | … | … | … | … | … |
| 10 | 0.005 | -0.018 | 0.004 | -0.081 | -0.038 | -0.069 | -0.045 | -0.006 | -0.032 | -0.055 | … | |
| 11 | 0.023 | 0.012 | 0.024 | 0.006 | 0.020 | 0.004 | 0.020 | 0.033 | 0.031 | -0.001 | … | |
| 12 | 0.026 | -0.036 | 0.037 | 0.061 | 0.064 | 0.069 | 0.082 | 0.084 | 0.106 | 0.036 | … |
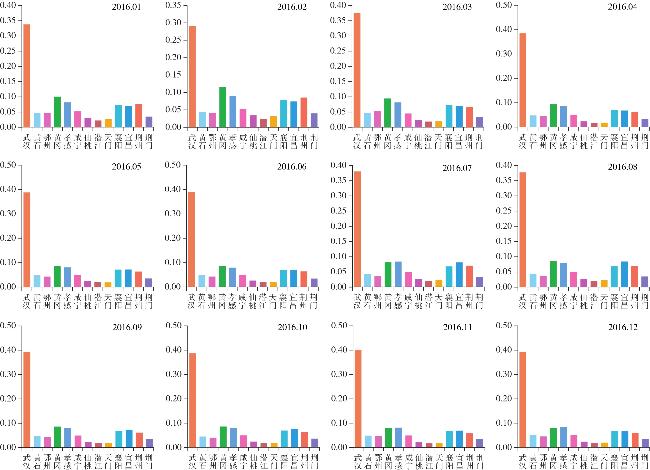
表2 武汉城市圈节点重要度(部分)(2016)Tab.2 Node importance of Wuhan Urban Agglomeration(Part)(2016) |
| 月份 | 指标 | 武汉 | 黄石 | 鄂州 | 黄冈 | 孝感 | 咸宁 | 仙桃 | 潜江 | 天门 | 荆门 | … |
|---|---|---|---|---|---|---|---|---|---|---|---|---|
| 01 | 0.338 | 0.046 | 0.048 | 0.101 | 0.082 | 0.053 | 0.031 | 0.022 | 0.027 | 0.035 | … | |
| 02 | 0.290 | 0.044 | 0.041 | 0.115 | 0.089 | 0.053 | 0.034 | 0.024 | 0.031 | 0.040 | … | |
| 03 | 0.375 | 0.047 | 0.053 | 0.095 | 0.082 | 0.045 | 0.024 | 0.019 | 0.020 | 0.034 | … | |
| … | … | … | … | … | … | … | … | … | … | … | … | … |
| 10 | 0.387 | 0.045 | 0.040 | 0.087 | 0.081 | 0.050 | 0.025 | 0.018 | 0.019 | 0.037 | … | |
| 11 | 0.400 | 0.049 | 0.046 | 0.081 | 0.082 | 0.050 | 0.023 | 0.018 | 0.018 | 0.035 | … | |
| 12 | 0.394 | 0.053 | 0.046 | 0.080 | 0.083 | 0.050 | 0.024 | 0.019 | 0.020 | 0.035 | … |
表3 环长株潭城市群节点对称性(部分)(2016)Tab.3 Node symmetry of Changsha-Zhuzhou-Xiangtan Urban Agglomeration(Part)(2016) |
| 月份 | 指标 | 长沙 | 株洲 | 湘潭 | 岳阳 | 益阳 | 常德 | 衡阳 | 娄底 |
|---|---|---|---|---|---|---|---|---|---|
| 01 | 0.021 | 0.094 | 0.049 | 0.201 | 0.130 | 0.200 | 0.193 | 0.137 | |
| 02 | -0.021 | -0.085 | -0.055 | -0.137 | -0.062 | -0.085 | -0.168 | -0.088 | |
| 03 | -0.019 | -0.048 | -0.040 | -0.067 | -0.006 | -0.016 | -0.076 | -0.067 | |
| … | … | … | … | … | … | … | … | … | … |
| 10 | 0.005 | -0.066 | 0.001 | -0.084 | -0.039 | -0.030 | -0.092 | -0.063 | |
| 11 | 0.005 | -0.022 | 0.016 | -0.012 | 0.011 | 0.021 | -0.037 | -0.013 | |
| 12 | -0.005 | 0.011 | 0.028 | 0.053 | 0.048 | 0.073 | 0.021 | 0.028 |
表4 环长株潭城市群节点重要度(部分)(2016)Tab.4 Node importance of Changsha-Zhuzhou-Xiangtan Urban Agglomeration(Part)(2016) |
| 月份 | 指标 | 长沙 | 株洲 | 湘潭 | 岳阳 | 益阳 | 常德 | 衡阳 | 娄底 |
|---|---|---|---|---|---|---|---|---|---|
| 01 | 0.354 | 0.104 | 0.091 | 0.118 | 0.064 | 0.071 | 0.129 | 0.070 | |
| 02 | 0.297 | 0.100 | 0.088 | 0.129 | 0.074 | 0.084 | 0.153 | 0.075 | |
| 03 | 0.377 | 0.105 | 0.091 | 0.112 | 0.061 | 0.064 | 0.125 | 0.065 | |
| … | … | … | … | … | … | … | … | … | … |
| 10 | 0.386 | 0.102 | 0.079 | 0.108 | 0.060 | 0.066 | 0.139 | 0.058 | |
| 11 | 0.404 | 0.105 | 0.082 | 0.104 | 0.059 | 0.060 | 0.130 | 0.056 | |
| 12 | 0.400 | 0.105 | 0.085 | 0.104 | 0.060 | 0.060 | 0.130 | 0.056 |
表5 环鄱阳湖城市群节点对称性(2016)Tab.5 Node symmetry of Poyang Lake Urban Agglomeration(2016) |
| 月份 | 指标 | 南昌 | 九江 | 景德镇 | 鹰潭 | 新余 | 宜春 | 萍乡 | 上饶 | 抚州 | 吉安 |
|---|---|---|---|---|---|---|---|---|---|---|---|
| 01 | -0.086 | 0.152 | 0.074 | -0.028 | 0.067 | 0.092 | 0.063 | 0.215 | 0.178 | 0.226 | |
| 02 | 0.058 | -0.120 | -0.043 | -0.078 | -0.047 | -0.111 | -0.108 | -0.106 | -0.129 | -0.132 | |
| 03 | -0.016 | -0.029 | 0.002 | 0.031 | -0.025 | -0.025 | -0.058 | 0.002 | -0.005 | 0.013 | |
| 04 | -0.053 | 0.036 | 0.040 | 0.008 | 0.025 | 0.041 | 0.026 | 0.055 | 0.052 | 0.095 | |
| 05 | 0.037 | -0.047 | 0.005 | -0.019 | 0.011 | -0.023 | -0.038 | -0.022 | -0.014 | 0.006 | |
| 06 | -0.062 | -0.027 | 0.035 | -0.0225 | 0.023 | 0.014 | 0.008 | 0.013 | 0.018 | 0.043 | |
| 07 | -0.066 | 0.002 | 0.032 | -0.046 | 0.013 | 0.010 | 0.018 | 0.016 | 0.022 | 0.028 | |
| 08 | 0.040 | 0.009 | 0.043 | 0.007 | 0.093 | 0.057 | 0.035 | 0.110 | 0.062 | 0.057 | |
| 09 | -0.009 | 0.024 | 0.019 | 0.005 | 0.008 | 0.022 | 0.006 | -0.044 | 0.029 | 0.085 | |
| 10 | 0.021 | -0.041 | 0.009 | -0.031 | -0.010 | -0.031 | -0.042 | -0.029 | -0.055 | -0.012 | |
| 11 | -0.028 | -0.012 | 0.058 | -0.010 | 0.003 | 0.003 | 0.019 | 0.036 | 0.030 | 0.055 | |
| 12 | -0.047 | 0.029 | 0.033 | -0.004 | 0.047 | 0.049 | 0.019 | 0.077 | 0.073 | 0.090 |
表6 环鄱阳湖城市群节点重要度(2016)Tab.6 Node importance of Poyang Lake Urban Agglomeration(2016) |
| 月份 | 指标 | 南昌 | 九江 | 景德镇 | 鹰潭 | 新余 | 宜春 | 萍乡 | 上饶 | 抚州 | 吉安 |
|---|---|---|---|---|---|---|---|---|---|---|---|
| 01 | 0.267 | 0.106 | 0.039 | 0.047 | 0.041 | 0.127 | 0.058 | 0.129 | 0.073 | 0.112 | |
| 02 | 0.224 | 0.111 | 0.038 | 0.047 | 0.039 | 0.129 | 0.056 | 0.149 | 0.081 | 0.127 | |
| 03 | 0.285 | 0.101 | 0.040 | 0.048 | 0.037 | 0.118 | 0.055 | 0.141 | 0.069 | 0.106 | |
| 04 | 0.299 | 0.101 | 0.038 | 0.044 | 0.037 | 0.114 | 0.046 | 0.132 | 0.075 | 0.114 | |
| 05 | 0.305 | 0.102 | 0.037 | 0.046 | 0.037 | 0.115 | 0.050 | 0.117 | 0.071 | 0.121 | |
| 06 | 0.314 | 0.099 | 0.035 | 0.045 | 0.036 | 0.111 | 0.047 | 0.122 | 0.074 | 0.117 | |
| 07 | 0.282 | 0.098 | 0.034 | 0.049 | 0.037 | 0.110 | 0.052 | 0.146 | 0.072 | 0.121 | |
| 08 | 0.283 | 0.101 | 0.036 | 0.049 | 0.038 | 0.114 | 0.051 | 0.137 | 0.072 | 0.119 | |
| 09 | 0.318 | 0.101 | 0.036 | 0.046 | 0.036 | 0.110 | 0.047 | 0.122 | 0.071 | 0.112 | |
| 10 | 0.317 | 0.105 | 0.038 | 0.042 | 0.037 | 0.110 | 0.047 | 0.115 | 0.072 | 0.116 | |
| 11 | 0.341 | 0.097 | 0.038 | 0.043 | 0.036 | 0.111 | 0.047 | 0.111 | 0.069 | 0.105 | |
| 12 | 0.338 | 0.098 | 0.038 | 0.045 | 0.038 | 0.114 | 0.049 | 0.112 | 0.069 | 0.099 |
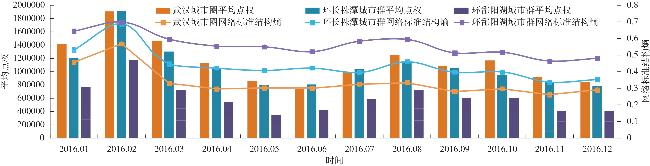
表7 长江中游城市群平均点权与网络结构熵Tab.7 Average point weight and network structure entropy of the urban agglomeration in the middle reaches of the Yangtze River |
| 时间 | 武汉城市圈 | 环长株潭城市群 | 环鄱阳湖城市群 | ||||||
|---|---|---|---|---|---|---|---|---|---|
| 平均点权 | 网络结构熵 | 平均点权 | 网络结构熵 | 平均点权 | 网络结构熵 | ||||
| 2016/01 | 1 418 556 | 0.4568240 | 1 206 074 | 0.53149973 | 765 442 | 0.644256658 | |||
| 2016/02 | 1 908 464 | 0.5680150 | 1 906 280 | 0.68812369 | 1 174 183 | 0.699517856 | |||
| 2016/03 | 1 468 376 | 0.3303610 | 1 303 110 | 0.44774281 | 719 780 | 0.596122858 | |||
| 2016/04 | 1 128 603 | 0.2965945 | 1 059 051 | 0.42111618 | 533 928 | 0.554342760 | |||
| 2016/05 | 8 627 990 | 0.3022081 | 7 928 680 | 0.40740073 | 347 053 | 0.549737106 | |||
| 2016/06 | 738 927 | 0.2998805 | 804 718 | 0.42134989 | 419 805 | 0.520445478 | |||
| 2016/07 | 989 618 | 0.3242010 | 1 028 649 | 0.39516997 | 586 224 | 0.583526813 | |||
| 2016/08 | 1 253 249 | 0.3332239 | 1 141 854 | 0.45967382 | 716 347 | 0.594351617 | |||
| 2016/09 | 1 086 921 | 0.2803902 | 1 052 365 | 0.39651605 | 596 253 | 0.513641611 | |||
| 2016/10 | 1 169 237 | 0.2968773 | 943 157 | 0.39859150 | 600 072 | 0.517182628 | |||
| 2016/11 | 919 030 | 0.2617519 | 834 190 | 0.33720831 | 402 552 | 0.464445739 | |||
| 2016/12 | 847 382 | 0.2909911 | 784 252 | 0.35280582 | 404 661 | 0.480277472 | |||
 ”空间形态;其余轴线呈现:触角发散状空间形态;整体结构形成:“
  +触角发散状”空间形态。
 ”形;其余轴线呈现:触角发散状空间形态;整体结构形成:“
  +触角发散状”空间形态。
 ”形态;其余轴线呈现:触角发散状空间形态;整体结构形成:“
  +触角发散状”空间形态。
 +触角发散状”。环长株潭城市群整体空间结构呈现:“
  +触角发散状”。环鄱阳湖城市群整体空间结构呈现:“
  +触角发散状”。
| [1] |
|
| [2] |
富田和晓. 大都市圈构造的变化[M]. 东京: 古今书院,1995.
|
| [3] |
崔功豪. 中国城镇发展研究[M]. 北京: 中国建筑工业出版社,1992.
|
| [4] |
齐康, 段进. 城市化进程与城市群空间分析[J]. 城市规划汇刊, 1997(1):1-5.
|
| [5] |
顾朝林, 蔡建明, 牛亚菲. 中国城市地理[M]. 北京: 商务印书馆,1999.
|
| [6] |
|
| [7] |
|
| [8] |
方创琳, 毛其智, 倪鹏飞. 中国城市群科学选择与分级发展的争鸣及探索[J]. 地理学报, 2015, 70(4):515-527.
|
| [9] |
沈丽珍, 汪侠, 甄峰. 社会网络分析视角下城市流动空间网络的特征[J]. 城市问题, 2017(3):28-34.
|
| [10] |
赵梓渝, 魏冶, 王士君, 等. 有向加权城市网络的转变中心性与控制力测度——以中国春运人口流动网络为例[J]. 地理研究, 2017, 36(4):647-660.
|
| [11] |
张苏文, 杨青山. 哈长城市群核心—外围结构及发展阶段判断研究[J]. 地理科学, 2018, 38(10):1699-1 706.
|
| [12] |
周国华, 陈炉, 唐承丽, 等. 长株潭城市群研究进展与展望[J]. 经济地理, 2018, 38(6):52-61.
|
| [13] |
王德利, 杨青山. 中国城市群规模结构的合理性诊断及演变特征[J]. 中国人口·资源与环境, 2018, 28(9):123-132.
|
| [14] |
王磊, 李成丽. 我国中部地区城市群多中心结构的增长效应[J]. 长江流域资源与环境, 2018, 27(10):2231-2 240.
|
| [15] |
孙玺菁, 司守奎. 复杂网络算法与应用[M]. 北京: 国防工业出版社, 2016.
|
| [16] |
|
| [17] |
|
| [18] |
郭世泽, 陆哲明. 复杂网络基础理论[M]. 北京: 科学出版社, 2016.
|
/
| 〈 |
|
〉 |