
西安市创意产业空间格局演化和影响因素
|
孙汀(1989—),女,河南台前人,博士研究生,讲师,研究方向为人文与经济地理学。E-mail:tingsun1989@hotmail.com |
收稿日期: 2020-08-27
修回日期: 2021-05-23
网络出版日期: 2025-04-13
基金资助
国家自然科学基金项目(41801171)
国家重点研发计划项目(2016YFB0502300)
河南省高等学校重点科研项目(21A170021)
Evolution and Influence Factors of Spatial-temporal Pattern of Creative Industry in Xi'an
Received date: 2020-08-27
Revised date: 2021-05-23
Online published: 2025-04-13
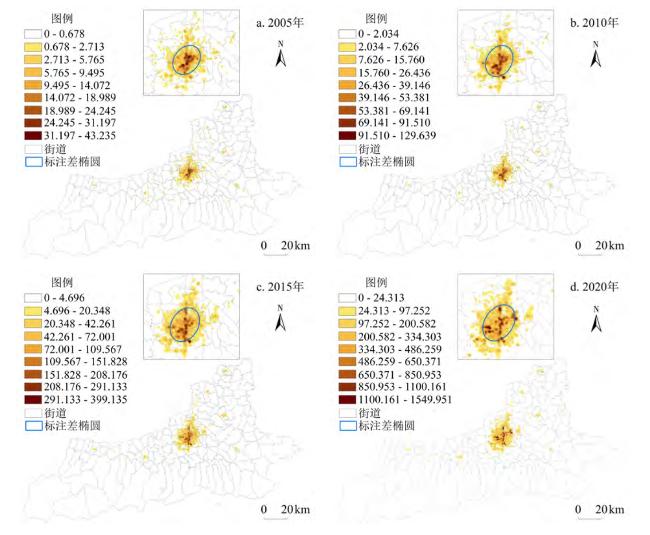
创意产业是经济发展和城市优化的有力手段,时空二维视角则是理解创意产业发展的有效逻辑。文章对创意产业的内涵、特征和行业范围进行辨析与梳理,使用大数据技术获取了西安市创意产业时空数据,选用空间分析方法从分布模式、集聚热点和发展方向性三个方面对西安市创意产业及各行业空间格局和演化过程进行探索,并基于空间可视化对影响因素进行结构性解析。研究表明:①西安市创意产业稳定集聚分布在城区;②总体上呈现既集聚又扩散的时空特征,演化过程具有多核心扩散分布的趋势,由核心集聚成团,经历沿南北中轴线发展成轴,最终形成以西南—东北方向覆盖城区的延绵片状格局;③创意产业各行业时空格局及其影响因素均具有显著差异;④产业整体的时空格局演化在多因素综合作用下产生,发展初期主要受非干预性因素影响,行政干预出现后非干预性因素影响力减弱;⑤市场因素和设施因素对各行业的影响具有普遍性和稳定性,行政因素则对部分行业作用显著;⑥动因差异的产生与各行业生产方式和产品的特征有关。
孙汀 , 李同昇 , 安传艳 , 王万同 . 西安市创意产业空间格局演化和影响因素[J]. 经济地理, 2021 , 41(8) : 125 -135 . DOI: 10.15957/j.cnki.jjdl.2021.08.015
Creative industry is a powerful approach to develop economy and optimize cities. Spatial-temporal perspective is an effective logic to understand the development of creative industry. This paper analyzes and combs the concept,characteristics and scope of creative industry,uses big data technology to obtain the data of creative industries in Xi'an,and selects 2005,2010,2015 and 2020 as nodes to establish time series. By using the methods of spatial autocorrelation,kernel density analysis and standard deviation ellipse,this paper explores the spatial pattern and evolution process of creative industry in Xi'an from three aspects: spatial distribution pattern,development direction and influencing factors. The results show that: 1) The creative industry of Xi'an steady distributes in the urban area. 2) The creative industry as a whole has a spatial-temporal pattern of both accumulation and diffusion. The evolution process has the trend of multi-core diffusion distribution. The clusters gather as a tight group,then develop along the north-south axis of the city,and form a continuous patchy pattern covering the urban area from the northeast to the southwest. 3) There are significant differences among spatial-temporal patterns of the creative industry sectors and the influence factors which form them. 4) The spatial-temporal pattern of creative industry changes under the influence of comprehensive factors. Non-interfering factors work at beginning but less impact after the interfering factors appear. 5) Market factor and infrastructure factor effect creative industry sectors generally and steady. 6) The appearance of difference of influence factors is related to the difference of the production mode and product characteristics between industries.
表1 企业数据构成(个)Tab.1 Enterprise data structure |
| 行业 | 2005 | 2010 | 2015 | 2020 |
|---|---|---|---|---|
| 全行业 | 1 823 | 5 832 | 18 604 | 96 571 |
| 广告与会展 | 710 | 2 623 | 9 281 | 30 333 |
| 建筑与工程设计 | 416 | 1 011 | 2 507 | 8 933 |
| 设计服务 | 79 | 275 | 811 | 3 117 |
| 工艺品 | 113 | 266 | 585 | 1 412 |
| 计算机与信息服务 | 176 | 767 | 2957 | 43 160 |
| 出版与传媒 | 314 | 832 | 2243 | 8 293 |
| 表演与艺术活动 | 15 | 58 | 220 | 1 323 |
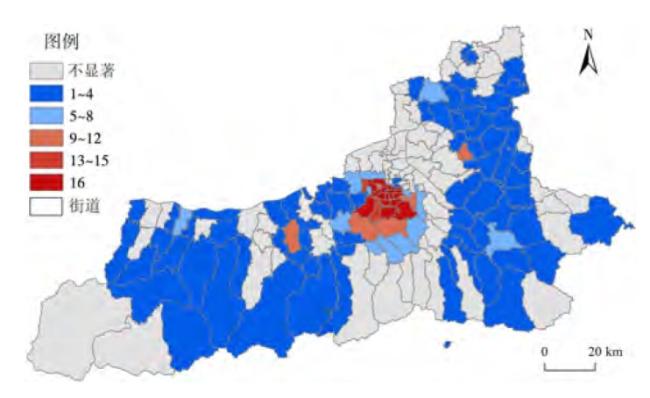
表2 西安市创意产业莫兰指数Tab.2 The Moran's I of creative industry in Xi'an |
| 行业 | 2005 | 2010 | 2015 | 2020 | |||||||
|---|---|---|---|---|---|---|---|---|---|---|---|
| 全市 | 城区 | 全市 | 城区 | 全市 | 城区 | 全市 | 城区 | ||||
| 全行业 | 0.765134 | 0.326137 | 0.574743 | 0.248439 | 0.532956 | 0.217989 | 0.503889 | 0.124174 | |||
| 广告与会展 | 0.869086 | 0.402909 | 0.625629 | 0.271318 | 0.614305 | 0.236463 | 0.588390 | 0.167863 | |||
| 建筑与工程设计 | 0.622879 | 0.232706 | 0.580823 | 0.198735 | 0.507786 | 0.168999 | 0.408140 | 0.138541 | |||
| 设计服务 | 0.614217 | 0.149501 | 0.585764 | 0.215621 | 0.575748 | 0.217327 | 0.648815 | 0.187225 | |||
| 工艺品 | 0.367161 | 0.043282 | 0.328639 | 0.163601 | 0.319267 | 0.157236 | 0.371901 | 0.165404 | |||
| 计算机与信息服务 | 0.268449 | 0.154669 | 0.285068 | 0.162350 | 0.275048 | 0.166855 | 0.389574 | 0.371334 | |||
| 出版与传媒 | 0.413632 | 0.215511 | 0.354511 | 0.187394 | 0.390329 | 0.199066 | 0.453507 | 0.160785 | |||
| 表演与艺术活动 | 0.529988 | 0.198238 | 0.640176 | 0.317128 | 0.531454 | 0.233770 | 0.511353 | 0.212606 | |||
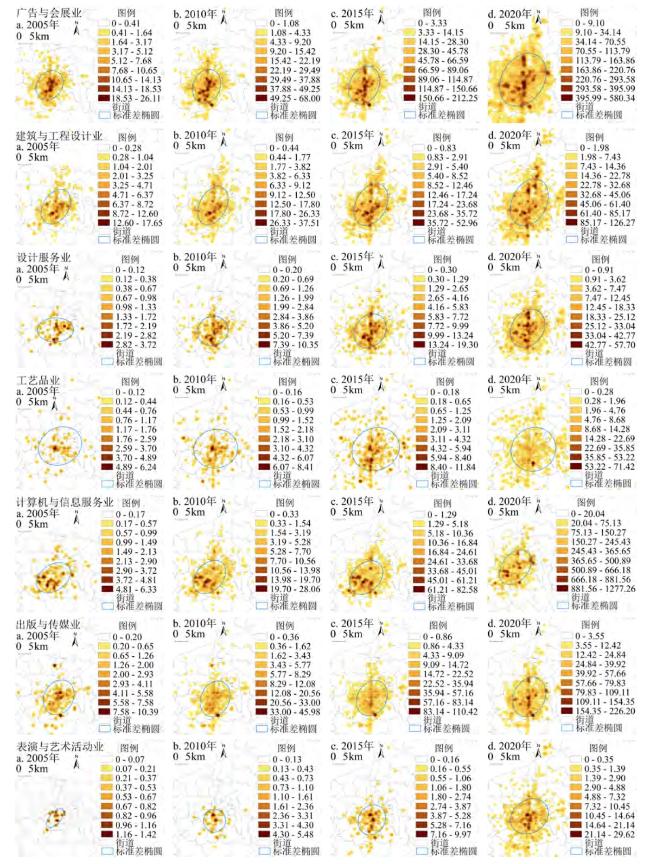
图3 2005、2010、2015和2020年西安市城区创意产业各行业核密度分布与标准差椭圆Fig.3 Kernel density & SDE of categories of creative industry in Xi’an urban area in 2005,2010,2015 and 2020 |
表3 西安市城区创意产业标准差椭圆分析结果Tab.3 Results of standard deviational ellipse analysis of creative industry in Xi'an urban area |
| 行业 | 2005 | 2010 | |||||||
|---|---|---|---|---|---|---|---|---|---|
| X轴标准差(m) | Y轴标准差(m) | 旋转角(°) | 扁率 | X轴标准差(m) | Y轴标准差(m) | 旋转角(°) | 扁率 | ||
| 全行业 | 5 415.53 | 7 032.56 | 39.57 | 0.2299 | 5 596.53 | 7 304.64 | 29.26 | 0.2338 | |
| 广告与会展 | 4 791.24 | 6 004.90 | 34.36 | 0.2021 | 5 200.61 | 6 656.72 | 22.35 | 0.2187 | |
| 建筑与工程设计 | 5 179.56 | 7 675.04 | 31.65 | 0.3251 | 5 396.83 | 8 344.90 | 27.44 | 0.3533 | |
| 设计服务 | 4 966.19 | 7 368.98 | 89.15 | 0.3261 | 5 911.31 | 6 313.69 | 56.61 | 0.0637 | |
| 工艺品 | 7 472.23 | 9 074.14 | 63.43 | 0.1765 | 7 830.01 | 9 000.65 | 80.25 | 0.1301 | |
| 计算机与信息服务 | 5 237.57 | 7 665.34 | 54.24 | 0.3167 | 5 424.70 | 7 706.90 | 41.60 | 0.2961 | |
| 出版与传媒 | 5 909.66 | 7 430.30 | 29.23 | 0.2047 | 5 788.51 | 7 566.08 | 23.77 | 0.2349 | |
| 表演与艺术活动 | 2 208.79 | 4 715.30 | 40.53 | 0.5316 | 4 498.32 | 4 725.02 | 0.80 | 0.0480 | |
| 行业 | 2015 | 2020 | |||||||
| X轴标准差(m) | Y轴标准差(m) | 旋转角(°) | 扁率 | X轴标准差(m) | Y轴标准差(m) | 旋转角(°) | 扁率 | ||
| 全行业 | 5 914.31 | 7 936.54 | 30.91 | 0.2548 | 6 236.10 | 8 709.23 | 35.17 | 0.2840 | |
| 广告与会展 | 5 569.91 | 7 594.35 | 23.77 | 0.2666 | 6 217.57 | 8 418.49 | 32.53 | 0.2614 | |
| 建筑与工程设计 | 6 199.01 | 9 045.70 | 28.78 | 0.3147 | 7 073.29 | 10 073.69 | 26.01 | 0.2978 | |
| 设计服务 | 6 033.46 | 7 394.28 | 36.87 | 0.1840 | 6 423.99 | 8 269.61 | 32.76 | 0.2232 | |
| 工艺品 | 8 502.33 | 9 876.85 | 66.91 | 0.1392 | 8 726.55 | 9 329.44 | 58.17 | 0.0646 | |
| 计算机与信息服务 | 5 678.76 | 7 848.49 | 43.95 | 0.2764 | 5 833.25 | 8 720.10 | 38.91 | 0.3311 | |
| 出版与传媒 | 5 916.23 | 7 543.85 | 29.01 | 0.2158 | 6 399.08 | 8 348.21 | 25.55 | 0.2335 | |
| 表演与艺术活动 | 5 337.83 | 6 360.05 | 29.18 | 0.1607 | 6 615.03 | 8 180.75 | 55.34 | 0.1914 | |
表4 创意产业空间格局影响因素指标Tab.4 Index of influence factors of creative industry spatial pattern |
| 影响因素 | 指标 | 符号 | 数据来源 |
|---|---|---|---|
| 市场因素 | 人口密度 | M1 | 中国乡、镇、街道人口资料(2000年)及中国2010年人口普查分乡、镇、街道资料 |
| 3A级以上景区密度 | M2 | 西安市文化和旅游局 | |
| 文化因素 | 省级以上文保单位密度 | H1 | 陕西省文物局 |
| 智力因素 | 高等院校密度 | T1 | 百度地图POI数据 |
| 行政因素 | 相关政策文件条数 | G1 | 西安市各级政府 |
| 文化体育与传媒、教育和科技支出 | G2 | 2006、2011、2016、2019年《西安统计年鉴》 | |
| 设施因素 | 地铁站点密度 | F1 | 西安市轨道交通集团有限公司 |
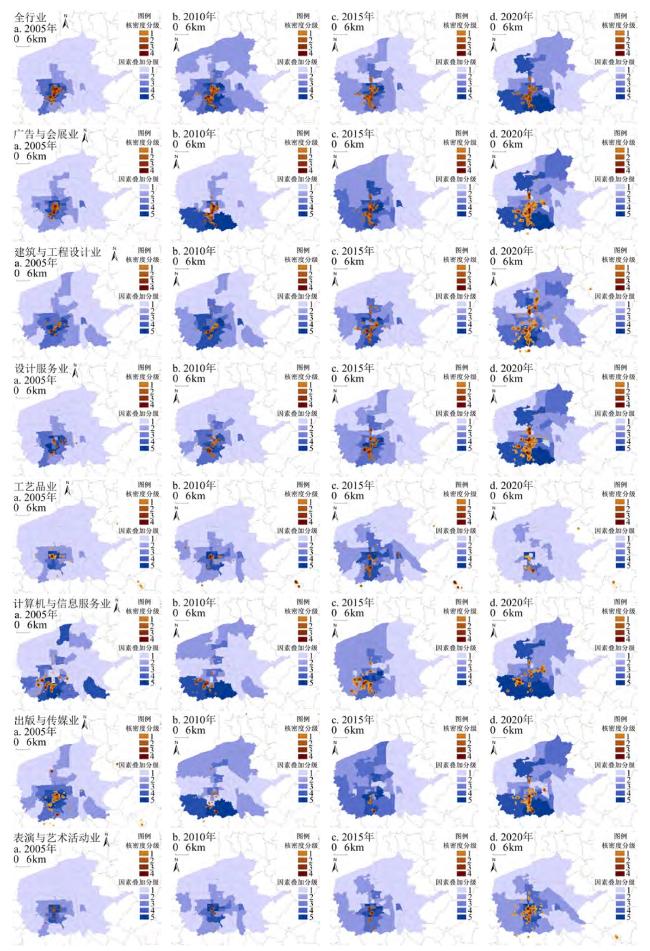
图4 2005、2010、2015和2020年西安市城区创意产业空间格局影响因素空间分异Fig.4 Spatial variation of influence factors of creative industry in Xi’an urban area in 2005,2010,2015 and 2020 |
表5 西安市城区创意产业空间格局影响因素统计结果Tab.5 Results of influence factors of creative industry spatial pattern in Xi'an urban area |
| 行业 | 2005 | 2010 | 2015 | 2020 |
|---|---|---|---|---|
| 全行业 | M1,M2,T1,H1 | M1,M2,G2,T1 | M1,M2,G1,F1 | M1,M2,H1,G1,G2,F1 |
| 广告与会展 | M1,M2 | M1,M2,G1,G2 | M1,G1,F1 | M1,G1,G2,F1 |
| 建筑与工程设计 | M1,T1 | M1,T1 | M1,T1,F1 | M1,T1,G1,F1 |
| 设计服务 | M1,M2,T1 | M1,M2,G2 | M1,T1,G1,F1 | M1,G1,G2,F1 |
| 工艺品 | M1,M2,H1 | M1,M2,H1 | M1,M2,H1,F1 | M2 |
| 计算机与信息服务 | T1 | T1,G1,G2 | T1,G1,F1 | M1,G1,F1 |
| 出版与传媒 | M1,T1,H1 | G1,G2 | T1,G1,F1 | T1,G1,G2,F1 |
| 表演与艺术活动 | M1,M2,H1 | M1,M2,H1 | M1,M2,G1,H1,F1 | M1,M2,H1,F1 |
| [1] |
|
| [2] |
|
| [3] |
吴丹丹, 马仁锋, 张悦, 等. 杭州文化创意产业集聚特征与时空格局演变[J]. 经济地理, 2018, 38(10):127-135.
|
| [4] |
薛东前, 黄晶, 马蓓蓓, 等. 西安市文化娱乐业的空间格局及热点区模式研究[J]. 地理学报, 2014, 69(4):541-552.
|
| [5] |
叶忠, 褚劲风, 顾怡. 上海游戏产业空间集聚及演化研究[J]. 世界地理研究, 2019, 28(3):155-162.
|
| [6] |
何金廖, 曾刚. 城市舒适性驱动下的创意产业集聚动力机制——以南京品牌设计产业为例[J]. 经济地理, 2019, 39(3):134-142,161.
|
| [7] |
肖雁飞. 创意产业发展的经济空间动力机制和创新模式研究[D]. 上海: 华东师范大学, 2007.
|
| [8] |
马仁锋, 王腾飞, 张文忠. 文化创意产业区位模型与浙江实证[J]. 地理研究, 2018, 37(2):379-390.
|
| [9] |
薛东前, 万斯斯, 马蓓蓓, 等. 基于城市功能格局的西安市文化产业空间集聚研究[J]. 地理科学, 2019, 39(5):750-760.
|
| [10] |
马仁锋. 创意产业区演化与大都市空间重构机理研究[D]. 上海: 华东师范大学, 2011.
|
| [11] |
|
| [12] |
|
| [13] |
|
| [14] |
|
| [15] |
|
| [16] |
|
| [17] |
|
| [18] |
|
| [19] |
|
| [20] |
|
| [21] |
|
| [22] |
|
| [23] |
|
| [24] |
|
| [25] |
|
| [26] |
|
| [27] |
|
| [28] |
|
| [29] |
王缉慈. 超越集群:中国产业集群的理论探索[M]. 北京: 科学出版社, 2010.
|
| [30] |
王毅, 廖卓娴. 湖南文化创意产业园区发展分析与建设路径[J]. 经济地理, 2019, 39(2):216-223.
|
| [31] |
吕可文, 袁丰, 高露, 等. 多元场和集群创新:河南省神垕钧瓷文化创意产业的案例分析[J]. 人文地理, 2019, 34(3):128-136.
|
| [32] |
张琦, 李同昇, 韩霞, 等. 城市内部建设监理企业区位选择的研究与实证[J]. 地理研究, 2013, 32(11):2121-2132.
|
| [33] |
李普峰, 李同昇. 西安市生产性服务业空间格局及其机制分析[J]. 城市发展研究, 2009, 16(3):87-91.
|
| [34] |
|
| [35] |
|
| [36] |
|
| [37] |
United Kingdom Government. Creative industries economic estimates[EB/OL]. https://www.gov.uk/government/collections/creative-industries-economic-estimates, 2017-01-26.
|
| [38] |
|
| [39] |
United Nations Conference on Trade and Development. Creative Industries and Development[R]. São Paulo:2004.
|
| [40] |
|
| [41] |
|
| [42] |
王缉慈. 创新的空间:产业集群与区域发展[M]. 北京: 科学出版社, 2019.
|
/
| 〈 |
|
〉 |