


基于地理标记照片数据挖掘的游客流动特征及其形成机制——以苏州为例
|
徐敏(1985—),女,山西大同人,博士,讲师。主要研究方向为大数据挖掘与旅游流动。E-mail:xuminnanshi1985@163.com。 |
收稿日期: 2019-03-07
修回日期: 2019-07-14
网络出版日期: 2025-04-08
基金资助
国家自然科学基金项目(41771154)
教育部人文社会科学研究青年基金项目(14YJC790003)
The Flow Characteristics of Tourists and Its Forming Mechanism Based on Geo-Tagged Photo Data Mining:Take Suzhou as an Example
Received date: 2019-03-07
Revised date: 2019-07-14
Online published: 2025-04-08
徐敏 , 曹芳东 , 朱海珠 . 基于地理标记照片数据挖掘的游客流动特征及其形成机制——以苏州为例[J]. 经济地理, 2020 , 40(4) : 223 -231 . DOI: 10.15957/j.cnki.jjdl.2020.04.025
The growth and formation of mobile networks represent the characteristics of mobility in today's society. Based on the geographic marker image data, this paper analyzes the spatial-temporal evolution process and formation mechanism of the flow network structure of inbound tourists in suzhou city by comprehensively applying various analysis techniques and methods, such as data mining technology, GIS spatial analysis technology, multiple regression and generalized moment. The results showed that: 1) Analyses the space-time evolution of the flow space, under the different flow constraints, suzhou city in great changes of the flow path between internal nodes, formed the gusu ancient city as the core node, continuously to the peripheral zone node characteristics of radioactive showed relatively stable space structure of "one core multipoint" mode. 2) Multiple regression analysis and generalized moment (GMM) estimation method are used to analyze the influencing factors and their action mechanism, and it is found that resource endowment, location transportation, market demand, economic development, government behavior, infrastructure and other factors have an impact on inbound tourists in different time and space. The above research provides a useful attempt to reveal the evolution law of the space-time scale of tourist flow and to effectively interpret the flow space.
表1 苏州市内部入境游客流动涉及的主要景区与节点Tab.1 Main scenic spots and nodes involved in the internal flow of inbound tourists in Suzhou City |
| 行政区划 | 节点名称 |
|---|---|
| 苏州 | 拙政园、留园、虎丘景区、周庄古镇、同里古镇、金鸡湖、东山景区、虞山尚湖景区、盘门景区、狮子林、网师园、西山景区、锦溪古镇、寒山寺、千灯古镇、七里山塘、平江历史街区、甪直古镇、石湖景区、震泽古镇、沙溪古镇、黎里古镇、西园、观前街、苏州博物馆、石路步行街、北寺塔、沧浪亭、定园、枫桥景区、苏州乐园、苏州中心、相门古城墙、苏州站、太湖旅游度假区、阳澄湖景区、苏州大学、穹窿山景区、光福景区、独墅湖、灵岩山景区、苏州工艺美术博物馆、沙家浜、十全街、南园、天平山景区、旺山、怡园、苏州公园、唐寅园、苏州北站 |
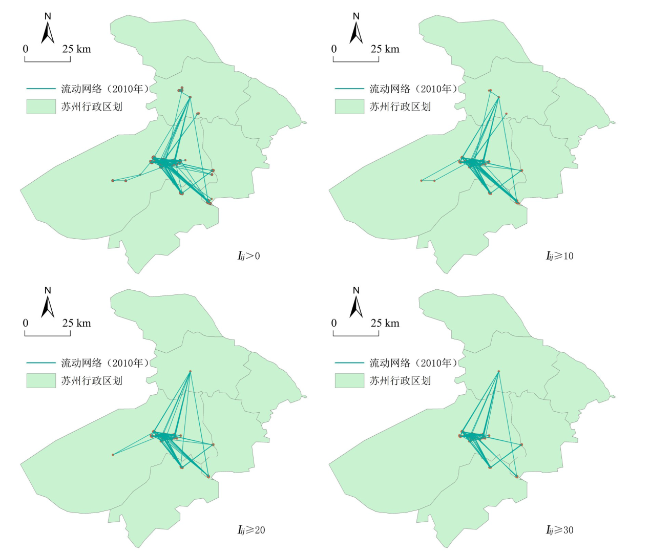
图3 流量约束下的苏州入境游客流动网络演化(2010年)Fig.3 Evolution of flow network of inbound tourists in suzhou under flow constraint(2010) |
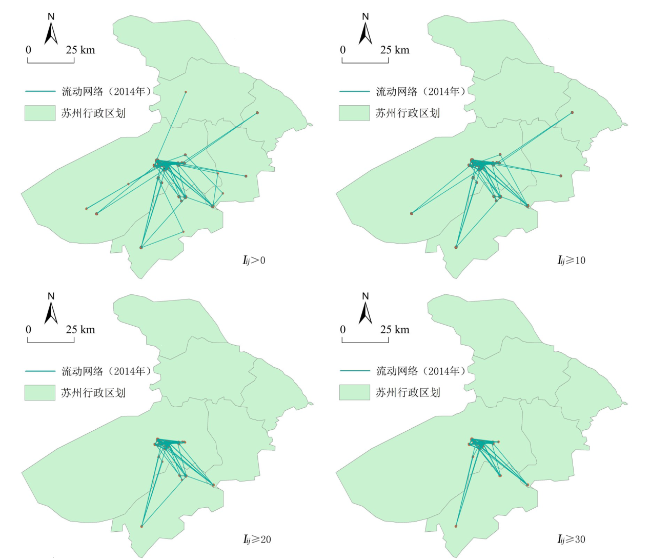
图4 流量约束下的苏州入境游客流动网络演化(2014年)Fig.4 Evolution of flow network of inbound tourists in suzhou under flow constraint(2014) |
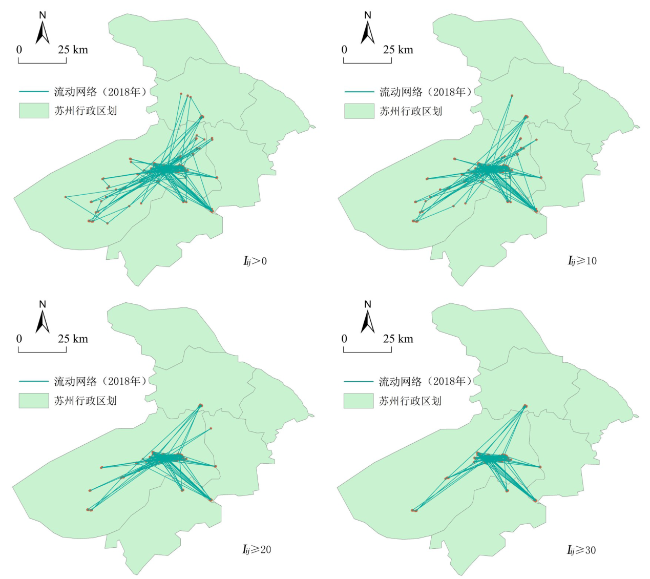
表2 苏州内部节点间游客流动网络形态特征Tab.2 Morphological characteristics of tourist flow network between internal nodes in Suzhou |
| 区域/年份 | 流量阈值 | 网络密度 | 外向度数 中心势 | 内向度数 中心势 | 中间 中心势 |
|---|---|---|---|---|---|
| 苏州/2010年 | Iij≻0 | 0.263 | 0.445 | 0.173 | 0.193 |
| Iij≥10 | 0.238 | 0.463 | 0.189 | 0.212 | |
| Iij≥20 | 0.226 | 0.387 | 0.182 | 0.189 | |
| Iij≥30 | 0.233 | 0.361 | 0.165 | 0.215 | |
| 苏州/2014年 | Iij≻0 | 0.286 | 0.453 | 0.187 | 0.227 |
| Iij≥10 | 0.243 | 0.475 | 0.193 | 0.197 | |
| Iij≥20 | 0.227 | 0.396 | 0.172 | 0.170 | |
| Iij≥30 | 0.215 | 0.367 | 0.161 | 0.158 | |
| 苏州/2018年 | Iij≻0 | 0.297 | 0.479 | 0.190 | 0.230 |
| Iij≥10 | 0.263 | 0.483 | 0.193 | 0.236 | |
| Iij≥20 | 0.235 | 0.426 | 0.177 | 0.215 | |
| Iij≥30 | 0.218 | 0.382 | 0.182 | 0.197 |
表3 多元线性回归模型拟合结果Tab.3 Fitting results of multiple linear regression model |
| 解释变量 | 被解释变量 | ||
|---|---|---|---|
| 网络中心度(Y1) | 流入度(Y2) | 流出度(Y3) | |
| 3A级占据比例(X2) | 0.563*** | 0.143*** | |
| 人均GDP(X8) | 0.487* | 0.187** | 1.320* |
| 城镇化率(X7) | -0.225* | 0.535*** | 0.228* |
| 实际使用外资(X8) | 1.125* | ||
| 高速路网密度(X3) | 0.639*** | 0.637*** | 0.532* |
| 旅游人次(X11) | 0.726** | -0.016* | 0.628** |
| 人口密度(X13) | 0.032*** | -0.133** | 0.133* |
| 可自由支配收入(X14) | 0.053* | 0.513* | |
| 三产占比(X15) | 0.027* | -0.320* | 0.273* |
| 常数项 | 0.327*** | 83.220*** | |
| 调整后R2 | 0.983 | 0.829 | 0.736 |
注:***、**、和*分别表示通过显著水平为1%、5%和10%的统计检验。 |
表4 数据的平稳性检验Tab.4 Data stationarity test |
| 变量 | IPS | LLC | 结论 | |||||
|---|---|---|---|---|---|---|---|---|
| 检验形式 (C,T,L) | IPS-W统计量 | P值 | 检验形式 (C,T,L) | LLC-T统计量 | P值 | |||
| Y1 | (1,1,0) | -13.33 | 0.000 | (1,1,1) | -18.23 | 0.000 | 平稳 | |
| Y2 | (1,1,1) | -8.75 | 0.000 | (1,1,1) | -15.76 | 0.000 | 平稳 | |
| Y3 | (1,1,1) | -9.62 | 0.000 | (1,1,1) | -13.28 | 0.000 | 平稳 | |
| lnECON | (1,1,1) | -83.66 | 0.000 | (1,1,1) | -85.27 | 0.000 | 平稳 | |
| lnMARK | (1,1,1) | -27.43 | 0.000 | (1,1,1) | -66.33 | 0.000 | 平稳 | |
| lnTRAN | (1,1,1) | -12.73 | 0.000 | (1,1,1) | -15.26 | 0.000 | 平稳 | |
| lnINFR | (1,1,1) | -13.55 | 0.000 | (1,1,1) | -13.37 | 0.000 | 平稳 | |
| lnRESO | (1,1,1) | -12.16 | 0.000 | (1,1,1) | -12.51 | 0.000 | 平稳 | |
| lnSYST | (1,1,1) | -11.27 | 0.000 | (1,1,1) | -10.13 | 0.000 | 平稳 | |
表5 解释变量与被解释变量间的GMM估计结果Tab.5 GMM estimation results between explanatory variables and explained variables |
| 被解释变量 估计方法 | 估计结果Ⅰ | 估计结果Ⅱ | 估计结果Ⅲ | 估计结果Ⅳ | 估计结果Ⅴ | 估计结果Ⅵ |
|---|---|---|---|---|---|---|
| Y1 | Y2 | Y3 | Y1 | Y2 | Y3 | |
| 随机效应 | 固定效应 | 固定效应 | GMM一步 | GMM一步 | GMM一步 | |
| lnECON | 0.073** (6.23) | 0.045** (4.17) | 0.043* (4.22) | 0.062 (5.23) | 0.032** (1.27) | 0.035 (1.34) |
| lnMARK | 0.048** (4.33) | 0.032** (3.56) | 0.037** (3.28) | 0.045 (4.27) | 0.022* (0.21) | 0.025** (0.20) |
| lnTRAN | 0.055** (4.54) | 0.025** (2.33) | 0.023** (2.56) | 0.048* (4.23) | 0.017 (2.12) | 0.020** (2.15) |
| lnINFR | 0.043** (3.22) | 0.027** (2.61) | 0.022** (2.19) | 0.040** (3.17) | 0.013 (0.28) | 0.011* (0.25) |
| lnRESO | 0.037** (3.10) | 0.020 (1.77) | 0.023** (1.82) | 0.034** (3.12) | -0.232 (-0.65) | -0.108 (-1.53) |
| lnSYST | 0.016** (2.18) | 0.010 (1.55) | 0.012* (1.28) | 0.013 (2.13) | 0.011* (2.01) | 0.009 (1.87) |
| 常数项 | 0.015** (0.223) | -0.022 (-1.23) | -0.016 (-1.56) | 0.012 (0.220) | 0.005 (0.36) | -0.132 (-0.22) |
| 拐点 | 3.27 | 4.17 | 4.28 | 3.33 | 3.18 | 3.22 |
| Observations | 180 | 180 | 180 | 180 | 180 | 180 |
| Hausman检验 | - | 75.23*** | 15.36** | 28.66 | ||
| Arellano-Bond AR(1)检验 | - | - | - | 0.002 | 0.007 | 0.000 |
| Arellano-Bond AR(11)检验 | - | - | - | 0.533 | 0.827 | 0.928 |
| Sargan检验 | - | - | - | 0.000 | 0.136 | 0.000 |
注:***、**、和*分别表示通过显著水平为1%、5%和10%的统计检验。 |
| [1] |
孙九霞, 周尚意, 王宁, 等. 跨学科聚焦的新领域:流动的时间、空间与社会[J]. 地理研究, 2016, 35(10):1801-1818.
|
| [2] |
黄潇婷, 李雯璇, 张海平, 等. 基于GPS数据的旅游时空行为评价研究[J]. 旅游学刊, 2016, 31(9):40-49.
|
| [3] |
|
| [4] |
|
| [5] |
|
| [6] |
|
| [7] |
|
| [8] |
马耀峰, 李天顺, 刘新平. 旅华游客流动模式系统研究[M]. 北京: 高等教育出版社, 2001.
|
| [9] |
卢松, 吉慧, 蔡云峰. 黄山市自驾车入游流旅行空间行为研究[J]. 地理研究, 2013, 32(1):179-190.
|
| [10] |
史春云, 张捷, 尤海梅, 等. 四川省旅游区域核心—边缘空间格局演变[J]. 地理学报, 2007, 62(6):631-639.
|
| [11] |
陈刚强, 李映辉. 中国区域旅游规模的空间结构与变化[J]. 旅游学刊, 2011, 26(11):84-88.
|
| [12] |
陶伟, 戴光全, 吴霞. “世界遗产地苏州”城市旅游空间结构研究[J]. 经济地理, 2002, 22(4):487-491.
|
| [13] |
刘军胜, 马耀峰. 基于发生学与系统论的旅游流与目的地供给耦合成长演化与驱动机制研究:以西安市为例[J]. 地理研究, 2017, 36(8):1583-1600.
|
| [14] |
薛领, 翁瑾. 我国区域旅游空间结构演化的微观机理与动态模拟研究[J]. 旅游学刊, 2010, 25(8):26-33.
|
| [15] |
|
| [16] |
|
| [17] |
杨国良, 张捷, 艾南山, 等. 旅游流齐夫结构及空间差异化特征:以四川省为例[J]. 地理学报, 2006, 61(12):1281-1289.
|
| [18] |
马丽君, 肖洋. 典型城市居民国内旅游流网络结构特征[J]. 经济地理, 2018, 38(2):197-205.
|
| [19] |
杨兴柱, 顾朝林, 王群. 南京市旅游流网络结构构建[J]. 地理学报, 2007, 62(6):609-620.
|
| [20] |
陈超, 刘家明, 马海涛, 等. 中国农民跨省旅游网络空间结构研究[J]. 地理学报, 2013, 68(4):547-558.
|
| [21] |
汪德根, 钱佳, 牛玉. 高铁网络化下中国城市旅游场强空间格局及演化[J]. 地理学报, 2016, 71(10):1784-1800.
|
| [22] |
|
| [23] |
|
| [24] |
靳诚, 徐菁, 黄震方, 等. 南京城市内部景点间游客流动特征分析[J]. 地理学报, 2014, 69(12):1858-1870.
|
| [25] |
刘法建, 张捷, 陈冬冬. 中国入境旅游流网络结构特征及动因研究[J]. 地理学报, 2010, 65(8):1013-1024.
|
| [26] |
|
| [27] |
|
| [28] |
陆林, 汤云云. 珠江三角洲都市圈国内旅游者空间行为模式研究[J]. 地理科学, 2014, 34(1):10-18.
|
| [29] |
万绪才, 王厚廷, 傅朝霞, 等. 中国城市入境旅游发展差异及其影响因素——以重点旅游城市为例[J]. 地理研究, 2013, 32(2):337-346.
|
| [30] |
徐敏, 黄震方, 曹芳东, 等. 基于在线预订数据分析的旅游流网络结构特征与影响因素——以长三角地区为例[J]. 经济地理, 2018, 38(6):193-202.
|
| [31] |
秦静, 李郎平, 唐鸣镝, 等. 基于地理标记照片的北京市入境旅游流空间特征[J]. 地理学报, 2018, 73(8):1556-1570.
|
| [32] |
陈浩, 陆林, 郑嬗婷, 等. 基于旅游流的城市群旅游地旅游空间网络结构分析:以珠江三角洲城市群为例[J]. 地理学报, 2011, 66(2):257-266.
|
| [33] |
王兆峰. 入境旅游流与航空运输网络协同演化及差异分析:以西南地区为例[J]. 地理研究, 2012, 31(7):1328-1338.
|
| [34] |
吴晋峰, 任瑞萍, 韩立宁, 等. 中国航空国际网络结构特征及其对入境旅游的影响[J]. 经济地理, 2012, 32(5):147-152.
|
/
| 〈 |
|
〉 |