
绿色发展视阈下湖南省生态足迹的驱动力因素分析
|
杨灿(1975—),女,湖南湘阴人,博士,副教授,硕士生导师。主要研究方向为生态经济、农林经济管理。E-mail:greenolivia@126.com。 |
收稿日期: 2019-07-01
修回日期: 2019-12-23
网络出版日期: 2025-04-08
基金资助
湖南省社会科学基金项目(19YBA368)
湖南省教育厅重点课题(19A515)
Driving Force Factors of Ecological Footprint in Hunan Province from the Perspective of Green Development
Received date: 2019-07-01
Revised date: 2019-12-23
Online published: 2025-04-08
杨灿 , 朱玉林 . 绿色发展视阈下湖南省生态足迹的驱动力因素分析[J]. 经济地理, 2020 , 40(4) : 195 -203 . DOI: 10.15957/j.cnki.jjdl.2020.04.022
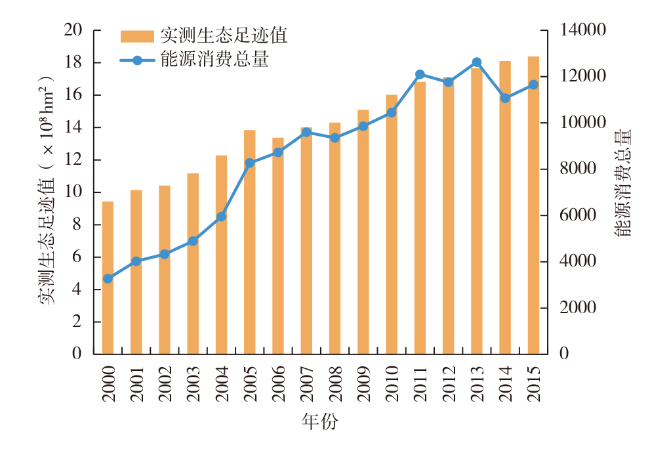
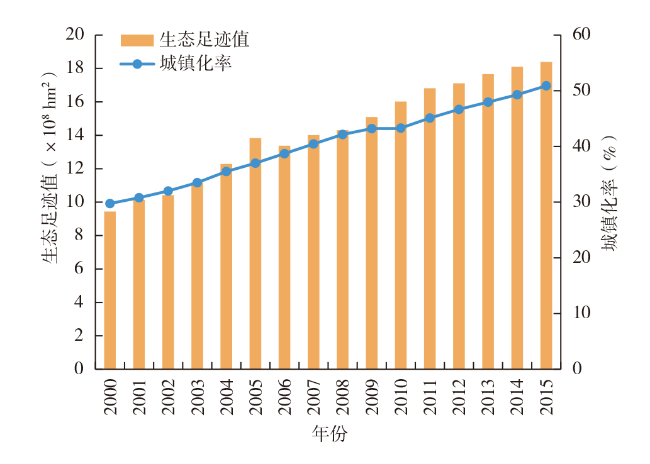
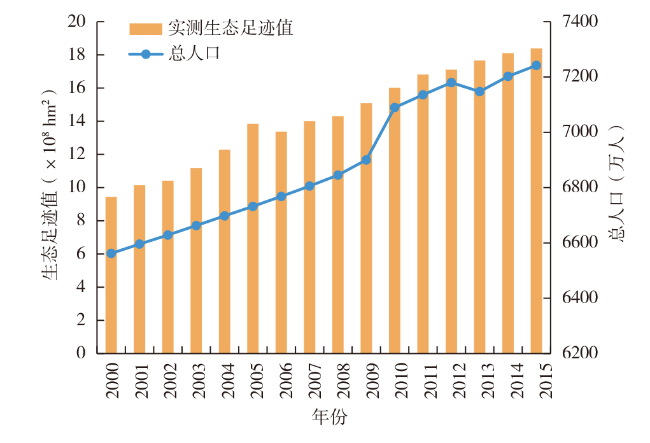
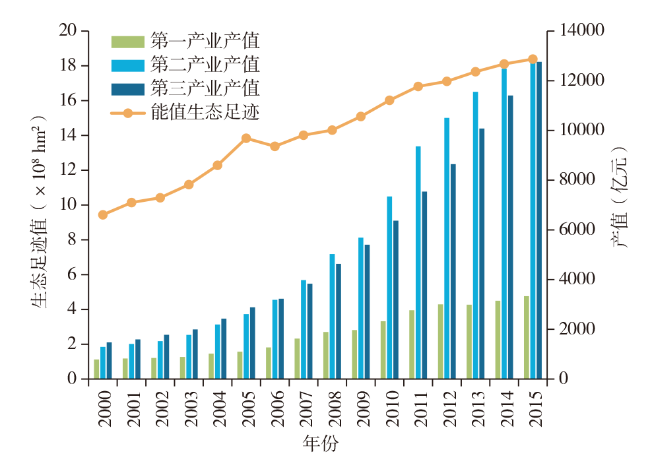
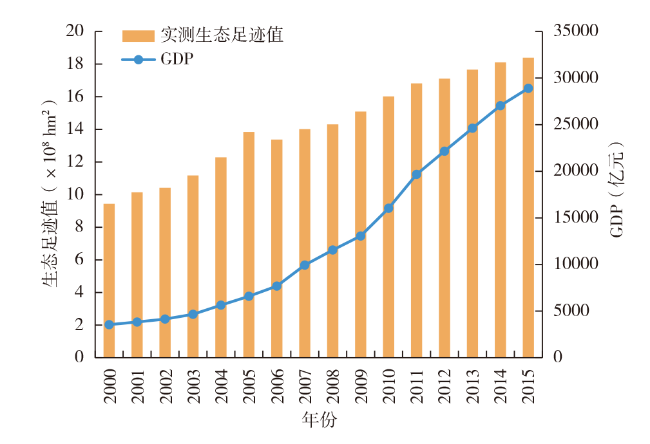
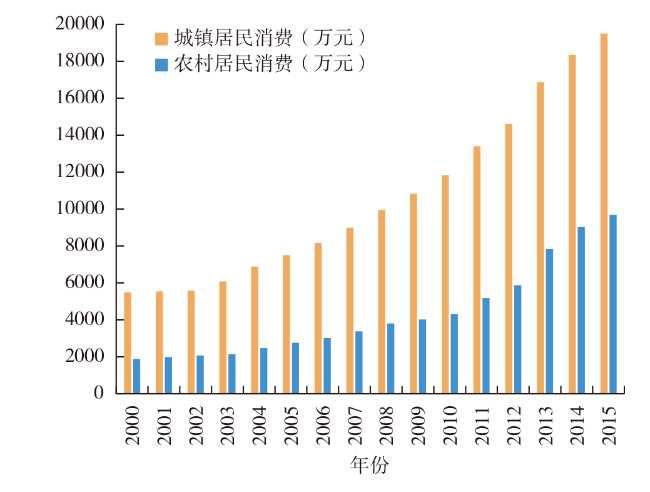
Based on the data from 2000 to 2015 in Hunan Province, and on the basis of the calculation of ecological footprint in Hunan Province, the partial least square regression model is used to establish the multiple regression model of ecological footprint, economic and social factors, so as to study the main factors that lead to the aggravation of ecological footprint. According to the model, 12 factors have different effects on the growth of ecological footprint in Hunan Province. In addition to the agricultural population, the other 11 possible influencing factors have positive independent variable coefficients, and show a trend of convergence with the change of ecological footprint. Among them, the three independent variables of total energy consumption, urbanization rate and total population have the greatest significance, and the positive driving effect on ecological footprint is the largest. A comparison between the energy ecological footprint data of Hunan Province from 2000 to 2015 and the data of the same period of each influencing factor is made to verify the rationality of the model research results again. The results show that the main driving factors of the growth of ecological footprint in Hunan Province are the huge energy consumption caused by the unreasonable industrial structure, the rapid economic development and the huge population.
表1 生态足迹变化可能的影响因子Tab.1 Possible influencing factors of ecological footprint changes |
| 可能的驱动因素 | 相应的自变量 | ||
|---|---|---|---|
| 经济 | 数量 | 国内生产总值(GDP) | X1 |
| 能源消费总量 | X2 | ||
| 全社会固定资产投资 | X3 | ||
| 进出口总额 | X4 | ||
| 结构 | 第一产业GDP | X5 | |
| 第二产业GDP | X6 | ||
| 第三产业GDP | X7 | ||
| 社会 | 人口 | 总人口数 | X8 |
| 农业人口 | X9 | ||
| 城镇化率 | X10 | ||
| 消费 | 城镇居民消费量 | X11 | |
| 农村居民消费量 | X12 |
表2 自变量之间的相关系数矩阵Tab.2 Correlation coefficient matrix between independent variables |
| r | X1 | X2 | X3 | X4 | X5 | X6 | X7 | X8 | X9 | X10 | X11 | X12 |
|---|---|---|---|---|---|---|---|---|---|---|---|---|
| X1 | 1.000 | |||||||||||
| X2 | 0.873 | 1.000 | ||||||||||
| X3 | 0.964 | 0.759 | 1.000 | |||||||||
| X4 | 0.992 | 0.850 | 0.967 | 1.000 | ||||||||
| X5 | 0.990 | 0.911 | 0.924 | 0.974 | 1.000 | |||||||
| X6 | 0.999 | 0.876 | 0.955 | 0.990 | 0.992 | 1.000 | ||||||
| X7 | 0.996 | 0.848 | 0.978 | 0.991 | 0.976 | 0.991 | 1.000 | |||||
| X8 | 0.976 | 0.923 | 0.889 | 0.956 | 0.989 | 0.980 | 0.960 | 1.000 | ||||
| X9 | -0.727 | -0.889 | -0.625 | -0.711 | -0.760 | -0.722 | -0.712 | -0.795 | 1.000 | |||
| X10 | 0.956 | 0.958 | 0.888 | 0.944 | 0.968 | 0.952 | 0.948 | 0.966 | -0.867 | 1.000 | ||
| X11 | 0.997 | 0.869 | 0.973 | 0.992 | 0.979 | 0.992 | 0.998 | 0.963 | -0.731 | 0.960 | 1.000 | |
| X12 | 0.975 | 0.792 | 0.990 | 0.982 | 0.936 | 0.966 | 0.988 | 0.911 | -0.666 | 0.914 | 0.986 | 1.000 |
表3 交叉有效性验证Tab.3 Verification of Cross-Validity |
| Y | 解释力 | 预测效果 |
|---|---|---|
| 1 | 0.9532 | 0.9493 |
| 2 | 0.9874 | 0.9814 |
| 3 | 0.9900 | 0.9814 |
表4 基于PLS模型的生态足迹影响因子排序Tab.4 Ranking of influencing factors of ecological footprints based on PLS model |
| 因子 | X2 | X10 | X8 | X5 | X9 | X1 |
|---|---|---|---|---|---|---|
| VIP值 | 1.0681 | 1.0435 | 1.0211 | 1.0067 | 0.9978 | 0.9967 |
| 因子 | X11 | X6 | X7 | X4 | X12 | X3 |
| VIP值 | 0.9966 | 0.9950 | 0.9873 | 0.9845 | 0.9565 | 0.9397 |
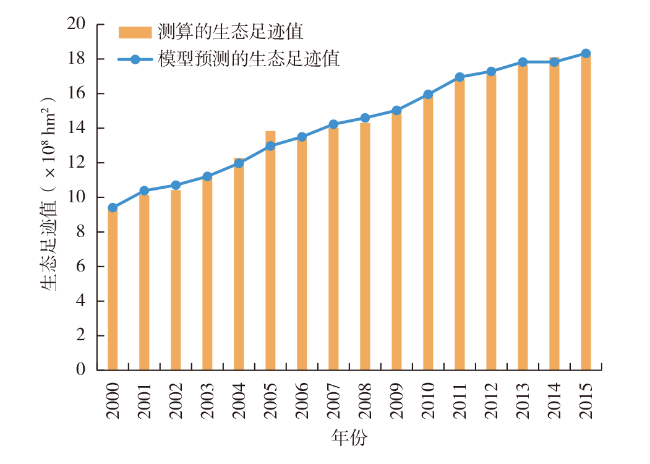
表5 模型预测数据与实际测算数据对比Tab.5 Comparison between model prediction data and actual measurement data |
| 年份 | 测算的能值生态足迹值(hm2) | 模型预测的生态足迹值(hm2) |
|---|---|---|
| 2000 | 943 858 332 | 940 642 724 |
| 2001 | 1 014 257 618 | 1 038 608 542 |
| 2002 | 1 041 818 208 | 1 070 610 552 |
| 2003 | 1 117 407 352 | 1 121 115 365 |
| 2004 | 1 228 308 591 | 1 196 845 978 |
| 2005 | 1 383 861 582 | 1 297 120 847 |
| 2006 | 1 337 333 733 | 1 350 029 063 |
| 2007 | 1 401 345 153 | 1 422 840 750 |
| 2008 | 1 430 588 023 | 1 459 388 873 |
| 2009 | 1 508 808 509 | 1 502 919 243 |
| 2010 | 1 601 977 082 | 1 595 621 997 |
| 2011 | 1 681 607 510 | 1 695 772 076 |
| 2012 | 1 710 822 457 | 1 728 342 922 |
| 2013 | 1 765 974 600 | 1 782 659 785 |
| 2014 | 1 810 491 260 | 1 782 192 415 |
| 2015 | 1 838 824 342 | 1 832 574 885 |
| [1] |
|
| [2] |
|
| [3] |
蓝盛芳, 钦佩. 生态经济系统能值分析[M]. 北京: 化学工业出版社, 2002.
|
| [4] |
徐中民. 可持续发展定量研究的几种新方法评介[J]. 中国人口·资源与环境, 2000, 10(2):60-64.
|
| [5] |
杨开忠, 杨咏, 陈洁. 生态足迹分析理论与方法[J]. 地球科学进展, 2000(6):129-138.
|
| [6] |
朱玉林, 李明杰, 顾荣华. 基于压力—状态—响应模型的长株潭城市群生态承载力安全预警研究[J]. 长江流域资源与环境, 2017, 26(12):2057-2064.
|
| [7] |
|
| [8] |
樊杰, 周侃, 王亚飞. 全国资源环境承载能力预警(2016版)的基点和技术方法进展[J]. 地理科学进展, 2017, 36(3):266-276.
|
| [9] |
|
| [10] |
杨灿, 朱玉林. 基于能值生态足迹改进模型的湖南省生态赤字研究[J]. 中国人口·资源与环境, 2016, 26(7):37-45.
|
| [11] |
龙爱华, 张志强, 苏志勇. 生态足迹评介及国际研究前沿[J]. 地球科学进展, 2004, 19(6):971-981.
|
| [12] |
李明月, 江华. 生态足迹分析模型的假设条件缺陷及应用偏差[J]. 农业现代化研究, 2005(1):6-9.
|
| [13] |
吴隆杰, 杨林, 苏昕, 等. 近年来生态足迹研究进展[J]. 中国农业大学学报, 2006, 11(3):1-8.
|
| [14] |
王惠文. 偏最小二乘回归方法及应用[M]. 北京: 国防科技出版社, 1996.
|
| [15] |
杨灿, 朱玉林, 李明杰. 洞庭湖平原区农业生态系统的能值分析与可持续发展[J]. 经济地理, 2014, 34(12):65-71.
|
| [16] |
|
| [17] |
梁树广, 吕晓, 张延辉. 人口结构与产业结构转型升级耦合演进的时空特征——基于中国时间序列与31个省份面板数据的灰色关联分析[J]. 经济体制改革, 2019(2):54-61.
|
| [18] |
国家统计局. 中国统计年鉴(2000—2015)[M]. 北京: 中国统计出版社, 2001—2016.
|
| [19] |
国家统计局能源统计司. 中国能源统计年鉴(2000—2015)[M]. 北京: 中国统计出版社, 2001—2016.
|
| [20] |
国家统计局. 湖南统计年鉴(2000—2015)[M]. 北京: 中国统计出版社, 2001—2016.
|
| [21] |
高世楫, 李佐军. 用制度创新促进绿色发展[M]. 北京: 中国发展出版社, 2017.
|
| [22] |
张台秋, 杨静, 施建军. 绿色战略动因与权变因素研究——基于转型经济情境[J]. 生态经济, 2012(6):101-106.
|
| [23] |
彭斯震, 孙新章. 中国发展绿色经济的主要挑战和战略对策研究[J]. 中国人口·资源与环境, 2014, 24(3):1-4.
|
| [24] |
刘学敏, 张生玲. 中国企业绿色转型:目标模式、面临障碍与对策[J]. 中国人口·资源与环境, 2015(6):85-90.
|
| [25] |
刘国良, 胡远志. 我省全面建成小康社会的重点难点透析[N]. 湖南日报, 2015-11-27.
|
| [26] |
黄跃, 李琳. 中国城市群绿色发展水平综合测度与时空演化[J]. 地理研究, 2017, 36(7):1309-1322.
|
| [27] |
陈文胜, 王文强, 陆福兴. 湖南乡村振兴报告[M]. 北京: 社会科学文献出版社, 2018.
|
| [28] |
金瑶梅. 绿色发展的理论维度[M]. 天津: 天津人民出版社, 2018.
|
| [29] |
周旋. 湖南绿色发展面临的契机、挑战及对策建议[J]. 决策咨询, 2019(1):42-45.
|
/
| 〈 |
|
〉 |