
黄河流域旅游经济空间分异格局及影响因素
|
薛明月(1992—),女,陕西铜川人,博士研究生。主要研究方向为城市化与区域发展。E-mail:xmy19920224@126.com。 |
收稿日期: 2019-12-13
修回日期: 2020-04-08
网络出版日期: 2025-04-08
基金资助
国家自然科学基金项目(41371170)
山东省自然科学基金项目(ZR2019MD043)
Spatial Differentiation Pattern and Influencing Factors of Tourism Economy in the Yellow River Basin
Received date: 2019-12-13
Revised date: 2020-04-08
Online published: 2025-04-08
薛明月 , 王成新 , 赵金丽 , 李梦程 . 黄河流域旅游经济空间分异格局及影响因素[J]. 经济地理, 2020 , 40(4) : 19 -27 . DOI: 10.15957/j.cnki.jjdl.2020.04.003
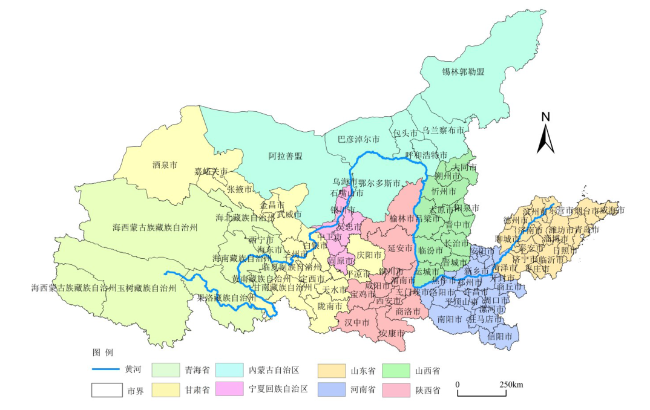
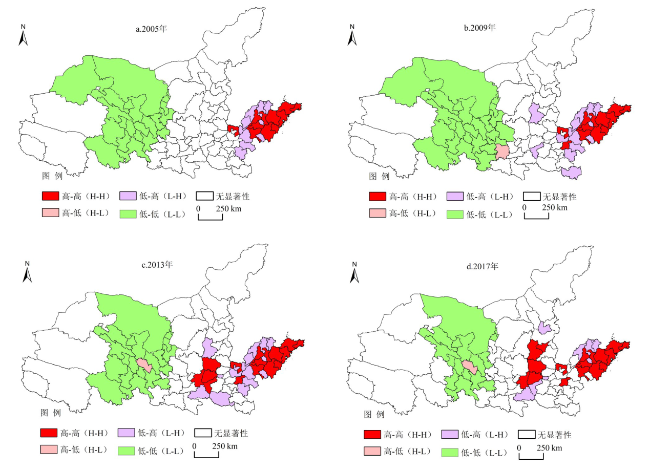
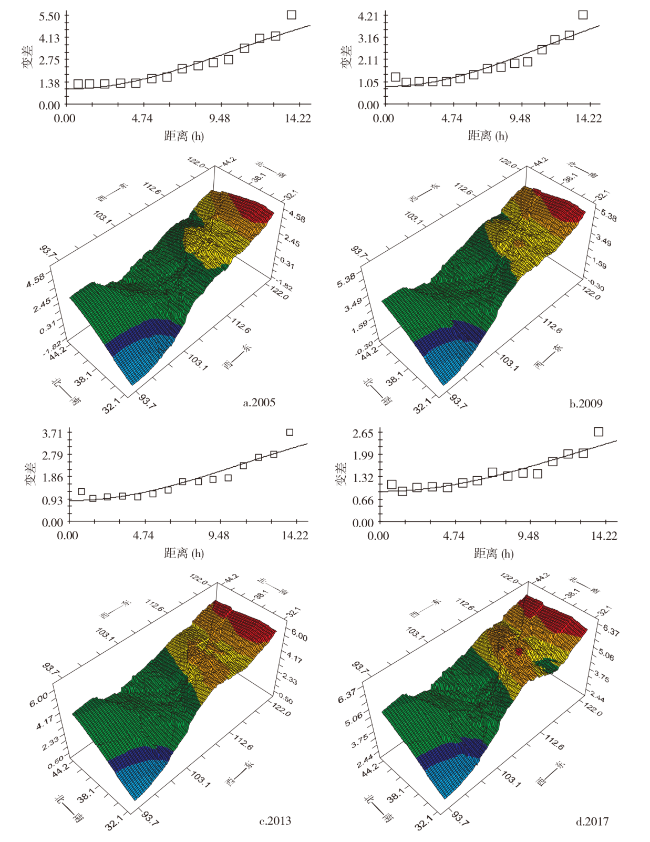
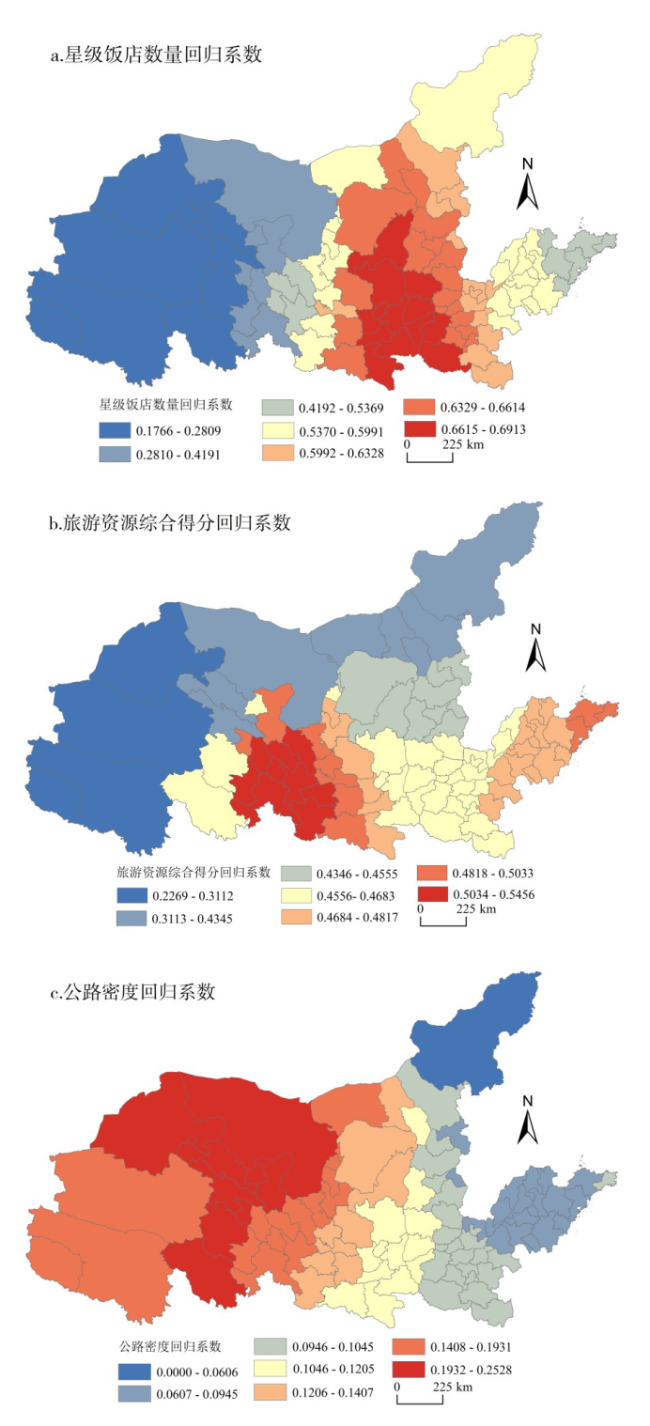
The coordinated development of tourism economy in the Yellow River basin is an important link to promote its high-quality development. With 91 cities of the Yellow River basin (state,au) as the research unit,selection of cross-section data in 2005,2009,2013,2017,by adopting the method of ESDA,spatial variation functions to explore space differentiation pattern of tourism economy in the Yellow River,and combining with the least squares (OLS) and geographically weighted regression (GWR) model for quantitative analysis of the influence factors of spatial differentiation. The results show that: 1) the tourism economy in the Yellow River basin has a strong spatial dependence,showing a spatial trend of h-h and l-l agglomeration distribution,in which the l-l agglomeration area keeps shrinking and the h-h agglomeration area gradually extends from the lower reaches of the Yellow River to the middle reaches of the Yellow River. 2) the difference of tourism economy in the Yellow River basin keeps shrinking,and the structural differentiation caused by spatial autocorrelation keeps increasing,with east-west becoming the main direction of spatial differentiation of tourism economy; 3) location and traffic conditions,tourism service facilities and tourism resource endowment are the main factors affecting the development of tourism economy in cities in the Yellow River basin; However,there is significant spatial differentiation among the influencing factors.
表1 2005、2009、2013、2017年黄河流域国内旅游收入全局Moran′s I值Tab.1 Global Moran's I value of domestic tourism income in the Yellow River basin in 2005, 2009, 2013 and 2017 |
| 时间 | Moran′s I | P值 | Z得分 |
|---|---|---|---|
| 2005 | 0.2759 | 0.003 | 4.2687 |
| 2009 | 0.3263 | 0.001 | 4.9789 |
| 2013 | 0.3031 | 0.001 | 4.8947 |
| 2017 | 0.2843 | 0.001 | 4.6260 |
表2 2005、2009、2013、2017年黄河流域旅游经济变差函数拟合参数Tab.2 The parameter of tourism economic variation function fitting in the Yellow River basin in 2005, 2009, 2013 and 2017 |
| 年份 | 变程α | 块金值C0 | 基台值C0+C | 块金系数C/(C0+C) | 拟合模型 | 拟合系数R2 |
|---|---|---|---|---|---|---|
| 2005 | 24.768 | 0.930 | 6.869 | 0.865 | Gaussian | 0.934 |
| 2009 | 27.158 | 0.830 | 5.669 | 0.854 | Gaussian | 0.907 |
| 2013 | 26.465 | 0.860 | 4.730 | 0.818 | Gaussian | 0.899 |
| 2017 | 30.241 | 0.890 | 3.790 | 0.765 | Gaussian | 0.895 |
表3 不同方向上的黄河流域旅游经济变差函数分维数Tab.3 Fractal dimension of tourism economic variation function of the Yellow River basin in different directions |
| 年份 | 全方向 | 南—北(0°) | 东北—西南(45°) | 东—西(90°) | 东南—西北(135°) | ||||||
|---|---|---|---|---|---|---|---|---|---|---|---|
| D | R2 | D | R2 | D | R2 | D | R2 | D | R2 | ||
| 国内旅 游收入 | 2005 | 1.744 | 0.713 | 1.998 | 0.000 | 1.780 | 0.569 | 1.733 | 0.795 | 1.820 | 0.516 |
| 2009 | 1.788 | 0.598 | 1.920 | 0.043 | 1.860 | 0.298 | 1.774 | 0.705 | 1.848 | 0.461 | |
| 2013 | 1.807 | 0.599 | 1.865 | 0.062 | 1.856 | 0.281 | 1.801 | 0.686 | 1.902 | 0.351 | |
| 2017 | 1.854 | 0.622 | 1.909 | 0.052 | 1.859 | 0.328 | 1.849 | 0.691 | 1.984 | 0.015 | |
表4 黄河流域旅游经济差异OLS回归结果Tab.4 OLS regression results of tourism economic differences in the Yellow River basin |
| 模型参数 | 系数 | T值 | P值 | 标准差 | VIF |
|---|---|---|---|---|---|
| 人均GDP | 0.063 | 1.190 | 0.237 | 0.052 | 1.207 |
| 公路密度 | 0.143 | 4.112 | 0.000* | 0.035 | 1.228 |
| 第三产业占比 | 0.071 | 1.388 | 0.169 | 0.051 | 1.464 |
| 星级饭店数量 | 0.523 | 6.854 | 0.000* | 0.076 | 2.498 |
| 旅游资源综合得分 | 0.512 | 6.672 | 0.000* | 0.077 | 2.272 |
| R2 | 0.849 | ||||
| Adjusted R2 | 0.840 | ||||
| Join F (P) | 0.000* | ||||
| Jarque-Bera Test | 19.844 | ||||
| AICC | -182.478 |
注:“*”表示通过0.05水平的显著性检验(P<0.05)。 |
表5 黄河流域旅游经济差异的GWR模型参数Tab.5 Parameters of GWR model for tourism economic difference in the Yellow River basin |
| 模型参数 | 数值 |
|---|---|
| Bandwidth | 6.766 |
| Residual Squares | 0.364 |
| Effective Number | 18.863 |
| Sigma | 0.071 |
| AICC | -205.537 |
| R2 | 0.909 |
| Adjusted R2 | 0.887 |
表6 GWR模型回归系数的描述性统计Tab.6 Descriptive statistics of regression coefficients of GWR model |
| 模型参数 | 最大值 | 最小值 | 平均值 | 上四分位值 | 下四分位值 | 中位值 |
|---|---|---|---|---|---|---|
| 公路密度 | 0.253 | 0.060 | 0.127 | 0.136 | 0.117 | 0.107 |
| 星级饭店数量 | 0.691 | 0.176 | 0.556 | 0.584 | 0.528 | 0.598 |
| 旅游资源综合得分 | 0.545 | 0.227 | 0.460 | 0.470 | 0.449 | 0.466 |
| [1] |
陆林, 余凤龙. 中国旅游经济差异的空间特征分析[J]. 经济地理, 2005, 25(3):406-410.
|
| [2] |
汪德根, 陈田. 中国旅游经济区域差异的空间分析[J]. 地理科学, 2011, 31(5):528-536.
|
| [3] |
胡文海, 孙建平, 余菲菲. 安徽省区域旅游经济发展的时空格局演变[J]. 地理研究, 2015, 34(9):1795-1806.
|
| [4] |
|
| [5] |
李在军, 管卫华, 蒲英霞, 等. 山东省旅游经济的时空演变格局探究[J]. 经济地理, 2013, 33(7):176-181.
|
| [6] |
吴冰, 马耀峰, 高楠. 基于Theil指数的陕西入境旅游经济区域时空差异研究[J]. 干旱区资源与环境, 2013, 27(7):186-191.
|
| [7] |
鄢慧丽, 徐帆, 熊浩, 等. 基于新经济地理“3D”框架的旅游经济空间结构特征分析——以长江三角洲地区为例[J]. 人文地理, 2020, 35(1):76-84.
|
| [8] |
薛晨浩, 任婕, 李陇堂. 西部地区入境旅游经济时空格局特征及影响因素[J]. 宁夏社会科学, 2019(6):83-89.
|
| [9] |
吴媛媛, 宋玉祥. 中国旅游经济空间格局演变特征及其影响因素分析[J]. 地理科学, 2018, 38(9):1491-1498.
|
| [10] |
朱海艳, 孙根年, 李君轶. 中国31省市国内旅游经济差异影响因素的空间计量研究[J]. 干旱区资源与环境, 2019, 33(5):197-202.
|
| [11] |
隋建利, 张亿萍. 中国区域旅游经济周期的动态路径演化识别[J]. 旅游学刊, 2020, 35(1):63-77.
|
| [12] |
关伟, 郝金连. 东北地区旅游经济影响因素时空特征研究[J]. 地理科学, 2018, 38(6):935-943.
|
| [13] |
|
| [14] |
张生瑞, 王英杰, 鞠洪润, 等. 中国陆地边境旅游发展区域差异及其影响因素[J]. 地理研究, 2020, 39(2):414-429.
|
| [15] |
|
| [16] |
吴良平, 张健. 中国入境旅游区域差异的衡量及演变分析[J]. 旅游科学, 2015, 29(6):1-14.
|
| [17] |
马丽君, 张家凤. 区域旅游发展空间差异变化对经济发展平衡性的影响[J]. 经济地理, 2020, 40(1):197-203.
|
| [18] |
马仁锋, 倪欣欣, 张文忠, 等. 浙江旅游经济时空差异的多尺度研究[J]. 经济地理, 2015, 35(7):176-182.
|
| [19] |
马斌斌, 陈兴鹏, 鲁小波, 等. 丝绸之路经济带背景下基于入境旅游时空差异视角的西北五省国际旅游目的地协同发展研究[J]. 新疆大学学报:哲学·人文社会科学版, 2019, 47(5):1-8.
|
| [20] |
冯迎, 张军民. 基于ESDA的新疆旅游经济发展空间分异规律研究[J]. 旅游科学, 2016, 30(2):68-78.
|
| [21] |
刘海军, 崔东, 孙国军, 等. 新疆旅游经济时空差异及其驱动因子[J]. 地域研究与开发, 2018, 37(6):88-92.
|
| [22] |
程金龙. 中国区域旅游经济差异演变及主导因素分析[J]. 华东经济管理, 2018, 32(12):56-62.
|
| [23] |
孙盼盼, 戴学锋. 中国区域旅游经济差异的空间统计分析[J]. 旅游科学, 2014, 28(2):35-48.
|
| [24] |
程进, 陆林. 安徽省区域旅游经济差异研究[J]. 安徽师范大学学报:自然科学版, 2010, 33(1):81-85.
|
| [25] |
张鲜鲜, 左颖, 李婧晗, 等. 长三角城市群旅游发展空间格局及影响因素[J]. 统计与决策, 2020, 36(1):100-104.
|
| [26] |
李红波, 曾文, 周叶青, 等. 中国沿海地区入境旅游经济的时空差异研究[J]. 中国人口·资源与环境, 2013, 23(S1):150-153.
|
| [27] |
孙根年, 潘潘. 陕西十地市旅游业发展的地区差异及其影响因素分析[J]. 干旱区资源与环境, 2013, 27(11):184-191.
|
| [28] |
朱怡婷, 熊黑钢, 白洋, 等. 边疆旅游地县域旅游经济时空变迁及驱动机制研究——新疆案例[J]. 干旱区地理, 2019, 42(2):392-403.
|
| [29] |
钱乐祥, 许叔明, 秦奋. 流域空间经济分析与西部发展战略[J]. 地理科学进展, 2000, 19(3):266-272.
|
| [30] |
陈利, 朱喜钢, 杨阳, 等. 基于空间计量的云南省县域经济空间格局演变[J]. 经济地理, 2017, 37(1):40-49.
|
| [31] |
靳诚, 陆玉麒. 基于县域单元的江苏省经济空间格局演化[J]. 地理学报, 2009, 64(6):713-724.
|
| [32] |
杨忍, 罗秀丽, 陈燕纯. 中国县域乡村地域多功能格局及影响因素识别[J]. 地理科学进展, 2019, 38(9):1316-1328.
|
| [33] |
王政权. 地统计学及其在生态学中的应用[M]. 北京: 科学出版社, 1999.
|
| [34] |
姜海宁. 泛长江三角洲FDI空间格局演化研究[J]. 人文地理, 2015, 30(6):126-131,145.
|
| [35] |
徐建华. 计量地理学[M]. 北京: 高等教育出版社, 2014.
|
| [36] |
王坤, 黄震方, 曹芳东, 等. 泛长江三角洲城市旅游绩效空间格局演变及其影响因素[J]. 自然资源学报, 2016, 31(7):1149-1163.
|
| [37] |
|
/
| 〈 |
|
〉 |