
金融发展与城市全要素生产率增长——以长三角城市群26个城市为例
|
黄大为(1977—),男,辽宁海城人,博士研究生,副教授,研究方向为产业经济和区域经济。E-mail:daweihuang@163.com |
收稿日期: 2020-07-03
修回日期: 2021-03-15
网络出版日期: 2025-04-08
基金资助
教育部人文社会科学研究一般项目(17YJCZH063)
广东省普通高校特色创新项目(2020WTSCX237)
深圳市哲学社会科学2020年度课题(SZ2020B012)
广东省现代产业与中小企业创新发展研究中心资助项目
Financial Development and Urban Total Factor Productivity Growth:A Case Study of 26 Cities in the Yangtze River Delta Urban Agglomeration
Received date: 2020-07-03
Revised date: 2021-03-15
Online published: 2025-04-08
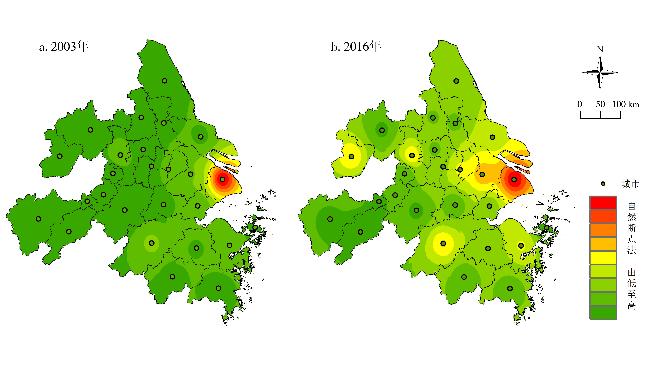
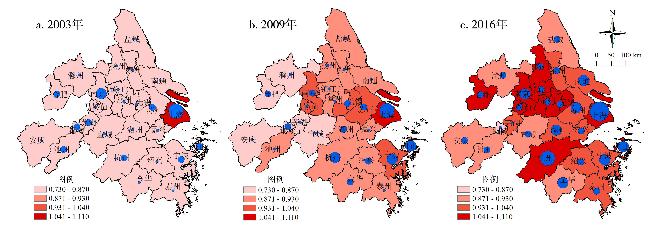
根据长三角城市群26个城市2003—2016年的面板数据,应用TOPSIS法对五指标金融发展评价体系进行评价测算,应用DEA-Malmquist法测算城市全要素生产率增长及其分解指标,探讨长三角城市群金融发展与全要素生产率空间分布特征以及时空演变规律,研究发现二者均存在显著的空间自相关与空间非均衡分布特征,整体空间结构呈现出多核集聚特征。此外,通过空间杜宾面板计量模型实证分析金融发展及子指标对城市全要素生产率增长的作用关系与作用路径,研究发现城市金融发展对自身全要素生产率增长有显著促进作用,对周边城市全要素生产率增长有显著负向作用,且这两种作用均主要源自其对技术进步增长的影响。最后针对性提出三点建议:加强长三角区域协调发展、加快长三角金融一体化进程以及重视技术效率改进带来的全要素生产率的提升。
关键词: 金融发展; 全要素生产率增长; 长三角城市群; DEA-Malmquist
黄大为 . 金融发展与城市全要素生产率增长——以长三角城市群26个城市为例[J]. 经济地理, 2021 , 41(6) : 77 -86 . DOI: 10.15957/j.cnki.jjdl.2021.06.009
According to the panel data of 26 cities in the Yangtze River Delta Urban Agglomeration from 2003 to 2016,this study evaluates and calculates the financial development by the means of the TOPSIS method,measures the urban total factor productivity growth and its decomposition indicators applying the DEA-Malmquist method,and analyzes the distribution characteristics of financial development and total factor productivity in the Yangtze River Delta Urban Agglomeration. the results are found that both of them have significant spatial autocorrelation and spatial non-equilibrium distribution characteristics,and it overall presents the characteristic of multi-core agglomeration. In addition,through the spatial Dubin model,it analyzes the relationship between urban total factor productivity growth and financial development,sub-indicators,and their the action path. It's found that urban financial development plays a significant role in promoting the growth of total factor productivity,has a significant negative effect on nearby cities,and both of these effects are mainly due to its impact on the growth of technological progress. Finally,three suggestions are put forward,which are strengthening the coordinated development of the Yangtze River Delta region,accelerating the process of financial integration in the Yangtze River Delta,and attaching importance to the improvement of total factor productivity brought about by technological efficiency improvement.
表1 模型变量与指标Tab.1 Model variables and indicators |
| 变量属性 | 变量名称及符号 | 具体指标 | 文献支持 |
|---|---|---|---|
| 被解释变量 | 全要素生产率变化率(tfpch)* | 根据DEA-Malmquist指数法计算得出(取对数) | 刘建国等(2012)[11] |
| 技术效率变化率(effch) | |||
| 技术进步变化率(tech) | |||
| 解释变量 | 金融发展(fin) | 根据TOPSIS评价法计算得出 | 本研究选择应用TOPSIS评价法 |
| 金融规模(sca) | 年末金融机构存贷款余额总额/地区生产总值 | 李苗苗等(2015)[13] | |
| 金融效率(eff) | 贷存比 | 李健等(2015)[14] | |
| 金融结构(str) | 财政支出/固定资产投资总额 | Guariglia等(2008)[15] | |
| 金融稳定(sta) | 固定资产投资总额中非房地产投资占比 | 彭芳梅(2019)[16] | |
| 金融集聚(agg) | 金融业从业人员区位商 | 施卫东等(2013)[17] | |
| 控制变量 | 物质资本累积(k) | 物质资本存量 | 单豪杰(2008)[18] |
| 劳动力素质(h) | 万人在校大学生数 | 高翔(2015)[19] | |
| 外资依存度(fdi) | 当年实际利用外资金额/GDP | 李健等(2015)[14] | |
| 交通基础设施(trans) | 客货运总量 | 杨浩昌等(2018)[20] | |
| 通信基础设施(comm) | 电信业务总量 | ||
| 产业结构(ind) | GDP中二产与三产的比值代表产业结构 | 张帆(2017)[21] | |
| 科技支出(sci) | 一般预算财政支出中科学事业支出比例 | 唐婍婧等(2017)[22] | |
| 教育支出(edu) | 一般预算财政支出中教育事业支出比例 |
注:“*”全要素生产率变化率这里改用tfpch而不是tfp,是因为反映的是全要素生产率增长,而不是全要素生产率,即本文考察的是金融发展对全要素生产率的增长效应,相应的后续模型实证中都采用tfpch。 |
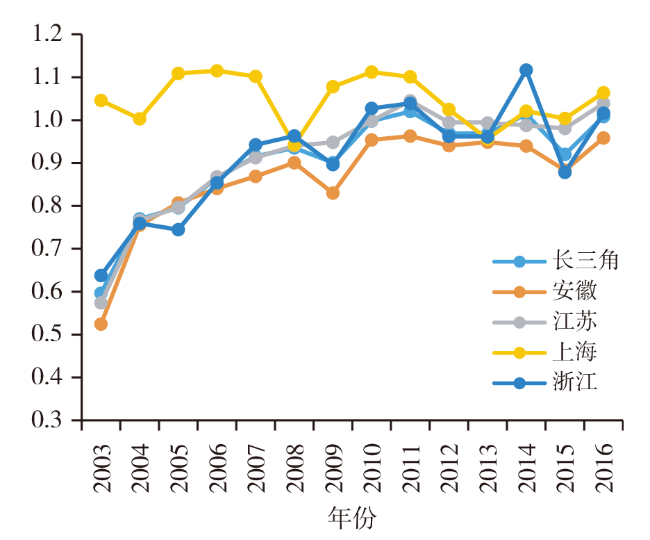
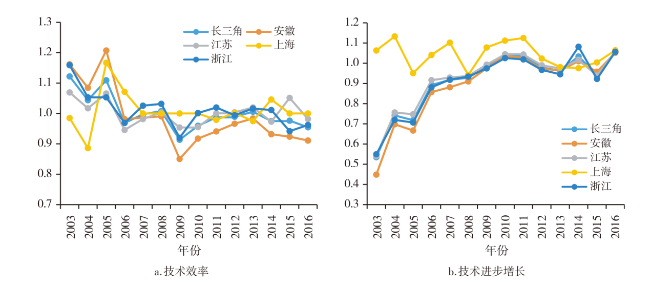
图2 长三角城市群全要素生产率增长(2003—2016年)Fig.2 Total factor productivity growth in the Yangtze River Delta Urban Agglomeration (2003-2016) |
表2 金融发展与全要素生产率增长空间自相关检验Tab.2 Spatial autocorrelation test of financial development and total factor productivity growth |
| 年份 | tfpch | fin | |||
|---|---|---|---|---|---|
| Moran's I | p-value | Moran's I | p-value | ||
| 2003 | 0.029*** | 0.001 | -0.006*** | 0.029 | |
| 2004 | 0.030*** | 0.001 | 0.007*** | 0.009 | |
| 2005 | 0.023*** | 0.002 | 0.019*** | 0.003 | |
| 2006 | 0.026*** | 0.001 | 0.024*** | 0.002 | |
| 2007 | 0.026*** | 0.002 | 0.026*** | 0.002 | |
| 2008 | 0.027*** | 0.002 | 0.025*** | 0.002 | |
| 2009 | 0.026*** | 0.002 | 0.022*** | 0.004 | |
| 2010 | 0.026*** | 0.002 | 0.019*** | 0.007 | |
| 2011 | 0.025*** | 0.003 | 0.014** | 0.017 | |
| 2012 | 0.025*** | 0.004 | 0.013** | 0.024 | |
| 2013 | 0.025*** | 0.005 | 0.012** | 0.032 | |
| 2014 | 0.022*** | 0.006 | 0.011** | 0.042 | |
| 2015 | 0.020*** | 0.008 | 0.010** | 0.050 | |
| 2016 | 0.019*** | 0.009 | 0.009* | 0.058 | |
表3 金融发展与全要素生产率增长回归估计结果Tab.3 The regression estimation results of financial development and total factor productivity growth |
| OLS(1)lntfpch | OLS(2)lneffch | OLS(3)lntechch | SDM(4)lntfpch | SDM(5)lneffch | SDM(6)lntechch | |
|---|---|---|---|---|---|---|
| lnfin | -0.104*(-1.764) | 0.043(0.933) | -0.204***(-3.762) | 0.215***(2.955) | 0.098*(1.716) | 0.137**(2.531) |
| lnk | 0.252***(17.516) | 0.032*(1.822) | 0.306***(23.259) | 0.260***(7.949) | 0.035(1.154) | 0.274***(11.151) |
| lnh | -0.381***(-11.835) | -0.126***(-4.307) | -0.355***(-12.071) | -0.281***(-8.766) | -0.117***(-4.309) | -0.196***(-8.196) |
| lnfdi | -0.032**(-2.452) | -0.026***(-2.628) | -0.008(-0.701) | -0.022*(-1.781) | -0.017*(-1.796) | -0.006(-0.640) |
| lnsci | -11.349***(-3.006) | -1.223(-0.418) | -14.124***(-4.088) | -5.858*(-1.754) | 0.684(0.260) | -7.760***(-3.111) |
| lnedu | -2.957(-1.300) | 0.859(0.495) | -5.323**(-2.557) | 1.010(0.462) | -0.907(-0.530) | 2.271(1.392) |
| lnind | -0.014(-0.599) | -0.005(-0.261) | -0.013(-0.611) | -0.023(-1.126) | -0.029*(-1.830) | 0.007(0.492) |
| lncomm | 0.062***(2.834) | 0.027(1.583) | 0.050**(2.485) | 0.048***(2.580) | 0.028*(1.949) | 0.022(1.606) |
| lntrans | 0.005(0.318) | -0.002(-0.121) | 0.010(0.621) | -0.041**(-2.437) | -0.017(-1.298) | -0.028**(-2.202) |
| cons | 1.115***(3.852) | 0.699***(3.172) | 0.582**(2.195) | |||
| Wlnfin | -0.581***(-3.225) | -0.302**(-2.119) | -0.308**(-2.384) | |||
| rho | 0.484***(4.816) | 0.505***(5.103) | 0.668***(10.298) | |||
| (adj.)R2 | 0.699 | 0.289 | 0.818 | 0.710 | 0.185 | 0.817 |
表4 金融发展影响全要素生产率增长路径分析Tab.4 Path analysis of the influence of financial development on the growth of total factor productivity |
| SDM(7)lntfpch | SDM(8)lneffch | SDM(9)lntechch | |
|---|---|---|---|
| lnsca | 0.062*(1.669) | -0.033(-1.562) | 0.058**(2.071) |
| lneff | -0.059*(-1.862) | -0.029(-1.579) | 0.007(0.280) |
| lnstr | 0.161***(4.283) | 0.070***(3.157) | -0.005(-0.163) |
| lnsta | -0.047(-1.396) | -0.019(-1.004) | 0.006(0.229) |
| lnagg | 0.111***(3.559) | -0.045**(-2.379) | 0.093***(3.792) |
| lnk | 0.338***(9.076) | -0.119***(-4.793) | 0.272***(8.966) |
| lnh | -0.238***(-6.516) | 0.031(1.289) | -0.164***(-5.495) |
| lnfdi | -0.014(-1.126) | -0.009(-1.247) | -0.000(-0.002) |
| lnsci | -8.514***(-2.580) | -0.011(-1.298) | 0.014(1.324) |
| lnedu | -4.531*(-1.874) | 0.004(0.148) | -0.023(-0.669) |
| lnind | -0.034*(-1.759) | -0.029***(-2.577) | 0.019(1.292) |
| lncomm | 0.053***(2.942) | 0.011(0.991) | 0.010(0.700) |
| lntrans | -0.029*(-1.742) | 0.011(1.136) | -0.027**(-2.125) |
| Wlnsca | -0.319***(-3.444) | 0.065(1.026) | -0.185***(-2.831) |
| Wlneff | 0.015(0.223) | -0.028(-0.707) | 0.026(0.509) |
| Wlnstr | 0.097(0.677) | -0.112(-1.275) | 0.182*(1.654) |
| Wlnsta | -0.242*(-1.671) | -0.030(-0.324) | -0.024(-0.238) |
| Wlnagg | -0.189(-0.872) | -0.608***(-4.463) | 0.467***(2.649) |
| rho | 0.313**(2.510) | 0.675***(10.557) | 0.634***(8.884) |
| adj.R2 | 0.529 | 0.0690 | 0.561 |
| [1] |
李扬. “金融服务实体经济” 辨[J]. 经济研究, 2017, 52(6):4-16.
|
| [2] |
|
| [3] |
|
| [4] |
王定祥, 刘杰, 李伶俐. 财政分权、银行信贷与全要素生产率[J]. 财经研究, 2011, 37(4):69-79.
|
| [5] |
姚耀军. 中国金融发展与全要素生产率——基于时间序列的经验证据[J]. 数量经济技术经济研究, 2010, 27(3):68-80.
|
| [6] |
李标, 宋长旭, 吴贾. 创新驱动下金融集聚与区域经济增长[J]. 财经科学, 2016(1):88-99.
|
| [7] |
|
| [8] |
|
| [9] |
熊湘辉, 徐璋勇. 中国新型城镇化进程中的金融支持影响研究[J]. 数量经济技术经济研究, 2015, 32(6):73-89.
|
| [10] |
陈刚, 王苏生, 韩雪. 我国金融空间布局新思路[J]. 开放导报, 2017(3):101-105.
|
| [11] |
刘建国, 李国平, 张军涛, 等. 中国经济效率和全要素生产率的空间分异及其影响[J]. 地理学报, 2012, 67(8):1069-1084.
|
| [12] |
刘常青, 李磊, 卫平. 中国地级及以上城市资本存量测度[J]. 城市问题, 2017(10):69-74.
|
| [13] |
李苗苗, 肖洪钧, 赵爽. 金融发展,技术创新与经济增长的关系研究——基于中国的省市面板数据[J]. 中国管理科学, 2015, 23(2):162-169.
|
| [14] |
李健, 卫平. 金融发展与全要素生产率增长——基于中国省际面板数据的实证分析[J]. 经济理论与经济管理, 2015(8):47-64.
|
| [15] |
|
| [16] |
彭芳梅. 金融发展、空间联系与粤港澳大湾区经济增长[J]. 贵州社会科学, 2019(3):109-117.
|
| [17] |
施卫东, 高雅. 金融服务业集聚发展对产业结构升级的影响——基于长三角16个中心城市面板数据的实证检验[J]. 经济与管理研究, 2013(3):73-81.
|
| [18] |
单豪杰. 中国资本存量K的再估算:1952-2006年[J]. 数量经济技术经济研究, 2008, 25(10):17-31.
|
| [19] |
高翔. 城市规模、人力资本与中国城市创新能力[J]. 社会科学, 2015(3):49-58.
|
| [20] |
杨浩昌, 李廉水, 刘军. 产业聚集与中国城市全要素生产率[J]. 科研管理, 2018, 39(1):83-94.
|
| [21] |
张帆. 金融发展影响绿色全要素生产率的理论和实证研究[J]. 中国软科学, 2017(9):154-167.
|
| [22] |
唐婍婧, 韩廷春. 金融发展对全要素生产率的影响——基于社会融资规模的视角[J]. 经济与管理研究, 2017, 38(6):23-34.
|
| [23] |
陈启清, 贵斌威. 金融发展与全要素生产率:水平效应与增长效应[J]. 经济理论与经济管理, 2013(7):58-69.
|
/
| 〈 |
|
〉 |
