
基于多维要素流视角的城市群网络结构及影响因素分析——以武汉城市圈为例
|
王逸舟(1997—),女,湖南长沙人,硕士,研究方向为城市网络、城市流等。E-mail:wyz970117@yahoo.com |
收稿日期: 2020-05-24
修回日期: 2021-05-13
网络出版日期: 2025-04-08
基金资助
国家自然科学基金面上项目(41571384)
Analysis on the Network Structure of Urban Agglomeration and Its Influencing Factors Based on the Perspective of Multi-dimensional Feature Flow:Taking Wuhan Urban Agglomeration as an Example
Received date: 2020-05-24
Revised date: 2021-05-13
Online published: 2025-04-08
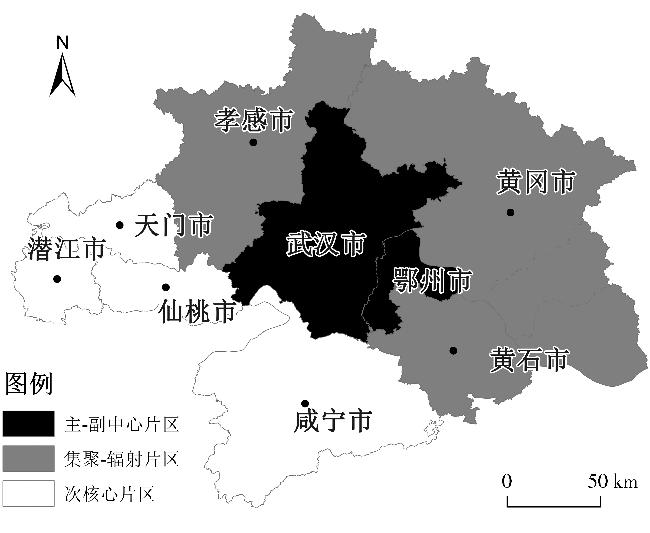
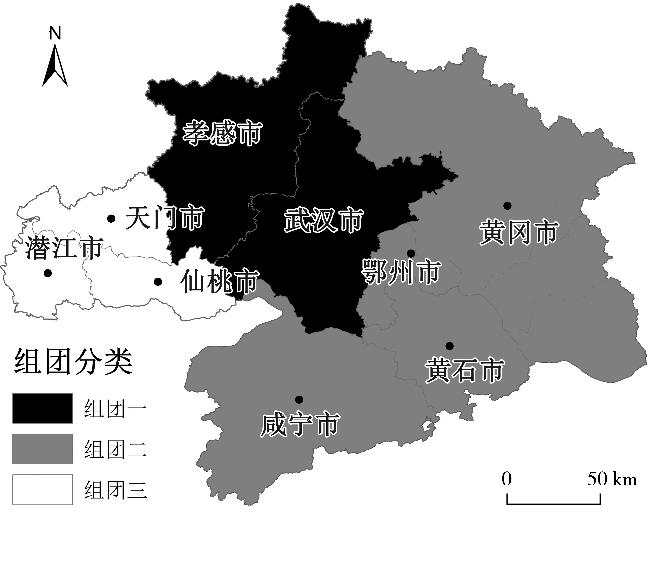
基于多维要素流视角,以武汉城市圈9个城市为研究区域,从节点、层级、子网络三个方面对经济、人口、交通、信息等网络的空间结构进行刻画,并进行多维网络对比分析,用企业水平差异、文化节点性差异、平均时间距离差异、人均GDP差异、行业结构差异等五个影响因子构建多重网络关系回归模型,剖析多重网络影响因素。研究结果表明:①武汉城市圈可划分为三级联系片区,武汉、鄂州分别为主副中心,黄石、孝感、黄冈三市为集聚—辐射中心片区,其余城市为次级核心城市。②多维网络之间的相似性排序为经济网络—信息网络>经济网络—人口网络>人口网络—信息网络>经济网络—交通网络>人口网络—交通网络>交通网络—信息网络,经济网络与其余各类网络之间的相似性最高。③交通效率及企业发展水平是使多维网络产生相似性的主要因素,而经济发展水平、文化关系、产业分工影响因素是多维网络产生差异性的主要因素,其中文化关系影响最薄弱,交通效率因素影响最强。
王逸舟 , 王海军 , 张彬 , 黄鑫鑫 . 基于多维要素流视角的城市群网络结构及影响因素分析——以武汉城市圈为例[J]. 经济地理, 2021 , 41(6) : 68 -76 . DOI: 10.15957/j.cnki.jjdl.2021.06.008
Based on the perspective of multi-dimensional element flow,taking nine cities in Wuhan Urban Agglomeration as the research area,this paper describes the spatial structure of the four networks—the economy network,the population network,the transportation network,and the information network—from the three aspects of node,level,and sub-network,and compares multiple networks. The analysis uses five factors,namely,the differences in enterprise level,education level,transportation level,per capita GDP and industry structure, to construct a multiple network relationship regression model,and analyzes the influencing factors of multiple networks. The research results show that: 1) Wuhan Urban Agglomeration is divided into three-level areas which are the main and sub-center areas (Wuhan and Ezhou), the cluster-radiation areas (Huangshi,Xiaogan and Huanggang) and the sub-core cities (the rest of cities). 2) The similarities between multi-dimensional networks are sorted in descending order: the similarity between the economic network and the information network,the similarity between the economic network and the population network, the similarity between the population network and the information network,the similarity between the economic network and the transportation network,the similarity between the population network and the transportation network,the similarity between the transportation network and the information network. The similarity between the economic network and the other networks is the highest. 3) Transportation efficiency and enterprise level are the main factors that cause the similarities between the four networks,and the influencing factors of economic growth,cultural relations,and industrial division of labor are the main factors that cause the differences between the four networks. Among them,transportation efficiency has the strongest effect,while cultural relation has the weakest effect.
表1 城市综合实力评价指标体系Tab.1 Evaluation index system of urban comprehensive strength |
| 一级指标 | 二级指标 | 三级指标 |
|---|---|---|
| 总量指标 | 经济实力 | GDP |
| 人均GDP | ||
| 全社会固定资产投资额 | ||
| 工业总产值 | ||
| 工业企业单位数 | ||
| 社会消费品零售总额 | ||
| 政府实力 | 进出口总额 | |
| 地方一般公共预算收入 | ||
| 地方一般公共预算支出 | ||
| 房地产开发投资完成额 | ||
| 金融实力 | 金融机构人民币存款 | |
| 金融机构人民币贷款余额 | ||
| 人口规模 | 常住人口 | |
| 就业人数 | ||
| 质量指标 | 发展趋势 | GDP增长率 |
| 第二产业占GDP的比重 | ||
| 城镇人口占城市常住人口的比重 | ||
| 基础设施建设 | 每万人拥有医院床位数 | |
| 每万人拥有公共汽电车数量 | ||
| 每万人拥有公共图书馆藏书数量 | ||
| 居民生活 | 普通本专科在校学生数与户籍人数比例 | |
| 普通高等学校数 | ||
| 人均可支配收入 | ||
| 在岗职工平均工资 | ||
| 流量指标 | 经济流 | 国内旅游收入 |
| 接待游客人数 | ||
| 实际利用外资投资额 | ||
| 实物流 | 城市客运总量 | |
| 城市货运总量 | ||
| 信息流 | 邮电业务总量 | |
| 互联网宽带接入用户数 | ||
| 移动电话年末用户数 |
表2 数据来源Tab.2 The sources of data |
| 网络类型 | 关系数据来源 |
|---|---|
| 经济网络 | 从中国城市统计年鉴、湖北省统计年鉴、城市圈9个城市年鉴中获得城市综合质量指标数据。从极品时刻表中获得城市之间的各类交通班次、所需时间、交通距离(中转方式不计入计算)。 |
| 人口网络 | 从腾讯位置大数据平台上爬取2016年11月1日—7日武汉城市圈内各城市之间的人口迁徙数据。 |
| 信息网络 | 从百度指数网站中获取2016年7月19—8月17日共30天内两城市之间的百度信息指数,根据搜索值建立有向信息联系对72个。 |
| 交通网络 | 基于携程网和114票务网获取2016年11月1日—11月30日内武汉城市圈两两城市之间的班次数目;根据《中国铁路技术管理规程》和《湖北省客运管理条例》确定列车及汽车载客量。 |
表3 武汉城市圈多维网络的相对中心度Tab.3 Relative centrality degree of multiple networks in the Wuhan Urban Agglomeration |
| 城市 | 经济网络 | 人口网络 | 交通网络 | 信息网络 | |||||||
|---|---|---|---|---|---|---|---|---|---|---|---|
| 点出度 | 点入度 | 点出度 | 点入度 | 点出度 | 点入度 | 点出度 | 点入度 | ||||
| 武汉 | 48.156 | 49.158 | 38.559 | 42.553 | 34.433 | 38.539 | 83.349 | 29.630 | |||
| 黄石 | 18.061 | 19.939 | 9.892 | 10.068 | 19.092 | 20.720 | 18.522 | 23.061 | |||
| 鄂州 | 19.346 | 17.939 | 11.550 | 10.961 | 21.241 | 20.720 | 14.690 | 23.221 | |||
| 孝感 | 13.151 | 13.615 | 13.666 | 13.909 | 4.713 | 5.107 | 26.186 | 21.122 | |||
| 黄冈 | 25.747 | 25.255 | 13.006 | 13.126 | 3.789 | 1.872 | 19.457 | 20.005 | |||
| 咸宁 | 12.585 | 12.664 | 5.788 | 5.744 | 9.121 | 4.014 | 12.523 | 25.228 | |||
| 仙桃 | 10.508 | 9.994 | 3.884 | 2.782 | 5.954 | 7.387 | 12.089 | 19.799 | |||
| 潜江 | 8.276 | 8.271 | 1.994 | 0.594 | 6.689 | 9.719 | 7.596 | 21.966 | |||
| 天门 | 6.239 | 5.239 | 2.568 | 1.170 | 6.517 | 6.445 | 8.850 | 19.229 | |||
表4 武汉城市圈多维网络的特征向量中心度Tab.4 Eigenvector centrality degree of multiple networks in the Wuhan Urban Agglomeration |
| 城市 | 经济网络 | 人口网络 | 交通网络 | 信息网络 |
|---|---|---|---|---|
| 武汉 | 0.611 | 0.680 | 0.574 | 0.618 |
| 黄石 | 0.352 | 0.242 | 0.514 | 0.299 |
| 鄂州 | 0.350 | 0.295 | 0.529 | 0.285 |
| 孝感 | 0.245 | 0.446 | 0.132 | 0.328 |
| 黄冈 | 0.462 | 0.380 | 0.090 | 0.269 |
| 咸宁 | 0.240 | 0.186 | 0.229 | 0.304 |
| 仙桃 | 0.153 | 0.096 | 0.080 | 0.244 |
| 潜江 | 0.118 | 0.049 | 0.140 | 0.253 |
| 天门 | 0.112 | 0.058 | 0.149 | 0.226 |
| 平均值 | 0.294 | 0.270 | 0.270 | 0.314 |
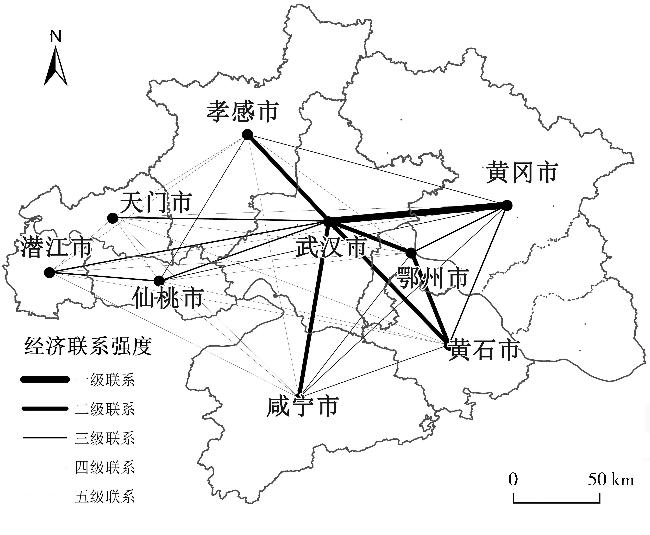
图2 武汉城市圈经济网络空间联系图Fig.2 Spatial relation of economic network in Wuhan Urban Agglomeration |
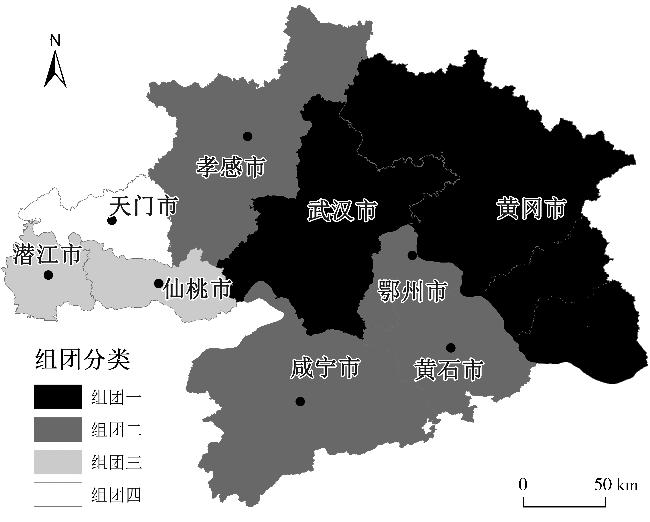
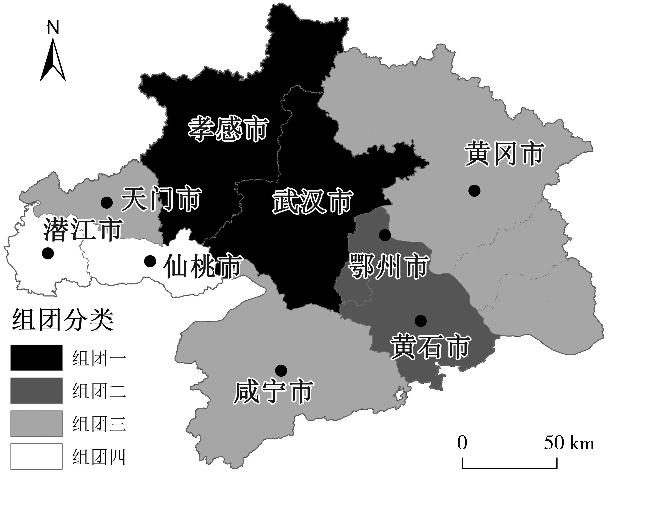
图3 武汉城市圈经济网络凝聚子群可视化图Fig.3 Cohesion subgroup visualization of economic network in Wuhan Urban Agglomeration |
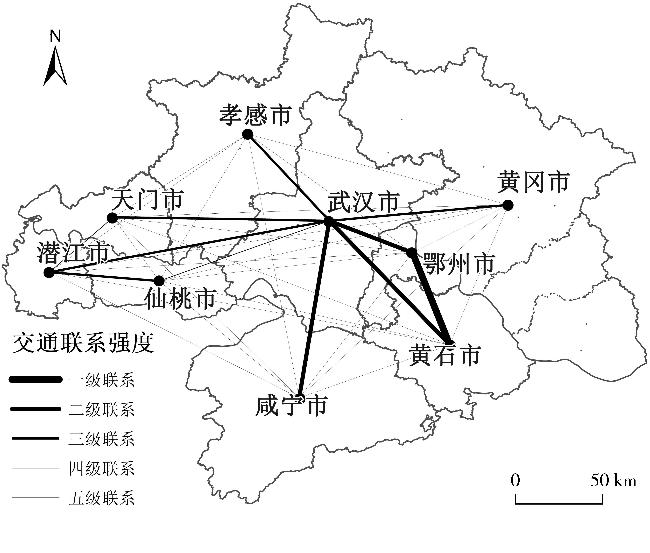
图4 武汉城市圈交通网络空间联系图Fig.4 Spatial relation of transportation network in Wuhan Urban Agglomeration |
图5 武汉城市圈交通网络凝聚子群可视化图Fig.5 Cohesion subgroup visualization of transportation network in Wuhan Urban Agglomeration |
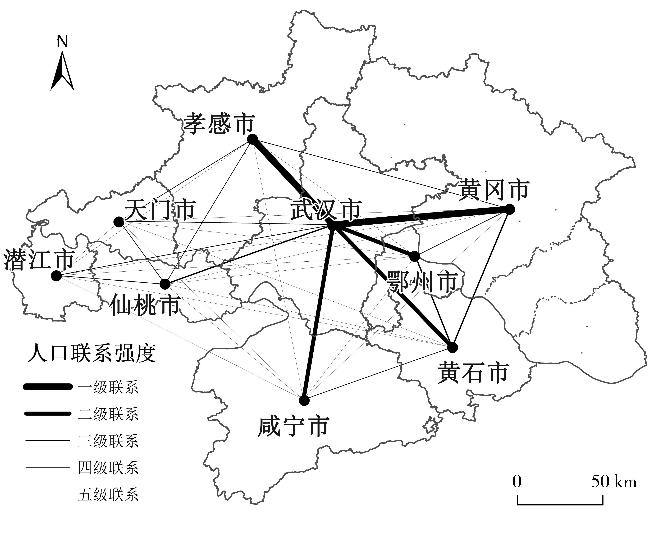
图6 武汉城市圈人口网络空间联系图Fig.6 Spatial relation of population network in Wuhan Urban Agglomeration |
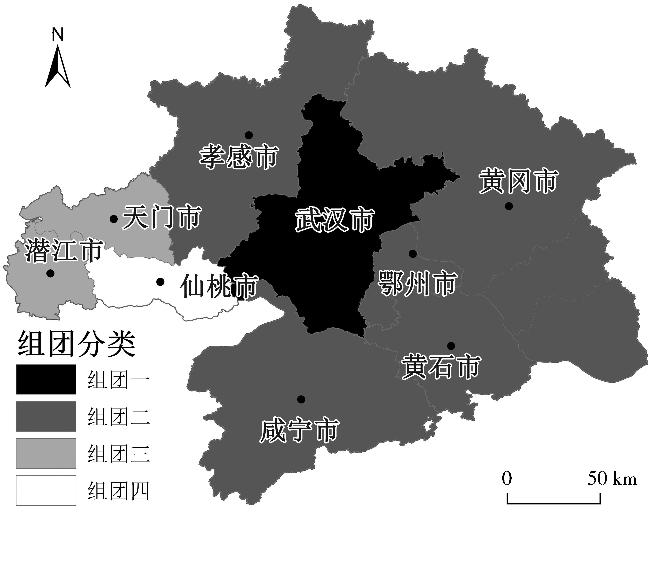
图7 武汉城市圈人口网络凝聚子群可视化图Fig.7 Cohesion subgroup visualization of population network in Wuhan Urban Agglomeration |
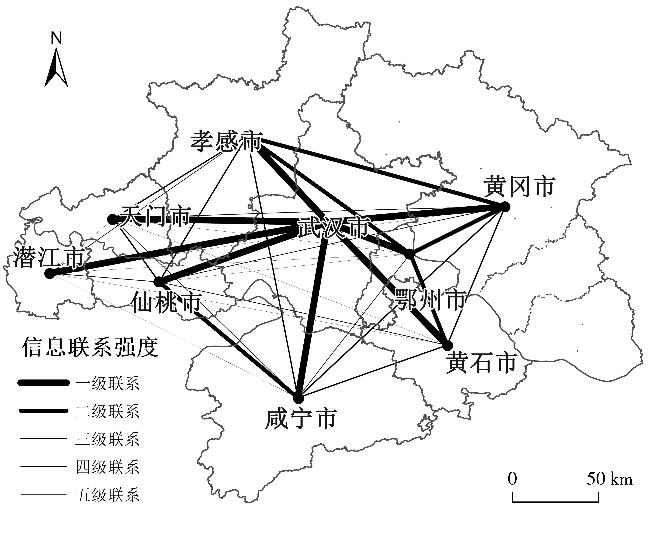
图8 武汉城市圈信息交通网络空间联系图Fig.8 Spatial relation of information network in Wuhan Urban Agglomeration |
图9 武汉城市圈信息网络凝聚子群可视化图Fig.9 Cohesion subgroup visualization of information network in Wuhan Urban Agglomeration |
表5 凝聚子群三级层面组团联系系数Tab.5 Contact coefficient of cohesive subgroups at tertiary level |
| 网络类型 | 组团 | 武汉—黄冈 | 黄石—鄂州 | 孝感—咸宁 | 仙桃—潜江 | 天门 |
|---|---|---|---|---|---|---|
| 经济 | 武汉—黄冈 | - | 1.318 | 1.417 | 0.804 | 1.267 |
| 武汉—孝感 | 黄石—鄂州 | 黄冈—咸宁 | 仙桃—潜江 | 天门 | ||
| 交通 | 武汉—孝感 | - | 2.636 | 2.631 | 1.563 | 1.257 |
| 武汉 | 黄石—鄂州 | 孝感—黄冈—咸宁 | 潜江—天门 | 仙桃 | ||
| 人口 | 武汉 | - | 2.073 | 2.640 | 2.231 | 0.531 |
| 武汉—孝感 | 黄冈—黄石 | 鄂州—咸宁 | 潜江—天门 | 仙桃 | ||
| 信息 | 武汉—孝感 | - | 1.343 | 1.306 | 1.364 | 1.388 |
表6 武汉城市圈多维网络QAP相关分析Tab.6 QAP correlation analysis of multi-dimensional network in Wuhan Urban Agglomeration |
| A/B | 经济联系 | 交通联系 | 人口联系 | 信息联系 |
|---|---|---|---|---|
| 经济联系 | 0 | 0.6240 | 0.6720 | 0.6722 |
| 交通联系 | 0.6240 | 0 | 0.5522 | 0.4860 |
| 人口联系 | 0.6720 | 0.5522 | 0 | 0.6328 |
| 信息联系 | 0.6722 | 0.4860 | 0.6328 | 0 |
表7 武汉城市圈多重网络的影响因素回归结果Tab.7 Regression results of influencing factors of multiple urban networks in Wuhan Urban Agglomeration |
| 影响因素 | 影响因子 | 回归系数 | |||
|---|---|---|---|---|---|
| 经济网络 | 人口网络 | 交通网络 | 信息网络 | ||
| 经济发展水平 | 人均GDP差异 | 0.2142 | 0.2870** | 0.2541* | 0.1235** |
| 产业分工 | 行业结构差异 | -0.4241* | 0.0198** | -0.6673 | 0.0057 |
| 交通效率 | 平均时间距离差异 | -0.3660** | -0.3283*** | -0.3997** | -0.1928** |
| 企业发展水平 | 企业水平差异 | 0.5095* | 0.4337* | 0.8789* | 0.4724** |
| 文化关系 | 文化节点性差异 | -0.1489 | -0.1306 | 0.3769 | 0.1198** |
| R-squared | 0.724 | 0.614 | 0.499 | 0.616 | |
| 观察项个数 | 72 | 72 | 72 | 72 | |
| 随机置换次数 | 5 000 | 5 000 | 5 000 | 5 000 | |
注:*、**、***分别代表在0.1、0.05、0.001显著性水平下通过检验。 |
| [1] |
方创琳. 中国城市群研究取得的重要进展与未来发展方向[J]. 地理学报, 2014, 69(8):1130-1144.
|
| [2] |
张荣天, 焦华富. 江苏省城市网络空间结构演化特征与驱动机制[J]. 世界地理研究, 2015, 24(1):68-75.
|
| [3] |
吴康, 方创琳, 赵渺希. 中国城市网络的空间组织及其复杂性结构特征[J]. 地理研究, 2015, 34(4):711-728.
|
| [4] |
|
| [5] |
|
| [6] |
|
| [7] |
|
| [8] |
|
| [9] |
|
| [10] |
鲍超, 陈小杰. 中国城市体系的空间格局研究评述与展望[J]. 地理科学进展, 2014, 33(10):1300-1311.
|
| [11] |
李仙德. 基于上市公司网络的长三角城市网络空间结构研究[J]. 地理科学进展, 2014, 33(12):1587-1600.
|
| [12] |
王圣云, 宋雅宁, 温湖炜, 等. 双向联系视域下长江经济带城市群网络结构——基于时间距离和社会网络分析方法[J]. 经济地理, 2019, 39(2):73-81.
|
| [13] |
熊丽芳, 甄峰, 王波, 等. 基于百度指数的长三角核心区城市网络特征研究[J]. 经济地理, 2013, 33(7):67-73.
|
| [14] |
宋琼, 赵新正, 李同昇, 等. 多重城市网络空间结构及影响因素——基于有向多值关系视角[J]. 地理科学进展, 2018, 37(9):1257-1267.
|
| [15] |
李春洋. 武汉城市圈建设概况[M]. 武汉: 武汉年鉴社, 2016.
|
| [16] |
刘阳, 董捷. 武汉城市圈土地利用结构与产业结构特点分析[J]. 国土资源科技管理, 2010, 27(3):23-27.
|
| [17] |
王海军, 翟丽君, 刘艳芳, 等. 基于多维城市要素流的武汉城市圈城市联系与功能分析[J]. 经济地理, 2018, 38(7):50-58.
|
| [18] |
贺欢欢, 吕斌. 长株潭城市群经济联系测度研究[J]. 经济地理, 2014, 34(7):67-74.
|
| [19] |
苗洪亮, 周慧. 中国三大城市群内部经济联系和等级结构的比较——基于综合引力模型的分析[J]. 经济地理, 2017, 37(6):52-59.
|
| [20] |
刘金石, 李小江. 中国城市竞争力指数测度及其影响因素——基于1990—2012年中国30个城市面板数据的实证研究[J]. 财经科学, 2013(8):92-100.
|
| [21] |
陈韶清, 夏安桃. 长江中游城市群城市韧性与规模关系的时空分析[J]. 湖南师范大学自然科学学报, 2020, 43(3):10-17.
|
| [22] |
钱春蕾, 叶菁, 陆潮. 基于改进城市引力模型的武汉城市圈引力格局划分研究[J]. 地理科学进展, 2015, 34(2):237-245.
|
| [23] |
赵梓渝, 魏冶, 庞瑞秋, 等. 基于人口省际流动的中国城市网络转变中心性与控制力研究——兼论递归理论用于城市网络研究的条件性[J]. 地理学报, 2017, 72(6):1032-1048.
|
| [24] |
陈伟, 修春亮, 柯文前, 等. 多元交通流视角下的中国城市网络层级特征[J]. 地理研究, 2015, 34(11):2073-2083.
|
| [25] |
蒋大亮, 孙烨, 任航, 等. 基于百度指数的长江中游城市群城市网络特征研究[J]. 长江流域资源与环境, 2015, 24(10):1654-1664.
|
| [26] |
王启轩, 张艺帅, 程遥. 信息流视角下长三角城市群空间组织辨析及其规划启示——基于百度指数的城市网络辨析[J]. 城市规划学刊, 2018(3):105-112.
|
| [27] |
汤放华, 汤慧, 孙倩, 等. 长江中游城市集群经济网络结构分析[J]. 地理学报, 2013, 68(10):1357-1366.
|
| [28] |
张荣天, 焦华富. 江苏省城市网络空间结构演化特征与驱动机制[J]. 世界地理研究, 2015, 24(1):68-75.
|
| [29] |
刘军. 社会网络分析导论[M]. 北京: 社会科学文献出版社, 2004.
|
| [30] |
钟业喜, 冯兴华, 文玉钊. 长江经济带经济网络结构演变及其驱动机制研究[J]. 地理科学, 2016, 36(1):10-19.
|
| [31] |
朱媛媛, 曾菊新, 韩勇. 基于信息流的武汉城市圈城乡文化空间结构研究[J]. 人文地理, 2015, 30(1):105-111.
|
| [32] |
柏培文, 张伯超. 工资差异与劳动力流动对经济的影响——以上市公司行业结构和产出为视角[J]. 中国人口科学, 2016(2):47-60,127.
|
| [33] |
王俊, 夏杰长. 中国省域旅游经济空间网络结构及其影响因素研究——基于QAP方法的考察[J]. 旅游学刊, 2018, 33(9):13-25.
|
| [34] |
任会明, 叶明确, 祝影. 基于教育网络的上海城市网络空间结构研究[J]. 经济地理, 2019, 39(8):77-86.
|
/
| 〈 |
|
〉 |