
京津冀地区工业碳排放效率时空演化特征及影响因素
|
蔺雪芹(1980—),女,甘肃武威人,博士,副教授,研究方向为区域可持续发展。E-mail:linxueqin@cnu.edu.cn |
收稿日期: 2020-06-16
修回日期: 2021-03-22
网络出版日期: 2025-04-08
基金资助
国家自然科学基金面上项目(42071148)
教育部人文社会科学研究青年基金项目(16YJC790056)
Spatiotemporal Evolution Characteristics and Influencing Factors of Industrial Carbon Emission Efficiency in Beijing-Tianjin-Hebei Region
Received date: 2020-06-16
Revised date: 2021-03-22
Online published: 2025-04-08
蔺雪芹 , 边宇 , 王岱 . 京津冀地区工业碳排放效率时空演化特征及影响因素[J]. 经济地理, 2021 , 41(6) : 187 -195 . DOI: 10.15957/j.cnki.jjdl.2021.06.021
Taking 13 cities in Beijing-Tianjin-Hebei region as the research object and using the relevant data of industry and industrial energy consumption and industrial output value from 2000 to 2018,this paper analyzes the spatiotemporal evolution characteristics of industrial carbon emission efficiency in Beijing-Tianjin-Hebei region and explores its influencing factors by the means of the two-stage super SBM model,ArcGIS spatial analysis and spatial econometric model. The results show that: 1) From 2000 to 2018,the industrial carbon emission efficiency of Beijing,Tianjin and Hebei increased year by year,the spatial pattern changed from "high in the center,low in the surrounding areas" to "strip distribution of high-value areas and dispersed distribution of low-value areas",and the overall difference narrowed. 2) The differences of carbon emission efficiency among different industries were significant and gradually increasing,and the spatial differentiation pattern of different industries was significantly different. 3) Productivity level and industrial R&D investment and opening-up level have a positive effect on industrial carbon emission efficiency,and this effect continues to increase. Industrialization level and industrial carbon emission efficiency change from significant negative correlation to significant positive correlation; energy consumption intensity and industrial carbon emission efficiency are always negatively correlated,but this negative effect gradually decreases; the relationship between level of heavy industry,energy consumption structure and industrial carbon emission efficiency changes from the unrelated to the negative.
表1 工业碳排放效率影响因素变量说明Tab.1 Description of variables affecting industrial carbon emission efficiency |
| 解释变量 | 变量定义 | 作用预判 |
|---|---|---|
| 工业化水平 | 工业增加值占GDP的比重 | 正 |
| 重工业水平 | 重工业增加值占工业增加值的比重 | 负 |
| 对外开放程度 | 外商投资总额占总投资额的比重 | 正 |
| 科技创新 | 工业R&D经费支出占总支出的比重 | 正 |
| 能源消耗强度 | 工业耗电总量与GDP的比值 | 负 |
| 能源消费结构 | 煤炭类能源消耗占工业能源消耗总量比重 | 负 |
| 生产力水平 | 工业全员劳动生产率 | 正 |
表2 京津冀地区工业碳排放效率评价指标体系Tab.2 Evaluation index system of industrial carbon emission efficiency |
| 指标类型 | 一级指标 | 二级指标 |
|---|---|---|
| 投入指标 | 经济要素投入 | 工业资本存量 |
| 劳动力投入 | 工业从业人员 | |
| 能源要素投入 | 工业电力消耗 | |
| 产出指标 | 期望产出 | 工业增加值 |
| 非期望产出 | 工业碳排放量 |
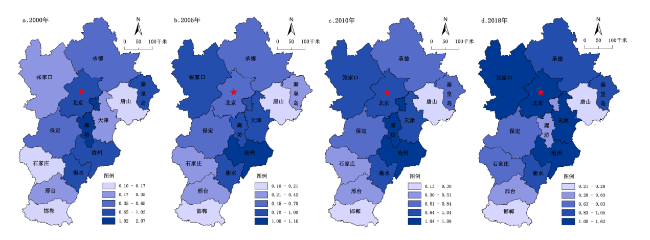
表3 2000—2018年京津冀地区各城市工业碳排放效率Tab.3 Industrial carbon emission efficiency of cities in Beijing-Tianjin-Hebei region from 2000 to 2018 |
| 城市 | 2000 | 2005 | 2010 | 2018 | 均值 | 年均变化率(%) |
|---|---|---|---|---|---|---|
| 北京 | 1.02 | 0.70 | 1.00 | 1.44 | 1.12 | 2.05 |
| 天津 | 0.25 | 1.00 | 1.01 | 1.62 | 1.04 | 11.50 |
| 石家庄 | 0.10 | 0.45 | 0.51 | 0.83 | 0.50 | 12.96 |
| 承德 | 0.63 | 0.87 | 0.73 | 1.05 | 0.82 | 2.99 |
| 邢台 | 0.35 | 0.39 | 0.68 | 0.63 | 0.48 | 3.44 |
| 秦皇岛 | 1.00 | 0.45 | 0.84 | 0.96 | 0.85 | -0.26 |
| 沧州 | 1.00 | 1.16 | 1.00 | 1.43 | 1.23 | 2.13 |
| 邯郸 | 0.17 | 0.21 | 0.30 | 0.28 | 0.26 | 2.82 |
| 张家口 | 0.34 | 0.95 | 1.00 | 1.33 | 0.93 | 8.27 |
| 保定 | 0.65 | 0.78 | 0.72 | 0.78 | 0.71 | 1.05 |
| 廊坊 | 2.07 | 1.00 | 1.07 | 0.50 | 1.11 | -7.97 |
| 衡水 | 1.10 | 1.00 | 1.04 | 1.06 | 1.03 | 0.33 |
| 唐山 | 0.11 | 0.10 | 0.13 | 0.21 | 0.15 | 3.75 |
| 平均值 | 0.67 | 0.68 | 0.76 | 0.89 | 0.93 | 1.95 |
| 标准差 | 0.28 | 0.10 | 0.09 | 0.19 | - | - |
表4 2000、2018年京津冀地区工业碳排放效率的影响因素分析Tab.4 Analysis of factors affecting industrial carbon emission efficiency in Beijing-Tianjin-Hebei region in 2000 and 2018 |
| 指标 | 2000 | 2018 | |||
|---|---|---|---|---|---|
| 系数 | Z值 | 系数 | Z值 | ||
| 工业化水平 | -0.0390*** | -2.6787 | 0.3150 | 3.6135 | |
| 重工业水平 | 0.0006 | 0.2081 | -0.0877* | -1.9892 | |
| 工业研发投入 | 0.1456* | 1.3325 | 0.8238* | 3.0358 | |
| 对外开放水平 | 0.0311*** | 4.3683 | 0.4169** | 1.0921 | |
| 能源消耗强度 | -1.8060*** | -6.4746 | -1.4012* | -5.3160 | |
| 能源消费结构 | 0.0057 | 0.2353 | -0.0414** | 0.2801 | |
| 生产力水平 | 0.6098*** | -1.0173 | 1.4056* | -4.5411 | |
| R2 | 0.9276 | 0.6957 | |||
注:*、**、***分别代表10%、5%、1%水平下显著。 |
| [1] |
彭林. 中国工业企业碳排放效率空间计量分析[D]. 镇江: 江苏大学, 2019.
|
| [2] |
苑清敏, 张宝荣, 李健. 京津冀地区工业碳排放影响因素的门限效应分析[J]. 环境科学与技术, 2019, 42(11):213-221.
|
| [3] |
|
| [4] |
|
| [5] |
|
| [6] |
潘家华, 张丽峰. 我国碳生产率区域差异性研究[J]. 中国工业经济, 2011(5):47-57.
|
| [7] |
|
| [8] |
董锋, 徐喜辉, 龙如银, 等. 我国碳排放区域差异性分析[J]. 长江流域资源与环境, 2014(11):1526-1533.
|
| [9] |
马大来, 陈仲常, 王玲. 中国省际碳排放效率的空间计量[J]. 中国人口·资源与环境, 2015, 25(1):67-77.
|
| [10] |
王兆峰, 杜瑶瑶. 基于SBM-DEA模型湖南省碳排放效率时空差异及影响因素分析[J]. 地理科学, 2019, 39(5):797-806.
|
| [11] |
蒋姝睿, 谭雪, 石磊, 等. 京津冀大气污染传输通道城市的工业大气污染排放效率分析——基于三阶段DEA方法[J]. 干旱区资源与环境, 2019, 33(6):141-149.
|
| [12] |
路正南, 王志城. 我国工业碳排放效率的行业差异及动态演进研究[J]. 科技管理研究, 2015(6):230-235.
|
| [13] |
曲晨瑶. 中国制造业行业碳排放效率及其影响因素[J]. 科技管理研究, 2017(8):60-68.
|
| [14] |
相天东. 我国区域碳排放效率与全要素生产率研究——基于三阶段DEA模型[J]. 经济经纬, 2017, 34(1):20-25.
|
| [15] |
蒋自然, 金环环, 王成金, 等. 长江经济带交通碳排放测度及其效率格局(1985—2016年)[J]. 环境科学, 2020, 41(6):2972-2980.
|
| [16] |
|
| [17] |
|
| [18] |
|
| [19] |
杨思涵, 佟孟华, 刘睿婕, 等. 异质性工业企业碳减排状态与路径的比较[J]. 中国环境科学, 2019, 39(6):2678-2688.
|
| [20] |
周迪, 吴泽文. 中国工业碳减排潜力与路径研究[J]. 中国环境科学, 2019, 39(3):1306-1314.
|
| [21] |
姜国刚, 阮婉妮, 郭铁军. 基于三阶段DEA的江苏石化产业碳排放效率分析[J]. 环境科学与技术, 2019, 42(3):172-179.
|
| [22] |
武振华. 我国化工行业碳排放效率、影响因素及碳配额分配研究[D]. 天津: 天津大学, 2018.
|
| [23] |
蒋毅一, 彭林, 赵爽, 等. 基于空间计量的中国省域火电行业碳排放效率分析[J]. 山东财经大学学报, 2019, 31(2):31-42,83.
|
| [24] |
袁长伟, 赵潇, 孙璐. 中国交通运输碳排放效率测度及收敛性研究[J]. 环境科学与技术, 2019, 42(12):222-229.
|
| [25] |
王建民, 蒋倩颖, 张敏. 等. 皖江城市带承接产业转移示范区低碳发展效应分析[J]. 地域研究与开发, 2019, 38(2):50-54,85.
|
| [26] |
谢志祥, 秦耀辰, 沈威, 等. 中国低碳经济发展绩效评价及影响因素[J]. 经济地理, 2017, 37(3):1-9.
|
| [27] |
|
| [28] |
|
| [29] |
王少剑, 苏泳娴, 赵亚博. 中国城市能源消费碳排放的区域差异、空间溢出效应及影响因素[J]. 地理学报, 2018, 73(3):414-428.
|
| [30] |
蔺雪芹, 郭一鸣, 王岱. 中国工业资源环境效率空间演化特征及影响因素[J]. 地理科学, 2019, 39(3):377-386.
|
| [31] |
|
| [32] |
|
| [33] |
朱传耿, 张纯敏, 仇方道, 等. 基于低碳经济的徐州都市圈工业结构转型与布局优化[J]. 经济地理, 2017, 37(10):126-135.
|
| [34] |
冯冬, 李健. 京津冀区域城市碳排放效率及减排潜力研究[J]. 资源科学, 2017, 39(5):978-986.
|
| [35] |
王烨, 顾圣平. 2006—2015年中国电力碳足迹及其生态压力分析[J]. 环境科学学报, 2018, 38(12):4873-4878.
|
| [36] |
郭腾云, 徐勇, 王志强. 基于DEA的中国特大城市资源效率及其变化[J]. 地理学报, 2009, 64(4):408-416.
|
| [37] |
蒋晶晶, 叶斌, 计军平, 等. 中国碳强度下降和碳排放增长的行业贡献分解研究[J]. 环境科学, 2014, 35(11):4378-4386.
|
| [38] |
孙丽文, 韩莹, 杜娟. 京津冀高能耗产业碳足迹的影响因素——基于de Bruyn模型[J]. 技术经济, 2019, 38(8):86-92,118.
|
| [39] |
李健, 马晓芳, 苑清敏. 区域碳排放效率评价及影响因素分析[J]. 环境科学学报, 2019, 39(12):4293-4300.
|
/
| 〈 |
|
〉 |
