
中国县域普惠金融的时空格局及影响因素
|
林春(1985—),男,辽宁黑山人,博士,副教授,硕士生导师,研究方向为金融发展理论与政策。E-mail:253422833@qq.com |
收稿日期: 2020-03-14
修回日期: 2021-02-15
网络出版日期: 2025-04-08
基金资助
辽宁省教育厅高等学校青年科技人才“育苗”项目(LQN202031)
国家社会科学基金一般项目(19BJL089)
国家社会科学基金重大项目(17ZDA060)
Spatial-temporal Pattern of Inclusive Finance and Its Influencing Factors in China's Counties
Received date: 2020-03-14
Revised date: 2021-02-15
Online published: 2025-04-08
林春 , 谭学通 . 中国县域普惠金融的时空格局及影响因素[J]. 经济地理, 2021 , 41(6) : 126 -135 . DOI: 10.15957/j.cnki.jjdl.2021.06.014
The balanced development of inclusive finance at the county level is a vital link to promote the implementation of national financial strategies. Based on this,this paper uses the data of 1972 counties in China from 2007 to 2017 to examine the spatial-temporal pattern,evolution trend,and influencing factors of inclusive financial development in counties. The results show that: 1) The overall level of inclusive finance in China's counties is relatively low and presents a steady upward trend. 2) The level of inclusive finance development in counties has significant and widening regional disparities over time, and has significant spatial positive autocorrelation,and the hot spots are mainly concentrated in the eastern coast and the Chengdu-Chongqing urban agglomeration. 3) The evolutionary trend of the level of inclusive financial development in counties has significant "club convergence" and "Matthew effect",while inclusive financial development in high-level counties has the most effective spatial spillover effect. 4) Nationally, public fiscal expenditure and fixed asset investment have a significant positive relationship with the development of inclusive finance in and around the region. As far as the region (the east,the middle,and the west) is concerned,the influencing factors are obviously different. Finally,based on empirical conclusions,relevant policy enlightenments are drawn.
表1 县域普惠金融指标体系构建Tab.1 Index system construction of inclusive finance at the county level |
| 维度 | 指标 |
|---|---|
| 普惠金融渗透性 | 百平方公里营业网点数(个/100 km2) |
| 万人银行营业网点数(个/万人) | |
| 普惠金融可得性 | 千人储蓄存款额(万元/千人) |
| 千人贷款额(万元/千人) | |
| 普惠金融效用性 | 储蓄存款总额/GDP |
| 贷款总额/GDP |
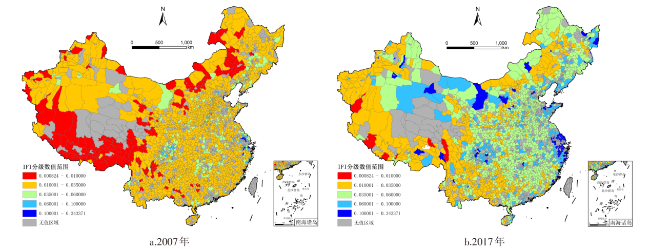
图1 2007、2017年中国县域普惠金融指数分级分布注:该图基于国家自然资源部标准地图(审图号为GS(2016)2923号)绘制,底图无修改,下同。 Fig.1 Distribution of inclusive finance in China's counties in 2007 and 2017 |
表2 2007—2017年中国县域普惠金融的空间自相关指数Tab.2 Spatial autocorrelation index of inclusive finance in China's counties from 2007 to 2017 |
| 年份 | 2007 | 2008 | 2009 | 2010 | 2011 | 2012 | 2013 | 2014 | 2015 | 2016 | 2017 |
|---|---|---|---|---|---|---|---|---|---|---|---|
| Moran's I | 0.484 | 0.542 | 0.562 | 0.493 | 0.598 | 0.595 | 0.589 | 0.583 | 0.493 | 0.569 | 0.498 |
| Geary's C | 0.493 | 0.435 | 0.416 | 0.495 | 0.377 | 0.373 | 0.374 | 0.380 | 0.465 | 0.469 | 0.474 |
表3 中国县域普惠金融发展水平的空间马尔可夫转移概率矩阵Tab.3 Spatial Markov transition probability matrix of the development level of inclusive finance in China's counties |
| 滞后类型 | ti /ti+1 | n | L<70% | 70%<ML<100% | 100%<MH<130% | H>130% |
|---|---|---|---|---|---|---|
| 低水平邻居 | L<70% | 1 500 | 0.9287 | 0.0633 | 0.0073 | 0.0007 |
| 70%<ML<100% | 1 155 | 0.0944 | 0.8225 | 0.0511 | 0.0320 | |
| 100%<MH<130% | 776 | 0.0013 | 0.1314 | 0.7990 | 0.0683 | |
| H>130% | 743 | 0.0013 | 0.0323 | 0.0942 | 0.8721 | |
| 中低水平邻居 | L<70% | 2 441 | 0.9267 | 0.0660 | 0.0033 | 0.0041 |
| 70%<ML<100% | 2 269 | 0.0661 | 0.8625 | 0.0511 | 0.0203 | |
| 100%<MH<130% | 1 391 | 0.0022 | 0.1316 | 0.8016 | 0.0647 | |
| H>130% | 1 318 | 0.0068 | 0.0379 | 0.1055 | 0.8498 | |
| 中高水平邻居 | L<70% | 1 431 | 0.9161 | 0.0748 | 0.0063 | 0.0028 |
| 70%<ML<100% | 1 553 | 0.0702 | 0.8577 | 0.0560 | 0.0161 | |
| 100%<MH<130% | 899 | 0.0022 | 0.1279 | 0.7998 | 0.0701 | |
| H>130% | 809 | 0.0037 | 0.0433 | 0.1112 | 0.8418 | |
| 高水平邻居 | L<70% | 1 018 | 0.9008 | 0.0855 | 0.0118 | 0.0020 |
| 70%<ML<100% | 989 | 0.0900 | 0.8109 | 0.0809 | 0.0182 | |
| 100%<MH<130% | 745 | 0.0040 | 0.1477 | 0.7570 | 0.0913 | |
| H>130% | 683 | 0.0015 | 0.0190 | 0.1054 | 0.8741 |
表4 全国及地区空间计量回归结果Tab.4 Results of national and regional spatial measurement regression |
| 变量 | 全国 | 东部 | 中部 | 西部 |
|---|---|---|---|---|
| pfr | 0.0807***(16.45) | 0.0617***(9.36) | 0.0454***(5.24) | 0.1521***(10.87) |
| pfe | 0.1148***(20.05) | 0.1692***(19.20) | 0.0228**(2.34) | 0.0006(0.06) |
| oms | 0.0108(1.21) | 0.0416***(3.68) | -0.0126**(-2.20) | -0.0427***(-4.55) |
| fln | -0.0400***(-12.16) | -0.0552***(-10.36) | -0.0030(-0.50) | -0.0135(-1.28) |
| fai | 0.0255***(6.87) | 0.0218***(4.64) | 0.0247***(2.81) | 0.0491***(5.18) |
| avsi | 0.0912***(7.53) | 0.1888***(9.36) | -0.0270*(-1.77) | 0.0475***(3.12) |
| giov | 0.0482***(4.39) | 0.0029(0.18) | 0.0384***(3.50) | 0.0072(0.42) |
| W·pfr | -0.0428***(-4.33) | -0.0390***(-3.18) | -0.0296*(-1.72) | 0.0678**(2.54) |
| W·pfe | 0.2301***(22.60) | 0.1291***(7.83) | 0.3349***(21.44) | 0.2455***(16.61) |
| W·oms | -0.0162(-0.80) | 0.0079(0.33) | 0.0095(0.87) | -0.0536***(-2.76) |
| W·fln | -0.0168**(-2.32) | -0.0234***(-2.75) | -0.0064(-0.53) | 0.0953***(4.56) |
| W·fai | 0.0550***(7.28) | 0.0087(1.00) | 0.1087***(6.14) | 0.0544***(2.86) |
| W·avsi | -0.1481***(-6.18) | -0.0300(-0.83) | 0.1384***(-4.92) | -0.1009***(-3.28) |
| W·giov | -0.0891***(-3.75) | 0.0533*(1.75) | -0.1125***(-5.06) | -0.0674*(-1.87) |
| 0.0425***(4.27) | 0.0319***(7.20) | 0.1538***(9.18) | 0.1082*(1.75) | |
| N | 21 692 | 5 808 | 6 611 | 9 273 |
| R2 | 0.433 | 0.576 | 0.241 | 0.200 |
注:*、**、***分别代表10%、5%和1%显著性水平,括号内为t统计量。 |
| [1] |
焦瑾璞, 杨骏. 小额信贷和农村金融[M]. 北京: 中国金融出版社, 2006.
|
| [2] |
|
| [3] |
郭田勇, 丁潇. 普惠金融的国际比较研究——基于银行服务的视角[J]. 国际金融研究, 2015(2):55-64.
|
| [4] |
林春, 孙英杰, 康宽. 普惠金融对中国产业就业的影响效应——基于总量和结构视角[J]. 证券市场导报, 2019(6):13-19,30.
|
| [5] |
星焱. 普惠金融:一个基本理论框架[J]. 国际金融研究, 2016(9):21-37.
|
| [6] |
邢乐成, 赵建. 多维视角下的中国普惠金融:概念梳理与理论框架[J]. 清华大学学报:哲学社会科学版, 2019(1):164-172,198.
|
| [7] |
王花毅. 乡村振兴战略背景下农村普惠金融发展对策研究[J]. 农业经济, 2018(12):94-95.
|
| [8] |
王国刚. 从金融功能看融资、普惠和服务“三农”[J]. 中国农村经济, 2018(3):2-14.
|
| [9] |
何广文, 何婧, 郭沛. 再议农户信贷需求及其信贷可得性[J]. 农业经济问题, 2018(2):38-49.
|
| [10] |
石宝峰, 王静, 迟国泰. 普惠金融、银行信贷与商户小额贷款融资——基于风险等级匹配视角[J]. 中国管理科学, 2017(9):28-36.
|
| [11] |
刘亦文, 丁李平, 李毅, 等. 中国普惠金融发展水平测度与经济增长效应[J]. 中国软科学, 2018(3):36-46.
|
| [12] |
王伟, 朱一鸣. 普惠金融与县域资金外流:减贫还是致贫——基于中国592个国家级贫困县的研究[J]. 经济理论与经济管理, 2018(1):98-108.
|
| [13] |
黄倩, 李政. 县域普惠金融发展与经济包容性增长——基于云南省120个县域数据的实证分析[J]. 云南财经大学学报, 2019(1):52-66.
|
| [14] |
李建军, 韩珣. 普惠金融、收入分配和贫困减缓——推进效率和公平的政策框架选择[J]. 金融研究, 2019(3):129-148.
|
| [15] |
杨军, 张龙耀, 马倩倩, 等. 县域普惠金融发展评价体系研究——基于江苏省52个县域数据[J]. 农业经济问题, 2016(11):24-31,110.
|
| [16] |
蒋天颖, 张超, 孙平, 等. 浙江省县域金融创新空间分异及驱动因素[J]. 经济地理, 2019, 39(4):146-154.
|
| [17] |
李建军, 卢盼盼. 中国居民金融服务包容性测度与空间差异[J]. 经济地理, 2016, 36(3):118-124.
|
| [18] |
王雪, 何广文. 县域银行业竞争与普惠金融服务深化——贫困县与非贫困县的分层解析[J]. 中国农村经济, 2019(4):55-72.
|
| [19] |
段瑞君. 技术进步、技术效率与产业结构升级——基于中国285个城市的空间计量检验[J]. 研究与发展管理, 2018(6):106-116.
|
| [20] |
|
| [21] |
|
| [22] |
龙小宁, 朱艳丽, 蔡伟贤, 等. 基于空间计量模型的中国县级政府间税收竞争的实证分析[J]. 经济研究, 2014, 49(8):41-53.
|
| [23] |
吴雨, 宋全云, 尹志超. 农户正规信贷获得和信贷渠道偏好分析——基于金融知识水平和受教育水平视角的解释[J]. 中国农村经济, 2016(5):43-55.
|
| [24] |
|
| [25] |
逯进, 王晓飞. 固定资产投资、老龄化与经济活力——基于省域视角研究[J]. 人口学刊, 2019, 41(5):57-71.
|
/
| 〈 |
|
〉 |