
中国保险业发展的时空分异特征及动态演变
|
田小文(1981—),男,湖南邵阳人,博士,讲师,硕士生导师,研究方向为区域经济、企业管理。E-mail:chibit_tian@126.com |
收稿日期: 2021-05-09
修回日期: 2021-08-22
网络出版日期: 2025-04-01
基金资助
国家社会科学基金青年项目(18CJL043)
教育部人文社会科学基金青年项目(17YJC790178)
湖南省自然科学基金项目(2018JJ3258)
湖南省社会科学基金一般项目(16YBQ040)
湖南省社会科学评审委员会一般项目(XSP18YBZ122)
湖南省教育厅优秀青年科研项目(18B328)
Spatial-temporal Differentiation Characteristic and Dynamic Evolution of China's Insurance Industry
Received date: 2021-05-09
Revised date: 2021-08-22
Online published: 2025-04-01
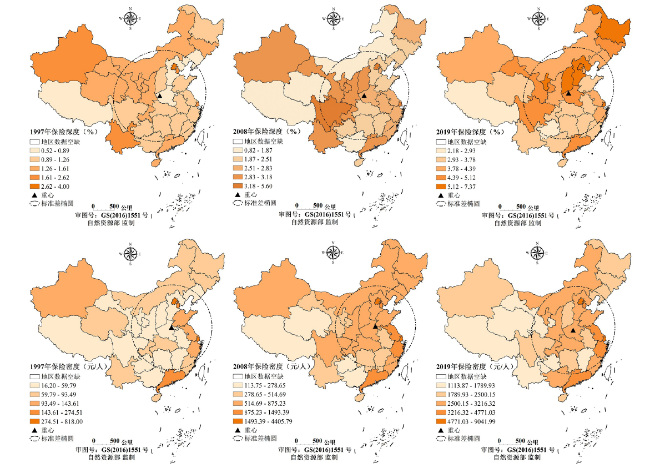
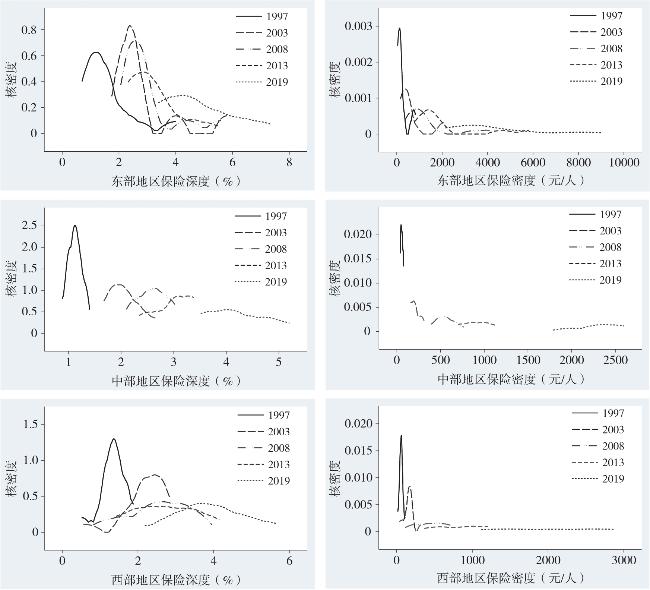
基于中国大陆1997—2019年的省级面板数据,从时间维度和空间视角对中国保险业发展水平的时空分异特征及动态演变过程进行测度。借助地理信息系统(GIS)的可视化表明,保险业发展水平呈现明显的阶段性特征和“东高西低”的空间非均衡特征。从保险业发展水平的Dagum基尼系数分解来看,中国保险业发展水平的总体差距呈下降趋势,保险业发展水平的地区间差异明显大于地区内的差异,地区间差距是造成保险业发展水平空间分异的主要成因。在Kernel密度估计方面,相较于保险深度,保险密度的区域内部差异明显较大,并且中、西部地区内部的差异较东部地区更为凸显。因此,基于我国保险业发展水平具有地域分异规律,应充分重视省际空间动态关联,提出促进保险业全域提升的对策建议。
田小文 , 郑理 , 徐雷 . 中国保险业发展的时空分异特征及动态演变[J]. 经济地理, 2021 , 41(9) : 135 -144 . DOI: 10.15957/j.cnki.jjdl.2021.09.014
Based on provincial panel data from 1997 to 2019 in China,this study analyzes the spatial-temporal characteristics and the dynamic evolution of China's insurance industry development level. It indicates that the development level of insurance industry presents the characteristics of obvious stage and spatial imbalance,the development level of insurance industry is higher in eastern China than the western China. According to the Dagum coefficient decomposition of the insurance industry development level,although its overall disparity is declining,its regional differences are significantly greater than the inter-regional differences,the regional differences are the main cause of spatial differences in the development level of the insurance industry. By the means of Kernel density estimation,it's found that,compared with insurance depth,the inter-regional differences of insurance density are significantly larger,and the internal differences between the central and western regions are more prominent than those in the eastern region. Therefore,based on the law of regional differentiation of the China's insurance industry development,suggestions should be put forward for promoting the insurance industry in the whole field with the attention to the provincial spatial dynamic association.
表1 保险深度的基尼系数及其分解结果Tab.1 Gini coefficient of insurance depth and its decomposition results |
| 年份 | G | 地区内差距 | 地区间差距 | 贡献率(%) | ||||||||
|---|---|---|---|---|---|---|---|---|---|---|---|---|
| 东部 | 中部 | 西部 | 东—中 | 东—西 | 中—西 | 地区内 | 地区间 | 超变密度 | ||||
| 1997 | 0.2052 | 0.2832 | 0.0724 | 0.1408 | 0.2418 | 0.2365 | 0.1453 | 32.15 | 36.05 | 31.80 | ||
| 1998 | 0.1907 | 0.2648 | 0.0716 | 0.1172 | 0.2235 | 0.2204 | 0.1496 | 31.01 | 33.54 | 35.45 | ||
| 1999 | 0.1887 | 0.2588 | 0.0637 | 0.1254 | 0.2185 | 0.2185 | 0.1453 | 31.35 | 34.37 | 34.28 | ||
| 2000 | 0.1728 | 0.2421 | 0.0652 | 0.1174 | 0.1956 | 0.2045 | 0.1234 | 32.08 | 34.51 | 33.41 | ||
| 2001 | 0.1698 | 0.2225 | 0.0780 | 0.1231 | 0.1972 | 0.1954 | 0.1230 | 32.11 | 39.85 | 28.04 | ||
| 2002 | 0.1516 | 0.1757 | 0.0790 | 0.1220 | 0.1784 | 0.1688 | 0.1219 | 31.40 | 46.30 | 22.30 | ||
| 2003 | 0.1581 | 0.1854 | 0.0810 | 0.1353 | 0.1761 | 0.1804 | 0.1236 | 32.18 | 42.77 | 25.05 | ||
| 2004 | 0.1673 | 0.1921 | 0.0733 | 0.1541 | 0.1793 | 0.1946 | 0.1305 | 32.32 | 42.70 | 24.98 | ||
| 2005 | 0.1631 | 0.1895 | 0.0616 | 0.1656 | 0.1532 | 0.1975 | 0.1316 | 33.03 | 33.35 | 33.62 | ||
| 2006 | 0.1663 | 0.1808 | 0.0612 | 0.1865 | 0.1411 | 0.2050 | 0.1435 | 33.13 | 29.09 | 37.78 | ||
| 2007 | 0.1605 | 0.1690 | 0.0631 | 0.1841 | 0.1334 | 0.1977 | 0.1421 | 33.13 | 29.00 | 37.87 | ||
| 2008 | 0.1542 | 0.1588 | 0.0633 | 0.1800 | 0.1278 | 0.1877 | 0.1387 | 33.27 | 28.36 | 38.36 | ||
| 2009 | 0.1525 | 0.1554 | 0.0670 | 0.1797 | 0.1258 | 0.1848 | 0.1378 | 33.44 | 26.25 | 40.31 | ||
| 2010 | 0.1476 | 0.1433 | 0.0695 | 0.1789 | 0.1201 | 0.1781 | 0.1373 | 33.32 | 28.18 | 38.50 | ||
| 2011 | 0.1431 | 0.1349 | 0.0698 | 0.1762 | 0.1150 | 0.1713 | 0.1385 | 33.08 | 26.53 | 40.39 | ||
| 2012 | 0.1471 | 0.1432 | 0.0660 | 0.1786 | 0.1184 | 0.1776 | 0.1413 | 32.94 | 27.30 | 39.76 | ||
| 2013 | 0.1453 | 0.1446 | 0.0663 | 0.1720 | 0.1196 | 0.1748 | 0.1377 | 32.91 | 27.39 | 39.70 | ||
| 2014 | 0.1402 | 0.1450 | 0.0710 | 0.1589 | 0.1197 | 0.1664 | 0.1305 | 33.09 | 25.96 | 40.95 | ||
| 2015 | 0.1394 | 0.1526 | 0.0821 | 0.1429 | 0.1292 | 0.1636 | 0.1224 | 33.06 | 30.02 | 36.92 | ||
| 2016 | 0.1383 | 0.1516 | 0.0744 | 0.1351 | 0.1342 | 0.1667 | 0.1145 | 32.25 | 36.46 | 31.29 | ||
| 2017 | 0.1333 | 0.1524 | 0.0765 | 0.1256 | 0.1332 | 0.1582 | 0.1078 | 32.64 | 33.19 | 34.17 | ||
| 2018 | 0.1329 | 0.1510 | 0.0749 | 0.1266 | 0.1314 | 0.1582 | 0.1082 | 32.60 | 33.75 | 33.65 | ||
| 2019 | 0.1323 | 0.1467 | 0.0773 | 0.1314 | 0.1276 | 0.1566 | 0.1105 | 32.91 | 33.29 | 33.80 | ||
表2 保险密度的基尼系数及其分解结果Tab.2 Gini coefficient of insurance density and its decomposition results |
| 年份 | G | 地区内差距 | 地区间差距 | 贡献率(%) | ||||||||
|---|---|---|---|---|---|---|---|---|---|---|---|---|
| 东部 | 中部 | 西部 | 东—中 | 东—西 | 中—西 | 地区内 | 地区间 | 超变密度 | ||||
| 1997 | 0.5064 | 0.5015 | 0.1303 | 0.2107 | 0.6287 | 0.6224 | 0.1791 | 28.11 | 66.68 | 5.2 | ||
| 1998 | 0.4919 | 0.4749 | 0.1257 | 0.1924 | 0.6102 | 0.6176 | 0.1665 | 27.31 | 68.76 | 3.9 | ||
| 1999 | 0.4837 | 0.4672 | 0.1408 | 0.1772 | 0.5963 | 0.6137 | 0.1683 | 27.10 | 69.10 | 3.8 | ||
| 2000 | 0.4813 | 0.4634 | 0.1376 | 0.1844 | 0.5970 | 0.6081 | 0.1732 | 27.08 | 68.55 | 4.4 | ||
| 2001 | 0.5149 | 0.4845 | 0.1355 | 0.1922 | 0.6305 | 0.6488 | 0.1760 | 27.00 | 69.67 | 3.3 | ||
| 2002 | 0.4960 | 0.4590 | 0.1498 | 0.2145 | 0.5886 | 0.6397 | 0.2002 | 26.70 | 70.04 | 3.3 | ||
| 2003 | 0.4776 | 0.4467 | 0.1365 | 0.2153 | 0.5540 | 0.6278 | 0.1987 | 26.69 | 70.70 | 2.6 | ||
| 2004 | 0.4805 | 0.4451 | 0.1266 | 0.2224 | 0.5527 | 0.6351 | 0.2066 | 26.48 | 70.97 | 2.6 | ||
| 2005 | 0.4849 | 0.4343 | 0.1468 | 0.2354 | 0.5537 | 0.6444 | 0.2265 | 26.03 | 71.01 | 3.0 | ||
| 2006 | 0.4637 | 0.4234 | 0.1254 | 0.2620 | 0.5284 | 0.6143 | 0.2242 | 26.51 | 69.58 | 3.9 | ||
| 2007 | 0.4421 | 0.4105 | 0.1201 | 0.2722 | 0.5030 | 0.5809 | 0.2274 | 26.96 | 68.24 | 4.8 | ||
| 2008 | 0.4110 | 0.3967 | 0.1109 | 0.2450 | 0.4642 | 0.5481 | 0.2034 | 27.22 | 68.26 | 4.5 | ||
| 2009 | 0.4004 | 0.3907 | 0.1132 | 0.2362 | 0.4581 | 0.5301 | 0.1988 | 27.35 | 67.43 | 5.2 | ||
| 2010 | 0.3742 | 0.3674 | 0.0855 | 0.2191 | 0.4319 | 0.5023 | 0.1818 | 26.97 | 68.41 | 4.6 | ||
| 2011 | 0.3589 | 0.3550 | 0.0982 | 0.2178 | 0.4226 | 0.4719 | 0.1814 | 27.37 | 66.45 | 6.2 | ||
| 2012 | 0.3535 | 0.3559 | 0.1000 | 0.2039 | 0.4258 | 0.4588 | 0.1758 | 27.50 | 65.76 | 6.7 | ||
| 2013 | 0.3329 | 0.3423 | 0.0949 | 0.1918 | 0.4077 | 0.4297 | 0.1636 | 27.71 | 64.56 | 7.7 | ||
| 2014 | 0.3214 | 0.3322 | 0.0850 | 0.1863 | 0.3852 | 0.4256 | 0.1536 | 27.54 | 66.08 | 6.4 | ||
| 2015 | 0.3085 | 0.3102 | 0.0907 | 0.1866 | 0.3649 | 0.4132 | 0.1557 | 27.19 | 66.77 | 6.0 | ||
| 2016 | 0.2994 | 0.2939 | 0.0812 | 0.1810 | 0.3579 | 0.4063 | 0.1510 | 26.51 | 67.13 | 6.4 | ||
| 2017 | 0.2849 | 0.2844 | 0.0708 | 0.1712 | 0.3365 | 0.3922 | 0.1427 | 26.48 | 67.80 | 5.7 | ||
| 2018 | 0.2687 | 0.2698 | 0.0658 | 0.1676 | 0.3153 | 0.3706 | 0.1403 | 26.55 | 66.62 | 6.8 | ||
| 2019 | 0.2563 | 0.2533 | 0.0573 | 0.1601 | 0.3013 | 0.3589 | 0.1334 | 26.02 | 67.55 | 6.4 | ||
| [1] |
|
| [2] |
|
| [3] |
|
| [4] |
|
| [5] |
|
| [6] |
|
| [7] |
|
| [8] |
|
| [9] |
苏恒轩. 中国寿险业区域划分研究[J]. 武汉大学学报:哲学社会科学版: 2010(6):892-897.
|
| [10] |
吴祥佑. 我国省域保险业发展不平衡的实证研究:1997—2007年[J]. 数量经济技术经济研究, 2009(6):99-114.
|
| [11] |
武岩. 中国保险业成长与经济发展的关系检验——基于面板误差修正模型的分析[J]. 上海经济研究, 2013(5):37-44.
|
| [12] |
肖志光. 论我国保险市场区域均衡发展——基于保险需求的理论与实证[J]. 金融研究, 2007(6):181-191.
|
| [13] |
沈扬扬. 中国保险业区域不平衡发展研究——基于修正数据的研究[J]. 保险研究, 2012(3):12-23.
|
| [14] |
刘维林, 徐放. 中国保险产业区域分异的微观机理与实证分析[J]. 现代财经, 2012(11):41-49.
|
| [15] |
颜鹏飞, 陈蓉. 中国特色保险业改革的伟大实践——改革开放40年回顾与思考[J]. 财经问题研究, 2018(12):3-11.
|
| [16] |
俞颖, 苏慧琨, 李勇. 区域金融差异演进路径与机理[J]. 中国工业经济, 2017(4):74-93.
|
| [17] |
李恩龙, 杨永春, 史坤博, 等. 省域视角下中国保险业市场的时空特征[J]. 经济地理, 2017(5):116-124.
|
| [18] |
郑伟, 刘永东. 中国保险业区域发展比较研究——基于“保险基准深度比”的分析[J]. 经济科学, 2008, 37(5):96-109.
|
| [19] |
胡宏兵, 郭金龙, 田乾. 我国保险业区域发展路径和模式选择——基于情景模式分析法的实证研究[J]. 金融评论, 2011(3):59-69.
|
| [20] |
谭朵朵. 中国省域保险业发展影响因素的空间计量分析[J]. 统计与信息论坛, 2011(1):37-43.
|
| [21] |
胡宏兵, 田乾, 黄莹玉. 我国保险业区域发展协调度评价实证研究[J]. 宏观经济研究, 2012(5):47-55.
|
| [22] |
吴永钢, 李政. 我国保险业发展的经济增长效应:基于金融协同的视角[J]. 南开经济研究, 2013(4):82-94.
|
| [23] |
李春燕. 我国保险发展的空间非均衡及极化研究——基于1998-2010年产险与寿险的对比分析[J]. 财经论丛, 2013(2):64-70.
|
| [24] |
钟水映, 李强谊, 肖攀. 我国保险业发展水平的地区差异及其分布动态演进[J]. 保险研究, 2016(3):3-17
|
| [25] |
田乾, 金怀玉. 中国保险业发展的空间集聚效应分析[J]. 统计与决策, 2016(13):152-155
|
| [26] |
宋昌耀, 李国平, 李沅曦. 中国保险业的空间分异及其经济绩效——基于地级以上城市的分析[J]. 保险研究, 2019(9):30-43.
|
| [27] |
|
| [28] |
|
/
| 〈 |
|
〉 |