
长江中游城市群综合承载力评价与预测
|
周仪姜(1999—),女,湖南衡阳人,硕士研究生,研究方向为区域可持续发展、项目管理等。E-mail:254943632@qq.com |
收稿日期: 2021-03-27
修回日期: 2021-08-09
网络出版日期: 2025-04-01
基金资助
湖南省科技创新决策咨询暨软科学重点项目(2018ZK3003)
湖南大学哲学社会科学发展建设资金
Evaluation and Prediction of Comprehensive Carrying Capacity of Urban Agglomeration in the Middle Reaches of Yangtze River
Received date: 2021-03-27
Revised date: 2021-08-09
Online published: 2025-04-01
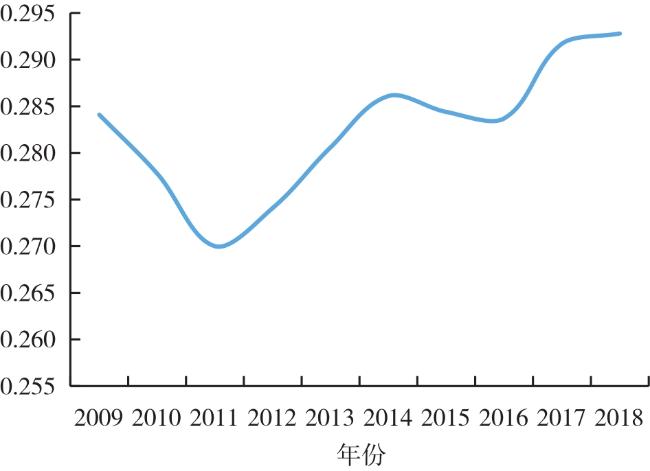
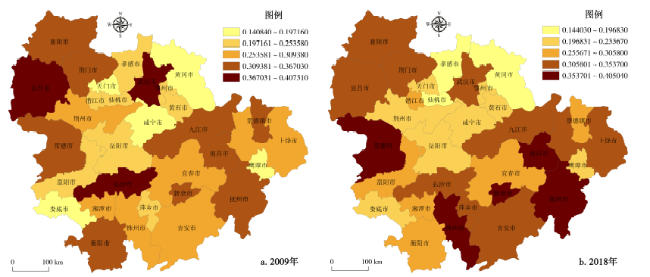
长江中游城市群地处我国中部要位,涵盖31个地级市。对长江中游城市群综合承载力进行研究,可以促进城市群可持续发展和构建各城市产业消费“双循环”,为有关部门提供决策参考。选取经济、资源、环境、基础设施、公共服务、人口和外贸承载力指标构建长江中游城市群综合承载力指标体系,运用全排列多边形图示指标法对其进行综合评价,并基于灰色GM模型对城市群各指标未来五年综合承载状况进行科学预测,最后有针对性地提出提升长江中游城市群综合承载力的政策建议。 结果表明:2009—2018年长江中游城市群城市综合承载力呈现“W”型变化;空间上差异明显,呈现出“中心城市高周边低”的格局;预测2019—2023年长江中游城市群城市综合承载力基本保持平稳增长,各城市群子系统承载力发展不尽相同。最后结合预测的结果,认为长江中游城市群的发展要从积极解决不同城市群综合承载力短板、加强不同城市群之间的协同作用从而提高整体城市群的综合承载能力,发挥其带动中部地区扩大内需以及外贸高质量发展的作用。
周仪姜 , 李林 . 长江中游城市群综合承载力评价与预测[J]. 经济地理, 2021 , 41(9) : 31 -39 . DOI: 10.15957/j.cnki.jjdl.2021.09.004
Urban agglomerations in the middle reaches of the Yangtze River are located in the central part of China,covering 31 prefecture-level cities. Research on the comprehensive carrying capacity of the urban agglomerations in the middle reaches of the Yangtze River can promote the sustainable development of urban agglomerations and build a "dual circulation" of industrial consumption in each city,providing reference for decision-making by relevant departments. This paper constructs the index system of comprehensive carrying capacity of urban agglomerations in the middle reaches of the Yangtze River which includes the economy,resources,environment,infrastructure,public services,population and foreign trade. It evaluates and predicts the comprehensive carrying capacity of urban agglomerations by the means of full arrangement comprehensive graphic method and the gray GM model,and puts forward targeted policy recommendations to improve the comprehensive carrying capacity of the urban agglomeration in the middle reaches of the Yangtze River. The results show that: 1) The comprehensive carrying capacity of cities in the middle reaches of the Yangtze River from 2009 to 2018 shows a W-shape change. 2) The spatial difference is obvious,which is higher in city center than surrounding areas. 3) It predicts that the comprehensive carrying capacity of cities keeps steady growth speed in the middle reaches of the Yangtze River from 2019 to 2023, but it has difference among the urban agglomerations. Finally,combined with the results of the forecast,it puts forward that the urban agglomeration development in the middle reaches of the Yangtze River should actively solve the shortcomings of the comprehensive carrying capacity of different urban agglomerations and strengthen the synergy between different urban agglomerations,in order to improve the overall carrying capacity of the overall urban agglomeration,expand the domestic demand and promote the high-quality development of foreign trade.
表1 城市综合承载力评价体系Tab.1 Evaluation system of urban comprehensive carrying capacity |
| 一级指标 | 二级指标 | 指标属性 | |
|---|---|---|---|
| 综合承载力A | 经济承载力A1 | GDP增速(%)B1 | 正 |
| 第三产业增加值占GDP比重(%)B2 | 正 | ||
| 第一产业增加值占GDP比重(%)B3 | 负 | ||
| 资源承载力A2 | 人均生活用水量(L)B4 | 负 | |
| 建成区面积(km2)B5 | 正 | ||
| 燃气普及率(%)B6 | 正 | ||
| 环境承载力A3 | 生活垃圾无害化处理率(%)B7 | 正 | |
| 污水处理厂集中处理率(%)B8 | 正 | ||
| 建成区绿地覆盖率(%)B9 | 正 | ||
| 基础设施承载力A4 | 人均绿地面积(m2)B10 | 正 | |
| 建成区供水管道密度(km/km2)B11 | 正 | ||
| 建成区排水管道密度(km/km2)B12 | 正 | ||
| 公共服务承载力A5 | 在岗人员平均工资(元)B13 | 正 | |
| 专利申请数(个)B14 | 正 | ||
| 医院、卫生院床位数(张)B15 | 正 | ||
| 人口承载力A6 | 人口自然增长率(%)B16 | 负 | |
| 人口密度(人/km2)B17 | 负 | ||
| 城镇人口比重(%)B18 | 正 | ||
| 外贸承载力A7 | 进口值(亿美元)B19 | 负 | |
| 出口值(亿美元)B20 | 正 | ||
| 实际利用外资(亿美元)B21 | 负 |
表2 长江中游城市群综合承载力评价结果Tab.2 Evaluation results of comprehensive carrying capacity of urban agglomerations in the middle reaches of the Yangtze River |
| 年份 | 2009 | 2010 | 2011 | 2012 | 2013 | 2014 | 2015 | 2016 | 2017 | 2018 |
|---|---|---|---|---|---|---|---|---|---|---|
| 经济承载力 | 0.2725 | 0.2633 | 0.2532 | 0.2481 | 0.2643 | 0.2501 | 0.2891 | 0.2799 | 0.3210 | 0.2916 |
| 资源承载力 | 0.2341 | 0.2366 | 0.2246 | 0.2303 | 0.2257 | 0.2312 | 0.2322 | 0.2353 | 0.2368 | 0.2484 |
| 环境承载力 | 0.3841 | 0.3881 | 0.3928 | 0.4075 | 0.4339 | 0.4212 | 0.4235 | 0.4447 | 0.4508 | 0.4459 |
| 基础设施承载力 | 0.2425 | 0.2433 | 0.2377 | 0.2291 | 0.2288 | 0.2200 | 0.2199 | 0.2176 | 0.2273 | 0.2287 |
| 公共服务承载力 | 0.2099 | 0.2052 | 0.1999 | 0.1985 | 0.2046 | 0.2089 | 0.2153 | 0.2175 | 0.2209 | 0.2249 |
| 人口承载力 | 0.2691 | 0.2362 | 0.2411 | 0.2297 | 0.2363 | 0.2439 | 0.2327 | 0.2420 | 0.2596 | 0.2524 |
| 外贸承载力 | 0.2962 | 0.2949 | 0.2928 | 0.2971 | 0.2979 | 0.2970 | 0.2975 | 0.2939 | 0.2954 | 0.2950 |
| 综合承载力 | 0.2841 | 0.2778 | 0.2700 | 0.2741 | 0.2806 | 0.2861 | 0.2844 | 0.2837 | 0.2917 | 0.2928 |
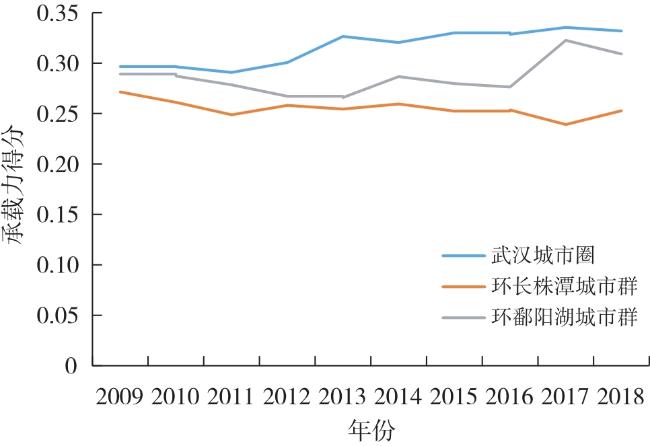
表3 三大城市群子系统综合承载力评价结果Tab.3 Evaluation results of comprehensive carrying capacity of the subsystems of three urban agglomerations in the middle reaches of the Yangtze River |
| 2009 | 2010 | 2011 | 2012 | 2013 | 2014 | 2015 | 2016 | 2017 | 2018 | ||
|---|---|---|---|---|---|---|---|---|---|---|---|
| 经济承载力 | 武汉城市圈 | 0.2714 | 0.2788 | 0.2914 | 0.1844 | 0.1979 | 0.1622 | 0.1532 | 0.1241 | 0.1326 | 0.1228 |
| 环长株潭城市群 | 0.3177 | 0.3033 | 0.2925 | 0.3257 | 0.3065 | 0.3246 | 0.3662 | 0.3152 | 0.3866 | 0.3834 | |
| 环鄱阳湖城市群 | 0.2285 | 0.2077 | 0.1757 | 0.2342 | 0.2884 | 0.2636 | 0.3478 | 0.4004 | 0.4438 | 0.3685 | |
| 资源承载力 | 武汉城市圈 | 0.2166 | 0.2144 | 0.1972 | 0.2251 | 0.2139 | 0.2473 | 0.2620 | 0.2780 | 0.2706 | 0.2850 |
| 环长株潭城市群 | 0.2565 | 0.2550 | 0.2383 | 0.2316 | 0.2247 | 0.2117 | 0.1996 | 0.1970 | 0.2084 | 0.2269 | |
| 环鄱阳湖城市群 | 0.2293 | 0.2403 | 0.2383 | 0.2341 | 0.2385 | 0.2345 | 0.2350 | 0.2308 | 0.2314 | 0.2332 | |
| 环境承载力 | 武汉城市圈 | 0.2371 | 0.1879 | 0.2116 | 0.2849 | 0.3228 | 0.2819 | 0.2991 | 0.3290 | 0.2869 | 0.3531 |
| 环长株潭城市群 | 0.2936 | 0.3092 | 0.3063 | 0.3001 | 0.3322 | 0.3347 | 0.3893 | 0.4225 | 0.4616 | 0.3992 | |
| 环鄱阳湖城市群 | 0.6215 | 0.6673 | 0.6604 | 0.6375 | 0.6466 | 0.6470 | 0.5822 | 0.5825 | 0.6039 | 0.5853 | |
| 基础设施承载力 | 武汉城市圈 | 0.2799 | 0.2659 | 0.2413 | 0.2396 | 0.2266 | 0.2106 | 0.2073 | 0.1992 | 0.2309 | 0.2149 |
| 环长株潭城市群 | 0.1486 | 0.1516 | 0.1527 | 0.1379 | 0.1446 | 0.1523 | 0.1550 | 0.1616 | 0.1715 | 0.1792 | |
| 环鄱阳湖城市群 | 0.2990 | 0.3125 | 0.3192 | 0.3097 | 0.3152 | 0.2971 | 0.2973 | 0.2920 | 0.2795 | 0.2921 | |
| 公共服务承载力 | 武汉城市圈 | 0.1787 | 0.1742 | 0.1563 | 0.1551 | 0.1534 | 0.1536 | 0.1545 | 0.1530 | 0.1517 | 0.1508 |
| 环长株潭城市群 | 0.3333 | 0.3301 | 0.3334 | 0.3232 | 0.3196 | 0.3206 | 0.3179 | 0.3169 | 0.3121 | 0.3198 | |
| 环鄱阳湖城市群 | 0.1176 | 0.1113 | 0.1101 | 0.1172 | 0.1408 | 0.1526 | 0.1736 | 0.1827 | 0.1989 | 0.2040 | |
| 人口承载力 | 武汉城市圈 | 0.2715 | 0.2769 | 0.2819 | 0.2758 | 0.2737 | 0.2777 | 0.2676 | 0.2724 | 0.2621 | 0.2660 |
| 环长株潭城市群 | 0.3131 | 0.2388 | 0.2478 | 0.2160 | 0.2335 | 0.2531 | 0.2285 | 0.2494 | 0.3127 | 0.2946 | |
| 环鄱阳湖城市群 | 0.2227 | 0.1929 | 0.1936 | 0.1974 | 0.2016 | 0.2009 | 0.2021 | 0.2042 | 0.2039 | 0.1966 | |
| 外贸承载力 | 武汉城市圈 | 0.3559 | 0.3186 | 0.3051 | 0.3188 | 0.3188 | 0.3140 | 0.3285 | 0.3244 | 0.3291 | 0.3315 |
| 环长株潭城市群 | 0.2276 | 0.2353 | 0.2308 | 0.2287 | 0.2278 | 0.2287 | 0.2265 | 0.2253 | 0.2272 | 0.2264 | |
| 环鄱阳湖城市群 | 0.3052 | 0.3309 | 0.3426 | 0.3437 | 0.3472 | 0.3483 | 0.3375 | 0.3320 | 0.3298 | 0.3270 |
表4 影响二级指标对一级指标及目标层的作用强弱Tab.4 Strength of the second-level indicators on the first-level indicators and the target level |
| Regression | Estimate | C.R. | C.R. | P | Regression | Estimate | C.R. | C.R. | P |
|---|---|---|---|---|---|---|---|---|---|
| B1→A1 | -0.005 | 0.003 | -2.072 | 0.038 | B15→A5 | 0.002 | 0.011 | 0.220 | 0.826 |
| B2→A1 | -0.000 | 0.002 | -0.102 | 0.919 | B16→A6 | 0.720 | 0.230 | 3.122 | 0.002 |
| B3→A1 | -0.005 | 0.002 | -2.647 | 0.008 | B17→A6 | -0.303 | 0.174 | -1.739 | 0.082 |
| B4→A2 | 0.154 | 0.128 | 1.202 | 0.229 | B18→A6 | 27.741 | 0.008 | 3 586.501 | *** |
| B5→A2 | -0.281 | 0.256 | -1.097 | 0.273 | B19→A7 | -0.375 | 0.030 | -12.472 | *** |
| B6→A2 | -0.103 | 0.118 | -0.873 | 0.382 | B20→A7 | -0.034 | 0.025 | -1.366 | 0.172 |
| B7→A3 | -5.887 | 0.131 | -44.949 | *** | B21→A7 | 0.172 | 0.062 | 2.795 | 0.005 |
| B8→A3 | 1.998 | 0.612 | 3.266 | *** | A1→A | -0.225 | 0.000 | -934.221 | *** |
| B9→A3 | -10.770 | 0.166 | -65.070 | *** | A2→A | -0.339 | 0.000 | -1 241.879 | *** |
| B10→A4 | -0.884 | 0.071 | -12.526 | *** | A3→A | 0.208 | 0.000 | 63 111.323 | *** |
| B11→A4 | 0.682 | 0.087 | 7.807 | *** | A4→A | -0.062 | 0.000 | -5 100.771 | *** |
| B12→A4 | 0.043 | 0.053 | 0.811 | 0.417 | A5→A | 0.103 | 0.000 | 9 174.577 | *** |
| B13→A5 | -0.003 | 0.003 | -1.044 | 0.296 | A6→A | -0.016 | 0.158 | -0.102 | 0.919 |
| B14→A5 | 0.003 | 0.005 | 0.532 | 0.595 | A7→A | -0.001 | 0.148 | -0.006 | 0.995 |
注:***表示回归结果通过显著性检验。表5同。 |
表5 影响二级指标之间相互作用强弱Tab.5 Strength of the interaction between the secondary indicators |
| Regression | Estimate | C.R. | C.R. | P | Regression | Estimate | C.R. | C.R. | P |
|---|---|---|---|---|---|---|---|---|---|
| B1↔B2 | -16.685 | 3.980 | -4.192 | *** | B13↔B14 | 7.940 | 0.008 | -0.000 | *** |
| B1↔B3 | 7.607 | 1.757 | 4.331 | *** | B13↔B15 | -0.932 | 0.008 | 1 015.071 | 0.262 |
| B2↔B3 | -12.087 | 2.877 | -4.201 | *** | B14↔B15 | -2.007 | 0.000 | -7 370.683 | 0.897 |
| B4↔B5 | -6.775 | 10.969 | -0.618 | 0.537 | B16↔B17 | 6.264 | 1.813 | 3.455 | *** |
| B4↔B6 | -7.175 | 1.879 | -3.818 | *** | B16↔B18 | -0.132 | 0.034 | -3.928 | *** |
| B5↔B6 | 2.887 | 2.348 | 1.229 | 0.219 | B17↔B18 | -0.055 | 0.024 | -2.264 | *** |
| B7↔B8 | 8.776 | 2.449 | 3.584 | *** | B19↔B20 | 9.392 | 2.331 | 4.029 | *** |
| B7↔B9 | -0.357 | 0.124 | -2.868 | 0.004 | B19↔B21 | 3.796 | 1.002 | 3.788 | *** |
| B8↔B9 | -0.019 | 0.438 | -0.044 | 0.965 | B20↔B21 | 12.200 | 2.846 | 4.286 | *** |
| B10↔B11 | 0.101 | 0.056 | 1.815 | 0.070 | |||||
| B10↔B12 | 0.187 | 0.050 | 3.757 | *** | |||||
| B11↔B12 | 0.239 | 0.061 | 2.929 | *** |
表6 2009—2018年三大城市群各系统承载力拟合结果Tab.6 Fitting results of the carrying capacity of each system in the middle reaches of the Yangtze River from 2009 to 2018 |
| 指标名称 | 城市群名称 | C | P |
|---|---|---|---|
| 经济承载力 | 武汉城市圈 | 0.0963 | 1 |
| 环长株潭城市群 | 0.3094 | 1 | |
| 环鄱阳湖城市群 | 0.1749 | 1 | |
| 资源承载力 | 武汉城市圈 | 0.1147 | 1 |
| 环长株潭城市群 | 0.3411 | 1 | |
| 环鄱阳湖城市群 | 0.2357 | 1 | |
| 环境承载力 | 武汉城市圈 | 0.3465 | 1 |
| 环长株潭城市群 | 0.1865 | 1 | |
| 环鄱阳湖城市群 | 0.2296 | 1 | |
| 基础设施承载力 | 武汉城市圈 | 0.2496 | 1 |
| 环长株潭城市群 | 0.3231 | 1 | |
| 环鄱阳湖城市群 | 0.2257 | 1 | |
| 公共服务承载力 | 武汉城市圈 | 0.2228 | 1 |
| 环长株潭城市群 | 0.2308 | 1 | |
| 环鄱阳湖城市群 | 0.0289 | 1 | |
| 人口承载力 | 武汉城市圈 | 0.3030 | 1 |
| 环长株潭城市群 | 0.3456 | 1 | |
| 环鄱阳湖城市群 | 0.1347 | 1 | |
| 外贸承载力 | 武汉城市圈 | 0.1276 | 1 |
| 环长株潭城市群 | 0.3099 | 1 | |
| 环鄱阳湖城市群 | 0.2638 | 1 | |
| 综合承载力 | 长江中游城市群 | 0.2042 | 1 |
表7 2019—2023年三大城市群各系统承载力预测值Tab.7 Predicted value of the carrying capacity of each system of three urban agglomerations in the middle reaches of the Yangtze River in 2019-2023 |
| 2019 | 2020 | 2021 | 2022 | 2023 | ||
|---|---|---|---|---|---|---|
| 经济承载力 | 武汉城市圈 | 0.0943 | 0.0834 | 0.0738 | 0.0654 | 0.0578 |
| 环长株潭城市群 | 0.3912 | 0.4041 | 0.4174 | 0.4312 | 0.4455 | |
| 环鄱阳湖城市群 | 0.4811 | 0.5306 | 0.5852 | 0.6455 | 0.7119 | |
| 资源承载力 | 武汉城市圈 | 0.3030 | 0.3170 | 0.3315 | 0.3468 | 0.3627 |
| 环长株潭城市群 | 0.1967 | 0.1922 | 0.1878 | 0.1835 | 0.1792 | |
| 环鄱阳湖城市群 | 0.2302 | 0.2293 | 0.2283 | 0.2273 | 0.2264 | |
| 环境承载力 | 武汉城市圈 | 0.3673 | 0.3873 | 0.4084 | 0.4307 | 0.4541 |
| 环长株潭城市群 | 0.4649 | 0.4897 | 0.5159 | 0.5434 | 0.5725 | |
| 环鄱阳湖城市群 | 0.5693 | 0.5592 | 0.5492 | 0.5394 | 0.5298 | |
| 基础设施承载力 | 武汉城市圈 | 0.1985 | 0.1934 | 0.1885 | 0.1837 | 0.1791 |
| 环长株潭城市群 | 0.1765 | 0.1809 | 0.1855 | 0.1901 | 0.1949 | |
| 环鄱阳湖城市群 | 0.2810 | 0.2771 | 0.2732 | 0.2694 | 0.2657 | |
| 公共服务承载力 | 武汉城市圈 | 0.1467 | 0.1449 | 0.1432 | 0.1415 | 0.1398 |
| 环长株潭城市群 | 0.3116 | 0.3097 | 0.3078 | 0.3058 | 0.3039 | |
| 环鄱阳湖城市群 | 0.2319 | 0.2527 | 0.2754 | 0.3001 | 0.3271 | |
| 人口承载力 | 武汉城市圈 | 0.2632 | 0.2613 | 0.2595 | 0.2577 | 0.2558 |
| 环长株潭城市群 | 0.2971 | 0.3071 | 0.3175 | 0.3282 | 0.3392 | |
| 环鄱阳湖城市群 | 0.2042 | 0.2052 | 0.2062 | 0.2073 | 0.2083 | |
| 外贸承载力 | 武汉城市圈 | 0.3332 | 0.3357 | 0.3383 | 0.3408 | 0.3434 |
| 环长株潭城市群 | 0.2240 | 0.2231 | 0.2222 | 0.2213 | 0.2204 | |
| 环鄱阳湖城市群 | 0.3306 | 0.3292 | 0.3278 | 0.3264 | 0.3250 | |
| 综合承载力 | 长江中游城市群 | 0.2949 | 0.2975 | 0.3001 | 0.3028 | 0.3054 |
| [1] |
国家发展改革委. 长江中游城市群发展规划[EB/OL]. https://www.ndrc.gov.cn/xxgk/zcfb/tz/201504/t20150416_963800.html?code=&state=123,2015-04-13.
|
| [2] |
叶裕民. 解读“城市综合承载能力”[J]. 前线, 2007(4):27-28.
|
| [3] |
石忆邵. 城市综合承载力的研究进展及展望[J]. 地理研究, 2013, 32(1):133-145.
|
| [4] |
|
| [5] |
张人禾, 李强, 张若楠. 2013年1月中国东部持续性强雾霾天气产生的气象条件分析[J]. 中国科学:地球科学, 2014, 44(1):27-36.
|
| [6] |
安强, 魏传江, 贺华翔, 等. 基于模糊综合评价法的河南省中原城市群水资源承载力评价研究[J]. 节水灌溉, 2019(12):70-76.
|
| [7] |
高红丽, 涂建军. 城市综合承载力评价研究——以成渝经济区为例[J]. 西南大学学报:自然科学版, 2010, 32(10):148-152.
|
| [8] |
刘惠敏. 长江三角洲城市群综合承载力的时空分异研究[J]. 中国软科学, 2011(10):114-122.
|
| [9] |
徐骁, 赵富强. 城市综合承载力评价研究——基于三角模糊层次分析法[J]. 当代经济, 2012(23):155-157.
|
| [10] |
魏超, 叶属峰. 海岸带区域综合承载力评估指标体系的构建与应用——以南通市为例[J]. 生态学报, 2013, 33(18):5893-5904.
|
| [11] |
程广斌, 申立敬. 天山北坡城市群城市综合承载力评价[J]. 中国沙漠, 2015, 35(5):1371-1375.
|
| [12] |
苏珍来, 吴壮金, 韦芦桂. 广西北部湾经济区城市群综合承载力时空格局及制约因素[J]. 湖北农业科学, 2019(17):48-52,57.
|
| [13] |
|
| [14] |
石岩, 于雷, 万军. 基于环境安全格局的威海市土地承载力评估[J]. 中国人口·资源与环境, 2015, 25(S2):213-216.
|
| [15] |
|
| [16] |
韩美, 路广. 东营市海岸带区域综合承载力评估[J]. 中国人口·资源与环境, 2017, 27(2):93-101.
|
| [17] |
徐国冲, 郭轩宇. 城市综合承载力的评估框架与提升策略——来自新加坡的启示[J]. 上海行政学院学报, 2020(1):59-69.
|
| [18] |
欧惠, 戴文远, 黄万里, 等. 基于“三生空间”的福建省城市综合承载力研究[J]. 生态科学. 2020(3):74-82.
|
| [19] |
朱小雨, 张廷海. 粤港澳大湾区城市群综合承载力评价研究——基于熵值法和灰色关联法的实证分析[J]. 山西师范大学学报:自然科学版, 2020(2):125-133.
|
| [20] |
阎东彬. 京津冀一体化进程中重点城市综合承载力研究[J]. 国家行政学院学报, 2015(2):70-74.
|
/
| 〈 |
|
〉 |