
1990—2010年中国人口预期寿命与人均GDP的相关关系及其变化特征
|
龚胜生(1965—),男,湖南涟源人,博士,教授,博士生导师。主要研究方向为历史地理学、健康地理学、人文地理学和可持续发展。E-mail:shshgong@mail.ccnu.edu.cn。 |
收稿日期: 2019-05-27
修回日期: 2019-11-05
网络出版日期: 2025-04-01
基金资助
湖北省创新群体项目(2016CFA026)
Correlation and Its Changing Characteristics of China's Population Life Expectancy and GDP Per Capita from 1990 to 2010
Received date: 2019-05-27
Revised date: 2019-11-05
Online published: 2025-04-01
预期寿命是反映人口寿命水平的重要指标,人均GDP是反映经济发展的重要指标。采用相关分析和回归分析对中国1990—2010年市域、县域两个尺度的预期寿命与人均GDP的关系进行分析,结果表明:人均GDP对预期寿命具有显著正向影响,但累积影响强于即时影响;人均GDP超过3 000~5 000元后,其对预期寿命的影响开始出现边际递减效应;人均GDP对预期寿命的影响强度在空间分布上自东向西增强。由于经济相对发达的东部地区人均GDP对预期寿命的贡献率要小于经济相对落后的西部地区,因此,今后东部地区应通过完善社会保障、优化卫生资源配置、倡导健康生活方式等途径进一步提高预期寿命,西部地区则应大力发展区域经济,努力提高生活水平,以尽快缩小与东部地区预期寿命的差距。
龚胜生 , 陈云 , 张涛 , 张正杰 . 1990—2010年中国人口预期寿命与人均GDP的相关关系及其变化特征[J]. 经济地理, 2020 , 40(2) : 23 -30 . DOI: 10.15957/j.cnki.jjdl.2020.02.003
Life expectancy is an important indicator reflecting human-life level,and GDP per capita is an important indicator reflecting economic development. Based on the methods of correlation analysis and regression analysis,this paper analyzes the relationship between life expectancy and GDP per capita at the both prefecture and county levels in China from 1990 to 2010. The results shows that: GDP per capita has a significant positive impact on life expectancy,but the cumulative impact is stronger than the immediate impact; after GDP per capita exceeds 3 000~5 000 yuan, its impact on life expectancy begins to decline marginally; the impact of GDP per capita on life expectancy increases from east to west in spatial distribution. Because the contribution rate of GDP per capita to life expectancy in the developed eastern region is less than that in the developing western region,therefore,the eastern region should further improve life expectancy by improving social security,optimizing health resources allocation and advocating healthy lifestyle,while the western region should make every effort to develop regional economy and strive to improve living standards so as to reduce the gap of life expectancy between the western and the eastern regions as soon as possible in the future.
表1 1990—2010年中国市、县两级预期寿命、人均GDP统计特征值Tab.1 Statistical characteristics of life expectancy and GDP per capita at perfecture and county scales in China from 1990 to 2010 |
| 变量 | 空间尺度 | 年份 | 样本数(个) | 平均值 | 最大值 | 最小值 | 标准差 |
|---|---|---|---|---|---|---|---|
| 预期寿命(LE) | 市域 | 2000 | 341 | 71.03 | 79.03 | 58.12 | 3.56 |
| 2010 | 341 | 74.67 | 83.75 | 60.56 | 3.03 | ||
| 县域 | 2000 | 1 588 | 69.87 | 88.46 | 45.52 | 4.44 | |
| 2010 | 2 084 | 74.01 | 90.43 | 55.84 | 3.40 | ||
| 人均GDP(PGDP) | 市域 | 1990 | 315 | 1 998 | 20 356 | 398 | 1 757 |
| 2000 | 341 | 4 156 | 23 371 | 641 | 3 314 | ||
| 2010 | 341 | 14 046 | 65 136 | 1 688 | 10 213 | ||
| 县域 | 1990 | 1 304 | 1 413 | 8 330 | 273 | 1 042 | |
| 2000 | 1 588 | 2 981 | 41 445 | 152 | 2 784 | ||
| 2010 | 2 084 | 10 533 | 92 628 | 1 151 | 9 378 |
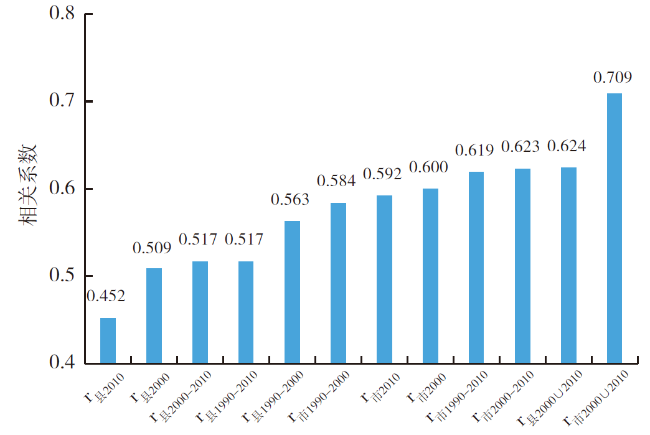
表2 人均GDP与预期寿命的相关系数Tab.2 Correlation coefficients between GDP per capita and life expectancy |
| 变量 | LE2000 | LE2010 | LE2000U2010 | PGDP1990-2000 | PGDP2000-2010 | PGDP1990-2010 |
|---|---|---|---|---|---|---|
| LE2000 | 1 | 市0.584**,县0.563** | ||||
| PGDP2000 | 市0.600**,县0.509** | |||||
| LE2010 | 1 | 市0.623**,县0.517** | 市0.619**,县0.517** | |||
| PGDP2010 | 市0.592**,县0.452** | |||||
| PGDP2000∪2010 | 市0.709**,县0.624** |
说明:表中带**者为0.01显著水平,带*者为0.05显著水平。LE2000U2010为2000和2010年预期寿命的集合,PGDP1990-2000为1990与2000年两个年份人均GDP的平均值,PGDP1990-2010为1990、2000、2010年三个年份人均GDP的平均值,PGDP2000-2010为2000、2010年两个年份的人均GDP的平均值,PGDP2000∪2010为2000和2010年人均GDP的集合。 |
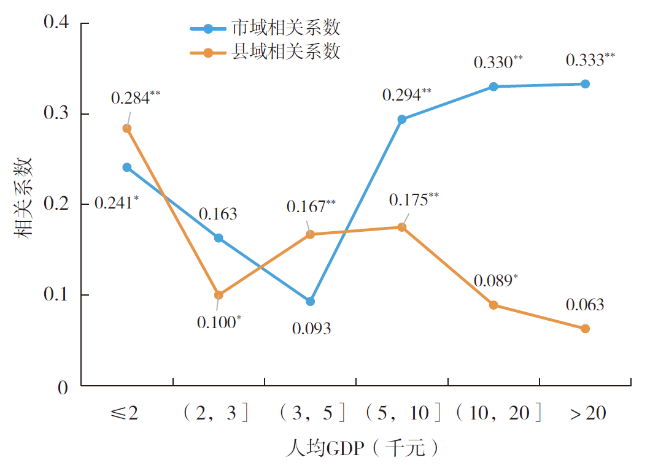
表3 人均GDP与预期寿命的分段相关系数Tab.3 Sectional correlation coefficients between GDP per capita and life expectancy |
| 人均GDP(元)(1990年可比价格) | ≤2 000 | (2 000,3 000] | (3000,5 000] | (5000,10 000] | (10 000,20 000] | >20 000 |
|---|---|---|---|---|---|---|
| 样本市数(个) | 78 | 89 | 127 | 178 | 146 | 64 |
| r市2000∪2010 | 0.241* | 0.163 | 0.093 | 0.294** | 0.330** | 0.333** |
| 样本县数(个) | 724 | 502 | 697 | 962 | 557 | 230 |
| r县2000∪2010 | 0.284** | 0.100* | 0.167** | 0.175** | 0.089* | 0.063 |
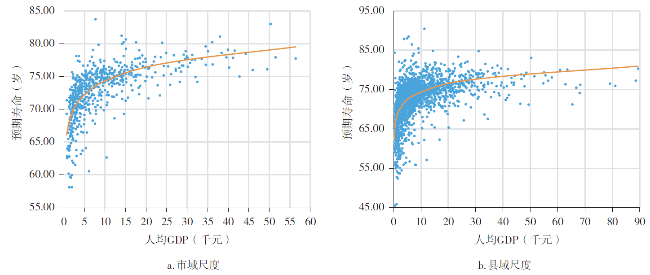
表4 人均GDP对数值与预期寿命的一元回归分析结果Tab.4 Univariate regression analysis results of logarithm of GDP per capita and life expectancy |
| 空间尺度 | 因变量 | 常量 自变量 | 未标准化系数 | 标准化系数 | t | R² | F | |
|---|---|---|---|---|---|---|---|---|
| B | 标准误差 | |||||||
| 市域尺度 | 常量 | 44.418 | 1.933 | 22.982(0.000) | 0.360 | 190.847 [0.000] | ||
| LE市2000 | lnPGDP市2000 | 3.284 | 0.238 | 0.600 | 13.815(0.000) | |||
| 常量 | 49.786 | 1.845 | 26.990(0.000) | 0.351 | 182.992 [0.000] | |||
| LE市2010 | lnPGDP市2010 | 2.669 | 0.197 | 0.592 | 13.527(0.000) | |||
| 常量 | 48.088 | 1.854 | 25.932(0.000) | 0.341 | 161.441 [0.000] | |||
| LE市2000 | lnPGDP市1990-2000 | 2.985 | 0.235 | 0.584 | 12.706(0.000) | |||
| 常量 | 53.897 | 1.514 | 35.593(0.000) | 0.388 | 197.709 [0.000] | |||
| LE市2010 | ln PGDP市2000-2010 | 2.375 | 0.169 | 0.623 | 14.061(0.000) | |||
| 常量 | 53.628 | 1.548 | 34.648(0.000) | 0.383 | 194.021 [0.000] | |||
| LE市2010 | lnPGDP市1990-2010 | 2.485 | 0.178 | 0.619 | 13.929(0.000) | |||
| 常量 | 46.924 | 0.993 | 47.254(0.000) | 0.503 | 689.066 [0.000] | |||
| LE市2000U2010 | ln PGDP市2000∪2010 | 2.975 | 0.113 | 0.709 | 26.250(0.000) | |||
| 县域尺度 | 常量 | 44.110 | 1.097 | 40.228(0.000) | 0.260 | 556.049 [0.000] | ||
| LE县2000 | lnPGDP县2000 | 3.325 | 0.141 | 0.509 | 23.581(0.000) | |||
| 常量 | 54.384 | 0.851 | 63.869(0.000) | 0.204 | 534.737 [0.000] | |||
| LE县2010 | lnPGDP县2010 | 2.182 | 0.094 | 0.452 | 23.124(0.000) | |||
| 常量 | 46.632 | 1.154 | 40.398(0.000) | 0.316 | 450.866 [0.000] | |||
| LE县2000 | lnPGDP县1990-2000 | 3.228 | 0.152 | 0.563 | 21.234(0.000) | |||
| 常量 | 55.051 | 1.047 | 52.578(0.000) | 0.267 | 354.424 [0.000] | |||
| LE县2010 | ln PGDP县2000-2010 | 2.282 | 0.121 | 0.157 | 18.826(0.000) | |||
| 常量 | 54.850 | 1.057 | 51.889(0.000) | 0.267 | 354.809 [0.000] | |||
| LE县2010 | lnPGDP县1990-2010 | 2.385 | 0.127 | 0.517 | 18.836(0.000) | |||
| 常量 | 47.284 | 0.518 | 91.252(0.000) | 0.390 | 2344.068 [0.000] | |||
| LE县2000U2010 | ln PGDP县2000∪2010 | 2.949 | 0.061 | 0.624 | 48.416(0.000) | |||
注:圆括号内为常量和回归系数t显著性水平值,方括号内为方程F统计显著性水平值,显著性水平值<0.05则通过显著性检验。R²为方程拟合优度,取值范围为[0,1],数值越大则方程拟合效果越好。 |
表5 人均GDP与预期寿命的地理加权回归结果Tab.5 GWR results of GDP per capita and life expectancy |
| 空间尺度 | 因变量 | 常量/自变量 | 平均值 | 最大值 | 最小值 | 带宽 | AICc | R² |
|---|---|---|---|---|---|---|---|---|
| 市域尺度 | 常量 | 69.2016 | 72.5342 | 58.63617 | 478 350 | 1 523 | 0.66 | |
| LE市2000 | PGDP市2000 | 0.0006 | 0.0015 | 0.0001 | ||||
| 常量 | 72.9208 | 77.0304 | 60.3673 | 478 350 | 1 451 | 0.62 | ||
| LE市2010 | PGDP市2010 | 0.0001 | 0.0010 | -0.0002 | ||||
| 县域尺度 | 常量 | 68.4732 | 76.4711 | 55.8427 | 323 521 | 7 856 | 0.61 | |
| LE县2000 | PGDP县2000 | 0.0006 | 0.0054 | -0.0023 | ||||
| 常量 | 72.7887 | 78.4707 | 60.2089 | 323 521 | 9 783 | 0.48 | ||
| LE县2010 | PGDP县2010 | 0.0001 | 0.0015 | -0.0015 |
| [1] |
邱红, 李晶华, 于丽莎, 等. 人口平均预期寿命及疾病影响因素分析[J]. 人口学刊, 2018, 40(6):31-39.
|
| [2] |
国家统计局. 中国统计年鉴2018[M]. 北京: 中国统计出版社, 2018.
|
| [3] |
国家卫生和计划生育委员会. 中国卫生和计划生育统计年鉴2016[M]. 北京: 中国协和医科大学出版社, 2016.
|
| [4] |
中华人民共和国国家卫生健康委员会. 2017年我国卫生健康事业发展统计公报[EB/OL]. http://www.nhfpc.gov.cn/guihuaxxs/s10743/201806/44e3cdfe11fa4c7f928c879d435b6a18.shtml,2018-06-12.
|
| [5] |
谭见安, 李日邦, 朱文郁. 我国医学地理研究的主要进展和展望[J]. 地理学报, 1990, 45(2):187-201.
|
| [6] |
龚胜生, 葛履龙, 张涛. 湖北省百岁人口分布与长寿区自然环境背景[J]. 热带地理, 2016, 36(5):727-735.
|
| [7] |
杨振, 刘会敏, 王晓霞. 中国人口健康分布的时空变化与影响因素[J]. 世界地理研究, 2017, 26(2):161-168.
|
| [8] |
齐良书. 经济、 环境与人口健康的相互影响:基于我国省区面板数据的实证分析[J]. 中国人口·资源与环境, 2008, 18(6):169-173.
|
| [9] |
龚胜生, 储环, 张涛. 1990—2010年安徽省人口长寿水平的时空变化[J]. 地域研究与开发, 2015, 34(4):160-168.
|
| [10] |
钟晓妮, 周燕荣. 健康与社会经济发展关系研究[J]. 现代预防医学, 2007, 34(4):741-744.
|
| [11] |
包玉香. 区域经济发展影响居民长寿水平的实证研究——以山东省为例[J]. 山东师范大学学报:人文社会科学版, 2014, 59(6):103-111.
|
| [12] |
王森. 我国人口预期寿命的结构及影响因素研究——基于省级面板数据的分析[J]. 西北人口, 2014, 35(3):37-42.
|
| [13] |
齐亚强, 李琳. 中国预期寿命变动的地区差异及其社会经济影响因素:1981—2010[J]. 中国卫生政策研究, 2018, 11(8):29-35.
|
| [14] |
徐鑫. 对中国人均寿命影响因素的信息加权集结的计量分析[J]. 统计与信息论坛, 2011, 26(7):52-58.
|
| [15] |
郭玉玲. 中国人均预期寿命时空变化及影响因素分析[J]. 中国卫生政策研究, 2018, 11(8):44-49.
|
| [16] |
齐亚强, 牛建林. 地区经济发展与收入分配状况对我国居民健康差异的影响[J]. 社会学评论, 2015, 3(2):65-76.
|
| [17] |
李智, 张山山, 全星, 等. 云南省不同时期预期寿命及影响因素分析[J]. 中国卫生统计, 2018, 35(2):279-282.
|
| [18] |
张山山, 刘锦桃. 中国各地区人口预期寿命及地理分布分析[J]. 西北人口, 2014, 35(4):18-21.
|
| [19] |
李日邦, 谭见安, 王五一, 等. 中国人口寿命的时间变化和区域差异[J]. 人文地理, 2000, 15(2):1-6.
|
| [20] |
|
| [21] |
|
| [22] |
|
| [23] |
|
| [24] |
尹伯成, 许晓茵. 西方经济学基础教程[M]. 上海: 上海人民出版社, 2014.
|
| [25] |
刘达伟. Excel在死亡统计中的应用[J]. 中国卫生统计, 2001, 18(6):49-50.
|
| [26] |
[美]戴维·W·S·黄, 杰·李. ArcView GIS与ArcGIS 地理信息统计分析[M]. 张学良,译. 北京: 中国财政经济出版社, 2008.
|
| [27] |
|
| [28] |
武鹏, 李同昇, 李卫民. 县域农村贫困化空间分异及其影响因素:以陕西山阳县为例[J]. 地理研究, 2018, 37(3):593-606.
|
| [29] |
李小建. 经济地理学研究中的尺度问题[J]. 经济地理, 2005, 25(4):433-436.
|
| [30] |
刘振锋, 薛东前, 庄元, 等. 文化产业空间尺度效应研究——以西安市为例[J]. 地理研究, 2016, 35(10):1 963-1 972.
|
/
| 〈 |
|
〉 |
