
湖南省研发投入的空间格局与创新协调发展对策
|
罗建(1977—),男,湖南长沙人,博士,副教授。主要研究方向为技术经济。E-mail:4658669@qq.com。 |
收稿日期: 2019-05-09
修回日期: 2019-11-23
网络出版日期: 2025-04-01
基金资助
湖南省自然科学基金项目(2019JJ50301)
湖南省科技计划项目—重点研发项目(2015ZK2017)
Spatial Pattern and Countermeasure Analysis of R&D Input in Hunan
Received date: 2019-05-09
Revised date: 2019-11-23
Online published: 2025-04-01
罗建 , 史敏 , 廖婷 . 湖南省研发投入的空间格局与创新协调发展对策[J]. 经济地理, 2020 , 40(2) : 125 -131 . DOI: 10.15957/j.cnki.jjdl.2020.02.014
Taking 14 cities and states in Hunan Province as the research object,this paper attempts to use urban primacy index and ESDA method to study the spatial correlation and characteristics of R&D input in Hunan Province. The main conclusions include: 1) The gap of the R&D expenditure between cities and states in Hunan Province is gradually narrowing,but the gap of the R&D Professional Innovator is gradually increasing; 2) The R&D expenditure and the R&D Professional Innovator in Hunan Province do exist obvious spatial dependence and spatial agglomeration among cities and states,and show a large area of low-level agglomeration characteristics in Western and southern peripheral cities and states; 3)The spatial evolution characteristics of R&D investment in Hunan Province are not significant,and Changsha-Zhuzhou-Xiangtan,as the central city circle of the provincial capital,lacks radiation driving force. Finally,the paper puts forward some countermeasures and suggestions for the coordinated development of scientific and technological innovation in Hunan Province.
Key words: R&D input; ESDA; spatial patterns; innovative province construction; Hunan Province
表1 湖南省与全国R&D经费投入情况对比表Tab.1 The R&D expenditure in Hunan VS the Country |
| 年份 | 湖南 | 全国 | |||
|---|---|---|---|---|---|
| R&D经费 /亿元 | R&D投入 强度/% | R&D经费 /亿元 | R&D投入 强度/% | ||
| 2000 | 19.20 | 0.54 | 895.66 | 0.89 | |
| 2001 | 24.00 | 0.63 | 1 042.49 | 0.94 | |
| 2002 | 26.20 | 0.63 | 1 287.64 | 1.06 | |
| 2003 | 30.10 | 0.65 | 1 539.63 | 1.12 | |
| 2004 | 37.00 | 0.65 | 1 966.33 | 1.21 | |
| 2005 | 44.52 | 0.67 | 2 449.97 | 1.31 | |
| 2006 | 53.62 | 0.71 | 3 003.10 | 1.37 | |
| 2007 | 73.55 | 0.80 | 3 710.24 | 1.37 | |
| 2008 | 112.70 | 1.01 | 4 616.02 | 1.44 | |
| 2009 | 153.50 | 1.18 | 5 802.11 | 1.66 | |
| 2010 | 186.56 | 1.16 | 7 062.58 | 1.71 | |
| 2011 | 233.22 | 1.19 | 8 687.01 | 1.78 | |
| 2012 | 287.68 | 1.30 | 10 298.41 | 1.91 | |
| 2013 | 327.03 | 1.33 | 11 846.60 | 1.99 | |
| 2014 | 367.93 | 1.36 | 13 015.63 | 2.02 | |
| 2015 | 412.67 | 1.13 | 14 169.88 | 2.07 | |
| 2016 | 468.84 | 1.50 | 15 676.70 | 2.11 | |
| 2017 | 568.53 | 1.68 | 17 606.10 | 2.13 | |
表2 长沙市研发投入要素首位度分析Tab.2 Primacy ratio analysis of R&D input factors in Changsha |
| 年份 | 首位度 | 四城市指数 | |||
|---|---|---|---|---|---|
| R&D经费 | R&D人员 全时当量 | R&D经费 | R&D人员 全时当量 | ||
| 2009 | 5.34 | 4.77 | 1.92 | 1.95 | |
| 2013 | 3.90 | 4.94 | 1.51 | 2.23 | |
| 2016 | 3.85 | 6.76 | 1.48 | 2.41 | |
表3 湖南省14个市州2009、2013、2016年研发投入的Moran's I及其检验Tab.3 Moran's I index and its inspection of R&D Input factors of 16 cities in Hunan |
| 年份 | R&D经费 | R&D人员全时当量 | |||||
|---|---|---|---|---|---|---|---|
| Moran's I | Z-value | P-value | Moran's I | Z-value | P-value | ||
| 2009 | 0.0680 | 2.0445 | 0.025** | 0.0453 | 1.8569 | 0.034** | |
| 2013 | 0.1386 | 2.5333 | 0.009*** | 0.0311 | 1.8049 | 0.046** | |
| 2016 | 0.1095 | 2.1039 | 0.027** | 0.0124 | 1.7293 | 0.041** | |
注:***、**分别表示在1%、5%显著性水平下显著。 |
表4 湖南省14个市州2009、2013、2016年R&D经费的Moran聚类统计结果Tab.4 Moran clustering result of R&D spending of Hunan in 2009,2013 and 2016 |
| 象限 | 2009 | 2013 | 2016 |
|---|---|---|---|
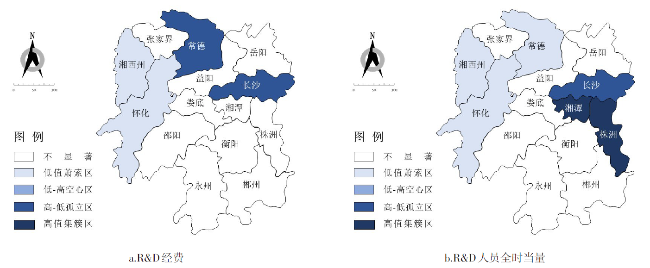
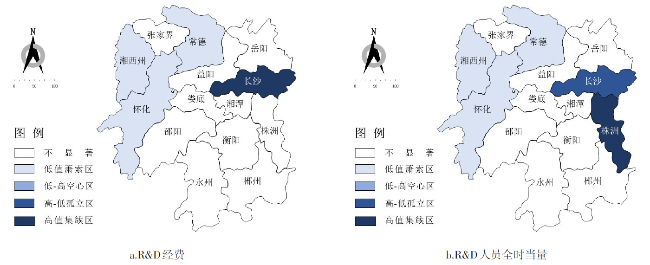
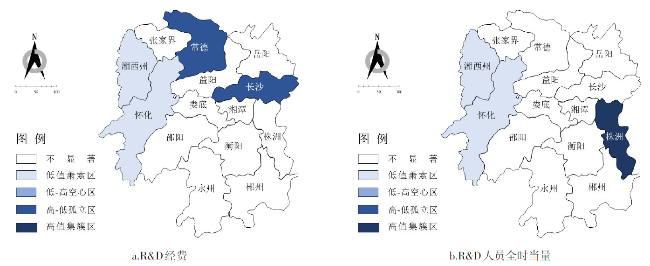
| 1:HH | 岳阳、湘潭、株洲 | 岳阳、湘潭、株洲、长沙 | 岳阳、株洲 |
| 2:LH | 益阳、娄底 | 益阳、娄底 | 湘潭、益阳、娄底 |
| 3:LL | 张家界、湘西州、邵阳、怀化、衡阳、永州、郴州 | 张家界、常德、湘西州、邵阳、怀化、衡阳、永州、郴州 | 张家界、湘西州、邵阳、怀化、衡阳、永州、郴州 |
| 4:HL | 长沙、常德 | - | 长沙、常德 |
表5 湖南省14个市州2009、2013、2016年R&D人员全时当量的Moran聚类统计结果Tab.5 Moran clustering result of R&D personnel of Hunan in 2009, 2013 and 2016 |
| 象限 | 2009 | 2013 | 2016 |
|---|---|---|---|
| 1:HH | 湘潭、株洲 | 湘潭、株洲 | 株洲 |
| 2:LH | 岳阳、益阳、娄底 | 岳阳、益阳、娄底 | 岳阳、益阳、娄底、湘潭 |
| 3:LL | 张家界、常德、湘西州、邵阳、怀化、衡阳、永州、郴州 | 张家界、常德、湘西州、邵阳、怀化、衡阳、永州、郴州 | 张家界、常德、湘西州、邵阳、怀化、衡阳、永州、郴州 |
| 4:HL | 长沙 | 长沙 | 长沙 |
图1 2009年R&D经费及R&D人员全时当量的LISA集聚图Fig.1 LISA cluster diagram of the R&D expenditure and the R&D Professional Innovator in 2009 |
图2 2013年R&D经费及 R&D 人员全时当量的LISA集聚图Fig.2 LISA cluster diagram of the R&D expenditure and the R&D Professional Innovator in 2013 |
| [1] |
文晓芬, 李维思, 张越. 湖南省R&D经费投入现状与对策研究[J]. 企业技术开发, 2017, 36(10):1-4.
|
| [2] |
赵建吉, 曾刚. 创新的空间测度:数据与指标[J]. 经济地理, 2009, 29(8):1 250-1 255.
|
| [3] |
邹琳, 曾刚, 曹贤忠. 基于ESDA的长三角城市群研发投入空间分异特征及时空演化[J]. 经济地理, 2015, 35(3):73-79.
|
| [4] |
冉泽泽. 基于ESDA的经济空间差异实证研究——以丝绸之路经济带中国西北段核心节点城市为例[J]. 经济地理, 2017, 37(5):28-34,73.
|
| [5] |
胡艳兴, 潘竟虎, 陈蜒, 等. 基于ESDA和GWR的中国地级及以上城市四化协调发展时空分异格局[J]. 经济地理, 2015, 35(5):45-54.
|
| [6] |
陈利, 朱喜钢, 杨阳, 等. 基于空间计量的云南省县域经济空间格局演变[J]. 经济地理, 2017, 37(1):40-49.
|
| [7] |
夏雪, 韩增林, 赵林, 等. 省际边缘区区域经济差异的时空格局与形成机理——以鄂豫皖赣为例[J]. 经济地理, 2014, 34(5):21-27.
|
| [8] |
邹晨, 欧向军, 孙丹. 长江三角洲城市群经济联系的空间结构演化分析[J]. 资源开发与市场, 2018, 34(1):47-53.
|
| [9] |
冯兴华, 钟业喜, 陈琳, 等. 长江经济带县域经济空间格局演变分析[J]. 经济地理, 2016, 36(6):18-25.
|
| [10] |
刘刚, 杨蕾, 刘程军. 创新活度的空间分异特征及其门槛效应——以长江经济带为例[J]. 华东经济管理, 2017, 31(1):51-59.
|
| [11] |
马双. 城市知识复杂性空间分异与演化分析:以长江经济带为例[J]. 科技进步与对策, 2018, 35(19):140-146.
|
| [12] |
陈瑜, 谢富纪. 基于ESDA的中国长三角地区创新空间分异及演进研究[J]. 技术经济, 2017, 36(3):8-13.
|
| [13] |
符新伟, 周玲, 段捷. 基于ESDA的中国高校研发投入时空分异格局研究[J]. 科技管理研究, 2017(15):104-110.
|
| [14] |
张虹鸥, 叶玉瑶, 陈绍愿. 珠江三角洲城市群城市规模分布变化及其空间特征[J]. 经济地理, 2006, 26(5):806-809.
|
/
| 〈 |
|
〉 |