
中国资源型城市转型绩效测度与评价
|
谭俊涛(1988—),男,山东青岛人,博士,讲师。主要研究方向为城市与区域发展。E-mail:tanjuntaocf@163.com。 |
收稿日期: 2019-10-14
修回日期: 2020-05-14
网络出版日期: 2025-04-01
基金资助
国家自然科学基金面上项目(41671123)
国家自然科学基金面上项目(41571152)
教育部人文社会科学基金项目(20YJCZH143)
江苏省高校自然科学基金项目(19KJB170012)
江苏师范大学高校博士科研启动基金项目(17XLR004)
江苏高校优势学科建设工程资助项目(PAPD)
Research on the Urban Transformation Performance of China's Resource-Based Cities
Received date: 2019-10-14
Revised date: 2020-05-14
Online published: 2025-04-01
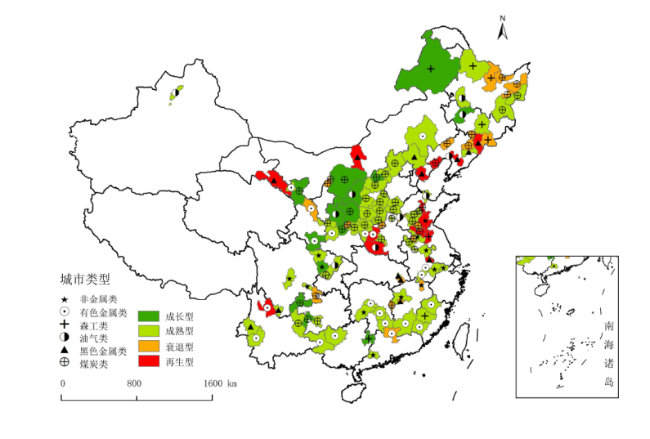
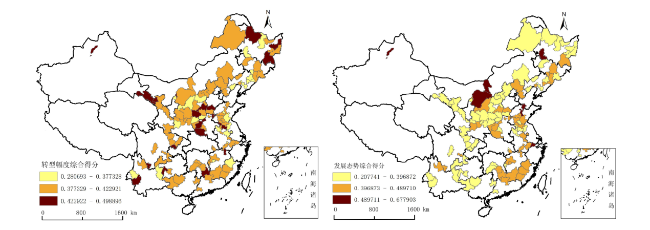
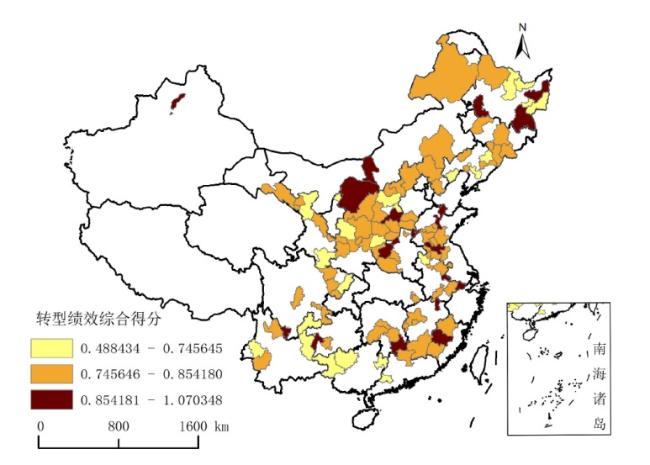
科学评价资源型城市转型绩效,是衡量国家转型政策实施效果的重要途径,也是资源型城市转型发展研究的重要议题。文章从转型幅度和发展态势两个方面构建资源型城市转型测度指标体系,运用熵值法和模糊层次分析等方法,定量评价了2013—2017年我国114个资源型城市的转型绩效,并对不同类型城市的转型绩效差异性进行了分析,得出以下主要结论:首先,国家实施资源型城市可持续发展规划后,城市转型绩效呈分化趋势,低值区域集中分布在东北、西南等偏远地区,城市转型幅度较好,但发展态势依旧整体较差。第二,再生型资源型城市转型绩效均值最高,其次是成熟型和成长型,衰退型城市转型绩效最差,成长型和衰退型城市转型绩效组内差异较大。第三,油气类城市转型绩效最高,其次是黑色金属类、非金属、有色金属类,煤炭类和森工类最低。第四,资源型城市转型绩效呈现东部地区最优,其次是中部地区和西部地区,东北地区最差,与城市发展态势呈现相似的分布特征,转型幅度在四大板块间和区域内差异均不大。最后,对资源型城市转型发展提出了相关的对策建议。
谭俊涛 , 张新林 , 刘雷 , 赵宏波 , 仇方道 . 中国资源型城市转型绩效测度与评价[J]. 经济地理, 2020 , 40(7) : 57 -64 . DOI: 10.15957/j.cnki.jjdl.2020.07.007
Scientific evaluation of the transformation performance of resource-based cities(RBCs) is an important way to measure the effect of the implementation of national transformation policies,and is also an important issue in the research of the sustainable development of RBCs.This article constructs a resource-based city transformation evaluation index system from the transformation extent and the development status,then using the methods of entropy method and fuzzy analytic hierarchy,the article quantitatively evaluates the transformation performance of 114 RBCs in China from 2013 to 2017,and analyzes the differences in transformation performance of different types of cities. The following main conclusions are drawn. First,after the implementation of the RBCs sustainable development plan,the urban transformation performance was heterogeneous,and the low-value areas were concentrated in some remote areas such as the northeast and southwest of China. The urban transformation extent was generally good,but the development status was still poor overall. Second,the regenerative cities had the highest average value of urban transformation performance,following by mature and growing types,and the recessionary cities was the worest. The difference among diferent cities in growing and recessionary types was generally large. Third,oil & gas cities had the highest transformation performance,followed by ferrous metals,non-metals,and non-ferrous metals,coal and forestry cities having the lowest transformation performance. Fourth,the cities in East China had the highest average value of urban transformation performance,followed by the Central region and the Western region,and Northeast China was the worst. The development status presented similar distribution characteristics,and the difference of transformation extent was not large between the four regions and within the region. Finally, relevant countermeasures and suggestions were proposed for the transformation and sustainable development of RBCs in China.
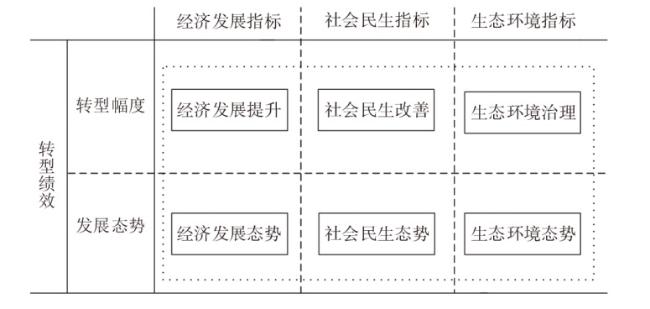
表1 资源型城市发展态势评价指标体系Tab.1 The development status evaluation index system of resource-based cities |
| 目标层 | 系统层 | 准则层 | 指标层 | 作用方向 | 主观权重 |
|---|---|---|---|---|---|
| 资 源 型 城 市 发 展 态 势 | 经济发展态势 | 经济运行 | GDP增速(%) | + | 0.0524 |
| 人均GDP(元) | + | 0.1104 | |||
| 外资依存度(%) | + | 0.0079 | |||
| 人均财政收入(元) | + | 0.0109 | |||
| 经济结构 | 三产比重(%) | + | 0.0769 | ||
| 采矿业从业比重(%) | - | 0.0236 | |||
| 制造业从业比重(%) | + | 0.0159 | |||
| 产业结构多样化 | + | 0.0353 | |||
| 社会民生态势 | 就业与工资 | 在岗职工平均工资(元) | + | 0.1079 | |
| 城镇登记失业率(%) | - | 0.0487 | |||
| 生活水平 | 人均居民人民币存款(元) | + | 0.0306 | ||
| 人均社会消费品零售总额(元) | + | 0.0091 | |||
| 教育医疗 | 万人高等学校生数(人) | + | 0.0129 | ||
| 万人医院、卫生院卫生床位数(张) | + | 0.0306 | |||
| 教育、科学支出占财政支出比(%) | + | 0.0739 | |||
| 城市建设 | 人均建设用地面积(m2) | + | 0.0195 | ||
| 生态环境态势 | 资源消耗 | 单位GDP水耗(t/万元) | - | 0.0231 | |
| 单位工业产值用电量(kW·h/万元) | - | 0.0521 | |||
| 环境污染 | 工业废物排放指数 | - | 0.1103 | ||
| 环境治理 | 工业固体废物综合利用率(%) | + | 0.0164 | ||
| 城镇生活污水处理率(%) | + | 0.0101 | |||
| 生活垃圾无害化处理率(%) | + | 0.0098 | |||
| 生态本底 | 市辖区人均绿地面积(m2) | + | 0.0349 | ||
| 建成区绿化覆盖率(m2) | + | 0.0767 |
表2 不同发展阶段资源型城市转型绩效综合得分均值Tab.2 The mean values of transformation performance in different stage |
| 城市 类型 | 发展态势 | 转型幅度 | 城市转型绩效 | |||||
|---|---|---|---|---|---|---|---|---|
| 均值 | 标准差 | 均值 | 标准差 | 均值 | 标准差 | |||
| 成长型 | 0.3860 | 0.0922 | 0.4056 | 0.0314 | 0.7916 | 0.0961 | ||
| 成熟型 | 0.4026 | 0.0584 | 0.4011 | 0.0256 | 0.8037 | 0.0617 | ||
| 衰退型 | 0.3854 | 0.0583 | 0.3957 | 0.0504 | 0.7811 | 0.0929 | ||
| 再生型 | 0.4379 | 0.0620 | 0.3968 | 0.0355 | 0.8347 | 0.0840 | ||
表3 不同资源类型城市转型绩效综合得分均值Tab.3 The mean values of transformation performance in different resource types |
| 城市类型 | 发展态势 | 转型幅度 | 城市转型绩效 | |||||
|---|---|---|---|---|---|---|---|---|
| 均值 | 标准差 | 均值 | 标准差 | 均值 | 标准差 | |||
| 黑色金属类 | 0.4272 | 0.0600 | 0.3917 | 0.0351 | 0.8189 | 0.0804 | ||
| 有色金属类 | 0.4004 | 0.0473 | 0.4028 | 0.0281 | 0.8032 | 0.0552 | ||
| 油气类 | 0.4384 | 0.0939 | 0.4010 | 0.0323 | 0.8394 | 0.1074 | ||
| 森工类 | 0.3725 | 0.0813 | 0.3858 | 0.0459 | 0.7583 | 0.1208 | ||
| 煤炭类 | 0.3904 | 0.0636 | 0.4028 | 0.0365 | 0.7932 | 0.0794 | ||
| 非金属类 | 0.4118 | 0.0502 | 0.4012 | 0.0204 | 0.8130 | 0.0540 | ||
表4 不同地区资源型城市转型绩效综合得分均值Tab.4 The mean values of transformation performance in different regions |
| 城市类型 | 发展态势 | 转型幅度 | 城市转型绩效 | |||||
|---|---|---|---|---|---|---|---|---|
| 均值 | 标准差 | 均值 | 标准差 | 均值 | 标准差 | |||
| 东部地区 | 0.4388 | 0.0559 | 0.3935 | 0.0190 | 0.8324 | 0.0669 | ||
| 中部地区 | 0.4049 | 0.0406 | 0.4014 | 0.0272 | 0.8063 | 0.0556 | ||
| 西部地区 | 0.3903 | 0.0789 | 0.4082 | 0.0347 | 0.7984 | 0.0928 | ||
| 东北地区 | 0.3796 | 0.0689 | 0.3877 | 0.0488 | 0.7673 | 0.0961 | ||
| [1] |
李彦军, 叶裕民. 城市发展转型问题研究综述[J]. 城市问题, 2012(5):97-101.
|
| [2] |
张文忠, 余建辉, 李佳. 资源枯竭城市转型的驱动因素和机理解析[J]. 中国科学院院刊, 2016(1):92-100.
|
| [3] |
|
| [4] |
|
| [5] |
柳泽, 周文生, 姚涵. 国外资源型城市发展与转型研究综述[J]. 中国人口·资源与环境, 2011, 21(11):161-168.
|
| [6] |
余建辉, 张文忠, 王岱, 等. 资源枯竭城市转型成效测度研究[J]. 资源科学, 2013, 35(9):1 812-1 820.
|
| [7] |
龙如银. 中国矿业城市可持续发展:理论与方法研究[M]. 徐州: 中国矿业大学出版社, 2005.
|
| [8] |
张平宇. 阜新市经济转型的战略问题及对策[J]. 矿业研究与开发, 2005, 25(1):1-5.
|
| [9] |
樊杰. 我国煤矿城市产业结构转换问题研究[J]. 地理学报, 1993, 60(3):218-225.
|
| [10] |
张文忠, 王岱, 余建辉. 资源型城市接续替代产业发展路径与模式研究[J] 中国科学院院刊, 2011, 26(2):134-141.
|
| [11] |
刘云刚. 大庆市资源型产业结构转型对策研究[J]. 经济地理, 2000, 20(5):26-29.
|
| [12] |
梅林, 孙春暖. 东北地区煤炭资源型城市空间结构的重构——以辽源市为例[J]. 经济地理, 2006, 26(6):949-956.
|
| [13] |
杨显明, 焦华富, 许吉黎. 煤炭资源型城市空间结构演化过程、模式及影响因素——基于淮南市的实证研究[J]. 地理研究, 2015, 34(3):513-524.
|
| [14] |
宋飏, 王士君, 王雪微, 等. 矿业城市生命周期与空间结构演进规律研究[J]. 人文地理, 2012, 127(5):54-61.
|
| [15] |
孙淼, 丁四保. 我国资源型城市衰退的体制原因分析[J]. 经济地理, 2005, 25(2):273-276.
|
| [16] |
金凤君, 陈明星. “东北振兴”以来东北地区区域政策评价研究[J]. 经济地理, 2010, 30(8):1 259-1 265.
|
| [17] |
|
| [18] |
余建辉, 张文忠, 王岱. 中国资源枯竭城市的转型效果评价[J]. 自然资源学报, 2011, 26(1):11-21.
|
| [19] |
张文忠, 余建辉, 李佳. 资源枯竭城市转型的驱动因素和机理解析[J]. 中国科学院院刊, 2016(1):92-100.
|
| [20] |
吴青龙, 朱美峰, 郭丕斌. 基于脱钩理论的资源型经济转型绩效评价研究[J]. 经济问题, 2019, 478(6):127-134.
|
| [21] |
曾贤刚, 段存儒. 煤炭资源枯竭型城市绿色转型绩效评价与区域差异研究[J]. 中国人口·资源与环境, 2018, 28(7):130-138.
|
| [22] |
黄天能, 李江风, 许进龙, 等. 资源枯竭城市转型发展绩效评价及障碍因子诊断——以湖北大冶为例[J]. 自然资源学报, 2019, 34(7):1 417-1 428.
|
| [23] |
陈妍, 梅林. 东北地区资源型城市转型过程中社会——经济——环境协调演化特征[J]. 地理研究, 2018, 37(2):307-318.
|
| [24] |
董锋, 龙如银, 李晓晖. 考虑环境因素的资源型城市转型效率分析——基于DEA方法和面板数据[J]. 长江流域资源与环境, 2012, 21(5):519-524.
|
| [25] |
李梦雅, 严太华. 基于DEA模型和信息熵的我国资源型城市产业转型效率评价——以全国40个地市级资源型城市为例[J]. 科技管理研究, 2018(3):86-93.
|
| [26] |
余建辉, 李佳洺, 张文忠. 中国资源型城市识别与综合类型划分[J]. 地理学报, 2018, 73(4):677-687.
|
| [27] |
刘云刚. 中国资源型城市界定方法的再考察[J]. 经济地理, 2006, 26(6):940-944.
|
| [28] |
|
| [29] |
孙威, 李洪省. 中国资源枯竭城市的区位条件辨析[J]. 地理学报, 2013, 68(2):199-208.
|
| [30] |
张文忠, 余建辉, 王岱. 中国资源型城市转型路径和模式研究[J]. 城市与区域规划研究, 2011, 4(1):40-56.
|
/
| 〈 |
|
〉 |