
大运河文化带城市综合承载力评价与时空分异
|
孙久文(1956—),男,北京人,博士,教授,博士生导师。主要研究方向为经济地理、区域经济。E-mail:sunjw@ruc.edu.cn。 |
收稿日期: 2020-03-08
修回日期: 2020-06-26
网络出版日期: 2025-04-01
基金资助
研究阐释党的十九大精神国家社会科学基金专项项目(18VSJ022)
中国人民大学应用经济学院科学研究基金项目(2018000092)
Comprehensive Carrying Capacity Evaluation and Spatial-Temporal Differentiation of Cities in the Grand Canal Cultural Belt
Received date: 2020-03-08
Revised date: 2020-06-26
Online published: 2025-04-01
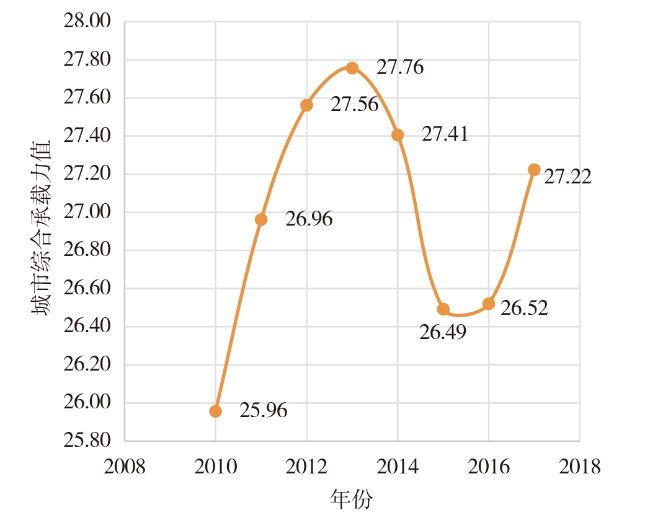
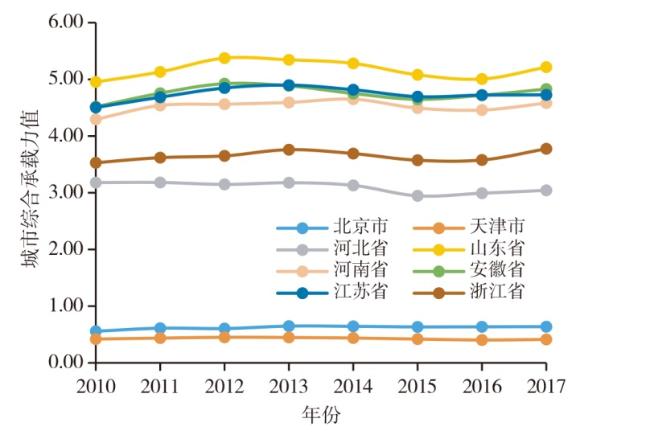
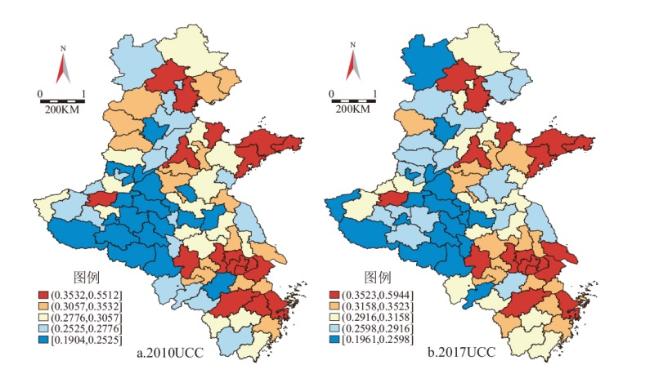
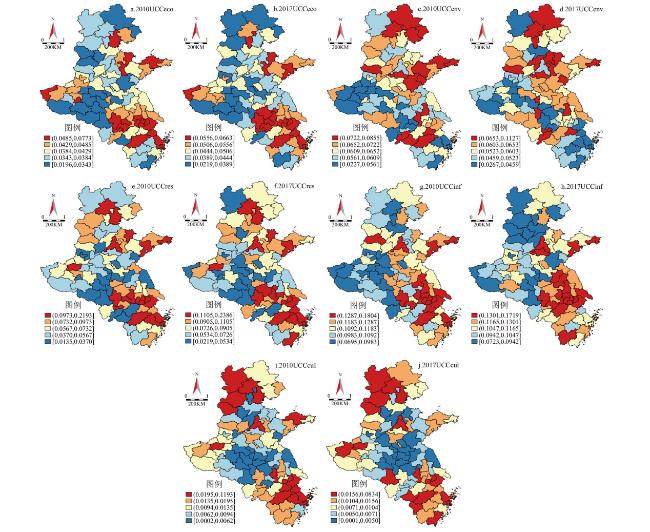
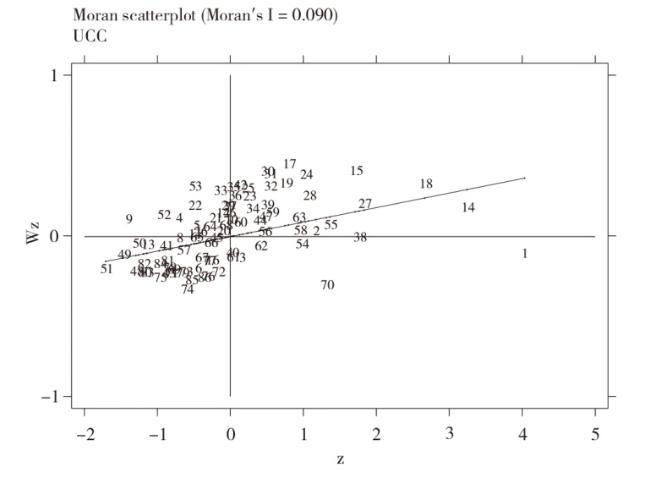
大运河文化带纵贯中国南北,跨6省2市,在中国经济发展中起着举足轻重的作用。文章从城市综合承载力角度研究大运河文化带的发展,通过构建城市综合承载力评价指标体系,评价2010—2017年大运河文化带城市综合承载力的演变情况。并从时间和空间两个维度分析大运河文化带、大运河文化带所含8省(市)、大运河文化带所含87个城市三个空间尺度的综合承载力时空演变。结果表明,大运河文化带城市综合承载力在2010—2017年呈“N”型变化,空间上呈现出沿海高内陆低、南高北低的格局,并且直辖市、省会城市以及经济强市明显高于周围普通地级市。通过空间分析得到Moran's I值发现,大运河文化带的城市综合承载力呈现显著的空间正相关性,以“高—高”“低—低”为主呈聚类分布。最后,文章认为大运河文化带的发展要从补齐综合承载力短板、加强城市间的协同作用、做大做强中心城市等方面入手,提升发展潜力和发展质量。
孙久文 , 易淑昶 . 大运河文化带城市综合承载力评价与时空分异[J]. 经济地理, 2020 , 40(7) : 12 -21 . DOI: 10.15957/j.cnki.jjdl.2020.07.002
The Grand Canal Cultural Belt runs through the north and south of China,spanning six provinces and two cities,and plays an important role in China's economic development. This paper studies the development of the Grand Canal Cultural Belt from the perspective of the comprehensive urban carrying capacity,and evaluates the evolution of the comprehensive urban carrying capacity of the Grand Canal Cultural Belt from 2010 to 2017 by constructing the evaluation index system of the comprehensive urban carrying capacity. The spatial and temporal evolution of the comprehensive carrying capacity,8 province and 87 cities in the grand canal cultural zone is analyzed from two dimensions of time and space. The results showed that the comprehensive carrying capacity of cities in the Grand Canal Cultural Belt changed in an "N" type from 2010 to 2017,showing a spatial pattern of high coastal and inland,high southern and low northern. Moreover,municipalities directly under the central government,provincial capitals and cities with strong economy were significantly higher than the surrounding prefecture-level cities. After obtaining Moran's I value through spatial analysis,we found that the comprehensive urban carrying capacity of the Grand Canal Cultural Belt showed a significant positive spatial correlation,with a cluster distribution dominated by "high-high" and "low-low". Finally,we argue that the development of the Grand Canal Cultural Belt should start from the following aspects: strengthening the shortage of comprehensive carrying capacity,strengthening the synergy between cities,and making the central city bigger and stronger,so as to improve the development potential and quality.
表1 大运河文化带评价指标体系Tab.1 Evaluation index system of Grand Canal Cultural Belt |
| 类别 | 指标 | 单位 | 属性 | 最小值 | 最大值 | 均值 | 标准差 | 样本量 |
|---|---|---|---|---|---|---|---|---|
| 经济 | X1-人均财政收入 | 万元 | + | 0.04 | 2.50 | 0.46 | 0.36 | 696 |
| X2-GDP年增长率 | % | + | -0.40 | 18.20 | 9.75 | 2.59 | 696 | |
| X3-二产占比 | % | + | 15.50 | 74.70 | 50.44 | 8.38 | 696 | |
| 环境 | X4-人均污废水排放量 | m3 | - | 14.71 | 245.26 | 74.46 | 36.96 | 696 |
| X5-污水厂污水处理能力 | 万m3/日 | + | 4.00 | 665.60 | 47.07 | 64.58 | 696 | |
| X6-人均日生活用水 | L | - | 47.96 | 339.97 | 150.08 | 47.75 | 696 | |
| X7-人均绿地面积 | m2 | + | 5.22 | 27.90 | 14.14 | 3.91 | 696 | |
| X8-建成区绿化覆盖率 | % | + | 21.89 | 49.97 | 41.23 | 3.58 | 696 | |
| 资源 | X9-国内专利数 | 千个 | + | 0.04 | 106.95 | 8.13 | 14.07 | 696 |
| X10-中小学在校生人数 | 万人 | + | 7.33 | 231.98 | 69.09 | 40.06 | 696 | |
| X11-普通高校学生人数 | 万人 | + | 0.50 | 93.53 | 11.43 | 16.20 | 696 | |
| X12-人均供水量 | t | + | 15.14 | 346.72 | 89.80 | 47.19 | 696 | |
| X13-人均建设用地 | m2 | + | 25.26 | 215.49 | 91.89 | 33.76 | 696 | |
| X14-人均天然气供应量 | m3 | + | 0.16 | 746.65 | 128.97 | 107.71 | 696 | |
| X15-城镇居民人均居住用地面积 | m2 | + | 7.07 | 80.25 | 27.79 | 10.67 | 696 | |
| X16-人均存款 | 万元 | + | 1.04 | 63.55 | 7.52 | 6.97 | 696 | |
| X17-人均贷款 | 万元 | + | 0.65 | 30.18 | 5.30 | 4.95 | 696 | |
| 基础 设施 | X18-每万人病床数 | 张 | + | 18.12 | 83.49 | 41.52 | 9.38 | 696 |
| X19-城市建成区供水管道密度 | km/km2 | + | 2.90 | 62.54 | 13.13 | 7.60 | 696 | |
| X20-公路货运 | t | - | 4.89 | 160.39 | 27.64 | 15.96 | 696 | |
| X21-每万人公共汽车数量 | 辆 | + | 0.44 | 42.01 | 8.93 | 5.13 | 696 | |
| X22-人均城市道路面积 | m2 | + | 1.37 | 46.40 | 20.32 | 6.90 | 696 | |
| X23-人均城市公路里程 | km | + | 0.02 | 0.99 | 0.23 | 0.16 | 696 | |
| X24-人均小客车拥有量 | 辆 | - | 0.02 | 0.31 | 0.11 | 0.06 | 696 | |
| 文化 | X25-每万人图书馆藏书量 | 册 | + | 2.48 | 1 212.36 | 54.94 | 64.99 | 696 |
| X26-重点文物保护单位数量 | 处 | + | 0.00 | 125.00 | 17.91 | 18.49 | 696 | |
| X27-每万人文娱产业从业人员数 | 人 | + | 1.51 | 87.62 | 9.26 | 10.35 | 696 |
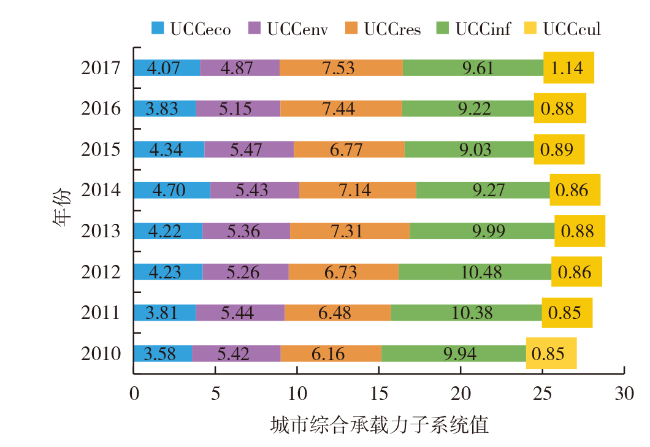
表2 大运河文化带8省(市)子系统城市综合承载力Tab.2 Comprehensive urban carrying capacity of the subsystems of the 8 provinces in the Grand Canal Cultural Belt |
| 类型 | 省(市) | 2010 | 2011 | 2012 | 2013 | 2014 | 2015 | 2016 | 2017 |
|---|---|---|---|---|---|---|---|---|---|
| 经济 | 北京市 | 0.04 | 0.04 | 0.04 | 0.06 | 0.06 | 0.05 | 0.05 | 0.05 |
| 天津市 | 0.08 | 0.08 | 0.08 | 0.07 | 0.08 | 0.08 | 0.07 | 0.04 | |
| 河北省 | 0.38 | 0.41 | 0.44 | 0.38 | 0.48 | 0.42 | 0.38 | 0.44 | |
| 山东省 | 0.67 | 0.69 | 0.79 | 0.78 | 0.90 | 0.80 | 0.69 | 0.77 | |
| 河南省 | 0.62 | 0.74 | 0.76 | 0.82 | 0.88 | 0.81 | 0.73 | 0.75 | |
| 安徽省 | 0.74 | 0.78 | 0.91 | 0.84 | 0.90 | 0.82 | 0.74 | 0.81 | |
| 江苏省 | 0.60 | 0.64 | 0.75 | 0.73 | 0.82 | 0.80 | 0.67 | 0.65 | |
| 浙江省 | 0.45 | 0.44 | 0.45 | 0.54 | 0.59 | 0.56 | 0.51 | 0.55 | |
| 生态 | 北京市 | 0.08 | 0.10 | 0.10 | 0.11 | 0.11 | 0.11 | 0.11 | 0.11 |
| 天津市 | 0.06 | 0.07 | 0.07 | 0.07 | 0.06 | 0.07 | 0.06 | 0.05 | |
| 河北省 | 0.76 | 0.74 | 0.68 | 0.69 | 0.72 | 0.72 | 0.65 | 0.64 | |
| 山东省 | 1.11 | 1.12 | 1.11 | 1.13 | 1.15 | 1.17 | 1.11 | 1.04 | |
| 河南省 | 0.95 | 0.93 | 0.90 | 0.91 | 0.91 | 0.88 | 0.83 | 0.82 | |
| 安徽省 | 1.00 | 1.02 | 0.98 | 1.01 | 1.03 | 1.05 | 1.02 | 0.96 | |
| 江苏省 | 0.83 | 0.81 | 0.78 | 0.81 | 0.82 | 0.85 | 0.79 | 0.75 | |
| 浙江省 | 0.64 | 0.64 | 0.63 | 0.63 | 0.63 | 0.62 | 0.58 | 0.50 | |
| 资源 | 北京市 | 0.22 | 0.22 | 0.21 | 0.23 | 0.24 | 0.24 | 0.24 | 0.24 |
| 天津市 | 0.13 | 0.14 | 0.15 | 0.16 | 0.16 | 0.15 | 0.15 | 0.16 | |
| 河北省 | 0.72 | 0.72 | 0.75 | 0.83 | 0.78 | 0.75 | 0.84 | 0.85 | |
| 山东省 | 1.15 | 1.22 | 1.28 | 1.39 | 1.32 | 1.25 | 1.38 | 1.42 | |
| 河南省 | 0.93 | 0.98 | 1.01 | 1.10 | 1.11 | 1.06 | 1.15 | 1.14 | |
| 安徽省 | 0.87 | 0.91 | 0.95 | 1.07 | 1.06 | 1.03 | 1.13 | 1.15 | |
| 江苏省 | 1.13 | 1.24 | 1.30 | 1.39 | 1.34 | 1.23 | 1.38 | 1.38 | |
| 浙江省 | 1.00 | 1.05 | 1.07 | 1.14 | 1.13 | 1.06 | 1.16 | 1.19 | |
| 基础 设施 | 北京市 | 0.09 | 0.22 | 0.21 | 0.23 | 0.24 | 0.24 | 0.24 | 0.24 |
| 天津市 | 0.12 | 0.14 | 0.15 | 0.16 | 0.16 | 0.15 | 0.15 | 0.16 | |
| 河北省 | 1.21 | 0.72 | 0.75 | 0.83 | 0.78 | 0.75 | 0.84 | 0.85 | |
| 山东省 | 1.90 | 1.22 | 1.28 | 1.39 | 1.32 | 1.25 | 1.38 | 1.42 | |
| 河南省 | 1.65 | 0.98 | 1.01 | 1.10 | 1.11 | 1.06 | 1.15 | 1.14 | |
| 安徽省 | 1.85 | 0.91 | 0.95 | 1.07 | 1.06 | 1.03 | 1.13 | 1.15 | |
| 江苏省 | 1.81 | 1.24 | 1.30 | 1.39 | 1.34 | 1.23 | 1.38 | 1.38 | |
| 浙江省 | 1.32 | 1.05 | 1.07 | 1.14 | 1.13 | 1.06 | 1.16 | 1.19 | |
| 文化 | 北京市 | 0.13 | 0.13 | 0.13 | 0.13 | 0.14 | 0.13 | 0.13 | 0.13 |
| 天津市 | 0.03 | 0.03 | 0.03 | 0.03 | 0.03 | 0.03 | 0.03 | 0.04 | |
| 河北省 | 0.12 | 0.12 | 0.12 | 0.12 | 0.11 | 0.12 | 0.11 | 0.13 | |
| 山东省 | 0.12 | 0.11 | 0.11 | 0.11 | 0.11 | 0.13 | 0.12 | 0.17 | |
| 河南省 | 0.14 | 0.14 | 0.14 | 0.14 | 0.14 | 0.14 | 0.14 | 0.16 | |
| 安徽省 | 0.06 | 0.06 | 0.07 | 0.07 | 0.06 | 0.06 | 0.07 | 0.08 | |
| 江苏省 | 0.13 | 0.12 | 0.14 | 0.14 | 0.13 | 0.14 | 0.14 | 0.20 | |
| 浙江省 | 0.13 | 0.13 | 0.13 | 0.14 | 0.14 | 0.14 | 0.14 | 0.24 |
表3 大运河文化带城市综合承载力的全局Moran's I值Tab.3 Global Moran's I value of the comprehensive carrying capacity of cities in the Grand Canal Cultural Belt |
| 年份 | 2010 | 2011 | 2012 | 2013 | 2014 | 2015 | 2016 | 2017 |
|---|---|---|---|---|---|---|---|---|
| I | 0.096 | 0.080 | 0.088 | 0.088 | 0.083 | 0.085 | 0.094 | 0.090 |
| -0.012 | -0.012 | -0.012 | -0.012 | -0.012 | -0.012 | -0.012 | -0.012 | |
| 0.013 | 0.013 | 0.013 | 0.013 | 0.013 | 0.013 | 0.013 | 0.013 | |
| z | 8.179 | 6.969 | 7.555 | 7.642 | 7.215 | 7.428 | 8.164 | 7.814 |
| p | 0.000 | 0.000 | 0.000 | 0.000 | 0.000 | 0.000 | 0.000 | 0.000 |
| [1] |
|
| [2] |
卫振林, 申金升, 徐一飞. 交通环境容量与交通环境承载力的探讨[J]. 经济地理, 1997, 17(1):97-99.
|
| [3] |
姜文超, 龙腾锐. 水资源承载力理论在城市规划中的应用[J]. 城市规划, 2003(7):78-82.
|
| [4] |
朱一中, 夏军, 王纲胜. 张掖地区水资源承载力多目标情景决策[J]. 地理研究, 2005(5):732-740.
|
| [5] |
叶龙浩, 周丰, 郭怀成, 等. 基于水环境承载力的沁河流域系统优化调控[J]. 地理研究, 2013, 32(6):1007-1 016.
|
| [6] |
李姣, 严定容. 湖南省及洞庭湖区重点城市水环境承载力研究[J]. 经济地理, 2013, 33(10):157-162.
|
| [7] |
李焕, 黄贤金, 金雨泽, 等. 长江经济带水资源人口承载力研究[J]. 经济地理, 2017, 37(1):181-186.
|
| [8] |
熊建新, 陈端吕, 谢雪梅. 基于状态空间法的洞庭湖区生态承载力综合评价研究[J]. 经济地理, 2012, 32(11):138-142.
|
| [9] |
熊建新, 彭保发, 陈端吕, 等. 洞庭湖区生态承载力时空演化特征[J]. 地理研究, 2013, 32(11):2 031-2 040.
|
| [10] |
熊建新, 陈端吕, 彭保发, 等. 洞庭湖区生态承载力时空动态模拟[J]. 经济地理, 2016, 36(4):164-172.
|
| [11] |
向秀容, 潘韬, 吴绍洪, 等. 基于生态足迹的天山北坡经济带生态承载力评价与预测[J]. 地理研究, 2016, 35(5):875-884.
|
| [12] |
祝秀芝, 李宪文, 贾克敬, 等. 上海市土地综合承载力的系统动力学研究[J]. 中国土地科学, 2014, 28(2):90-96.
|
| [13] |
刘凯, 任建兰, 张理娟, 等. 人地关系视角下城镇化的资源环境承载力响应——以山东省为例[J]. 经济地理, 2016, 36(9):77-84.
|
| [14] |
刘蕾, 周策, 张永芳. 京津冀协同发展视阈下土地综合承载力地区分异研究[J]. 广西社会科学, 2016(5):84-89.
|
| [15] |
岳文泽, 代子伟, 高佳斌, 等. 面向省级国土空间规划的资源环境承载力评价思考[J]. 中国土地科学, 2018, 32(12):66-73.
|
| [16] |
靳亚亚, 靳相木, 李陈. 基于承压施压耦合曲线的城市土地承载力评价——以浙江省个城市为例[J]. 地理研究, 2018, 37(6):1087-1 099.
|
| [17] |
刘惠敏. 长江三角洲城市群综合承载力的时空分异研究[J]. 中国软科学, 2011(10):114-122.
|
| [18] |
孔凡文, 刘亚臣, 常春光. 城市综合承载力的内涵及测算思路[J]. 城市问题, 2012(1):26-29.
|
| [19] |
程广斌, 申立敬, 龙文. 丝绸之路经济带背景下西北城市群综合承载力比较[J]. 经济地理, 2015, 35(8):98-103.
|
| [20] |
姜豪, 陈灿平. 城市综合承载力研究——以成都为例[J]. 软科学, 2016, 30(12):59-62.
|
| [21] |
刘晶, 林琳. 长江生态经济区城市群综合承载力的实证分析[J]. 统计与决策, 2018, 34(17):94-97.
|
| [22] |
王振坡, 朱丹, 王丽艳. 区域协同下京津冀城市群城市综合承载力评价[J]. 首都经济贸易大学学报, 2018, 20(6):73-81.
|
| [23] |
|
| [24] |
|
| [25] |
|
| [26] |
|
| [27] |
|
| [28] |
|
| [29] |
|
| [30] |
|
| [31] |
|
| [32] |
单霁翔. 从“功能城市”走向“文化城市”[M]. 天津: 天津大学出版社, 2007.
|
| [33] |
|
| [34] |
孙久文, 易淑昶. 大运河文化带建设与中国区域空间格局重塑[J]. 南京社会科学, 2019(1):11-16,33.
|
/
| 〈 |
|
〉 |