
西北内陆中心城市生产性服务企业空间格局演变与区位选择——以兰州市为例
|
公维民(1992—),男,山东淄博人,博士研究生,研究方向为城市与区域规划。E-mail:13993182790@163.com |
收稿日期: 2020-03-01
修回日期: 2020-09-05
网络出版日期: 2025-04-01
基金资助
国家自然科学基金项目(41161028)
国家自然科学基金项目(41961029)
Spatial Pattern Evolution and Location Selection of Producer Service Enterprises in the Central Cities of Northwest Inland:A Case Study of Lanzhou City
Received date: 2020-03-01
Revised date: 2020-09-05
Online published: 2025-04-01
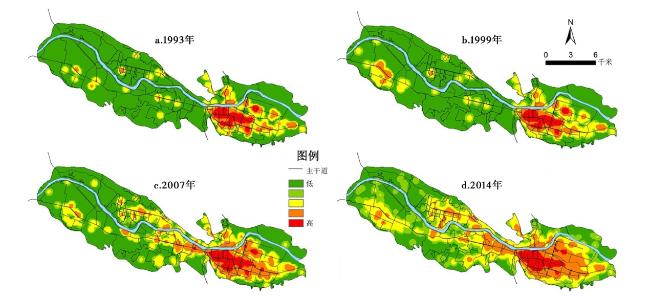
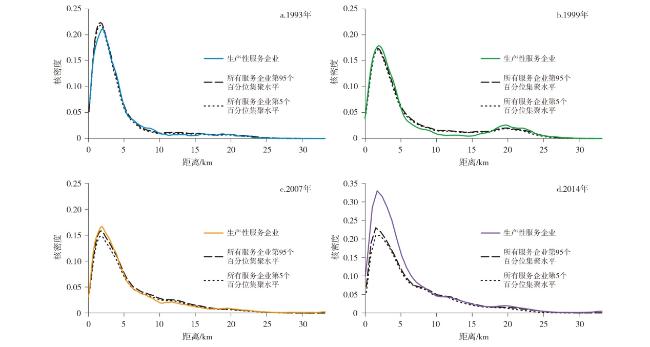
生产性服务业作为转型期策动我国城市经济增长的重要力量和体现城市经济职能的主要方面,其企业区位选择已成为从微观视角解析城市空间结构演变的重要途径。以西北内陆中心城市——兰州市为案例区,将生产性服务企业作为研究对象,运用核密度方法分析了兰州市生产性服务企业空间格局演变过程与集聚特征,并通过条件Logit模型探究了其区位选择的影响因素。结果表明:①生产性服务企业的空间分布经历了“集中—分散—分散式集中”的过程,逐渐形成了以城市中心区域为主体,外围地区为补充多中心组团式的空间格局;②从行业集聚的变化特征来看,集聚峰值处的距离和强度分别呈现先增后减和先减后增的变化趋势,集聚范围不断增大,出现多个核心集聚区域。③集聚效益、基础设施、空间距离、政策规划以及技术创新环境对生产性服务企业的区位选择起到了正向吸引作用,其中以集聚效益、政策规划以及技术创新因素的影响最为显著,成为生产性服务企业进行区位选择时考虑的首要因素。④从不同行业类型来看,以商务服务业、交通运输业、房地产服务业为代表的传统生产性服务企业的区位选择主要受到土地价格和基础设施因素的影响,而以金融服务业、信息服务业、科技服务业为代表的现代生产性服务企业则更加关注备选区位的企业集聚效益和技术创新因素,同时政策规划因素也对现代生产性服务企业的区位选择起到了一定的引导作用。
公维民 , 张志斌 . 西北内陆中心城市生产性服务企业空间格局演变与区位选择——以兰州市为例[J]. 经济地理, 2021 , 41(2) : 82 -91 . DOI: 10.15957/j.cnki.jjdl.2021.02.009
The producer service is an important force that instigates the economic growth of Chinese cities and the main aspect of the city's economic functions during the transition period. The location choice of enterprises has become an important way to analyze the evolution of urban spatial structure from a micro perspective. Taking the northwest inland central city—Lanzhou City as the case area,the paper analyzes the evolution process and agglomeration characteristics of the spatial pattern for the producer services enterprises in Lanzhou applying the kernel density method,and explores the influencing factors of location selection using the Logit model. The results suggest: 1) The spatial distribution of the producer service enterprises go through the process of "concentration-decentralization-decentralized concentration" and gradually form multi-center spatial pattern which is made up of the main areas (urban central areas) and the additional areas (peripheral areas). 2) From the perspective of the changing characteristics of industry agglomeration,contrary to the intensity,the distance at the peak of agglomeration increases firstly and then decreases. As agglomeration areas expand,multiple-core agglomeration areas emerge. 3) Agglomeration benefits,infrastructure,spatial distance,policy planning and technological innovation environment play a positive role in the location selection of productive service enterprises. Among them,agglomeration benefits,policy planning and technological innovation have more remarkable impact on the location selection of producer service enterprises. 4) From the perspective of different types of industries,the location choices of traditional producer service enterprises,such as business services,transportation and real estate services,are mainly affected by land prices and infrastructure factors,while modern producer service enterprises,such as the financial service industry,the information service industry and the technology service industry,attach more importance to the agglomeration efficiency and technological innovation of the enterprises in alternative locations. At the same time,policy planning also guides the location selection of modern producer service enterprises to a certain extent.
图2 1993—2014年兰州市生产性服务企业空间集聚特征Fig.2 Spatial agglomeration characteristics of producer service enterprises in Lanzhou from 1993 to 2014 |
表1 1993—2014年兰州市生产性服务企业空间集聚特征比较Tab.1 Comparison of spatial agglomeration characteristics of producer service enterprises in Lanzhou from 1993 to 2014 |
| 1993 | 1999 | 2007 | 2014 | |
|---|---|---|---|---|
| 集聚范围(km) | 6.36~9.67 | 0~4.32,16.84~23.26 | 0~4.65,17.92~24.26 | 0~8.63,16.89~30 |
| 峰值距离(km) | 1.98 | 2.16 | 2.22 | 1.84 |
| 峰值集聚强度 | 0.23 | 0.18 | 0.16 | 0.33 |
表2 解释变量定义及预期影响Tab.2 Definition of explanatory variables and expected effects |
| 变量 | 变量含义 | 预期影响 | |
|---|---|---|---|
| 因变量 | |||
| 企业区位 | 企业区位(loc) | 1=企业所选的区位,0=企业拒绝的区位 | |
| 解释变量 | |||
| 地方化经济 | 企业数量(firm) | 备选区位已有该行业企业数量(取对数) | + |
| 集聚效益(aggl) | 备选区位2014年拥有该行业企业的个数(个)(取对数) | + | |
| 城市化经济 | 城市化率(rate) | 备选区位的非农人口占年末总人口比重(%) | + |
| 人口密度(popudens) | 备选区位内每平方千米的人口数(人/km2)(取对数) | + | |
| 土地价格 | 商业基准地价(lanprice) | 1=一级地价,2=二级地价,3=三级地价,4=四级地价5=五级地价, 6=六级地价(取对数) | + |
| 劳动力资源 | 就业适龄人口(wap) | 备选区位每平方千米范围内15~64岁的人口数(人/km2)(取对数) | + |
| 本行业从业人员(workers) | 备选区位从事该行业的从业人员数(人)(取对数) | + | |
| 基础设施 | 路网密度(roaddens) | 备选区位的道路密度(km/km2)(取对数) | - |
| 空间距离 | 距城市中心距离(center) | 备选区位到城市中心的直线距离(km)(取对数) | - |
| 距最近轨道交通站点距离(railway) | 备选区位距最近火车站、地铁站的直线距离(km)(取对数) | - | |
| 距最近主干道距离(road) | 备选区位距最近城市主干道的直线距离(km)(取对数) | - | |
| 技术创新 | 距最近高校和科研院所的直线距离(university) | 备选区位距最近高校和科研院所的直线距离(km) | - |
| 政策规划 | 有无开发区或产业园区(development zone) | 位于开发区的街道赋值为1,其他街道赋值为0 | + |
| 是否位于城市规划中心区域(planning center area) | 位于规划中心区域的区位赋值为1,其他区位赋值为0 | + | |
表3 兰州市生产性服务业企业区位选择的条件Logit模型估计结果Tab.3 Results of the Logit model estimation of location selection of producer service enterprises in Lanzhou |
| 模型1 生产性服务业 | 模型2 科技服务业 | 模型3 信息服务业 | 模型4 金融服务业 | 模型5 房地产服务业 | 模型6 商务服务业 | 模型7 交通运输业 | |
|---|---|---|---|---|---|---|---|
| Firm | 0.142(0.996) | 0.031(0.218) | -0.026(0.719) | 0.595**(0.041) | 0.070(0.387) | -0.017(0.626) | 0.0143(0.224) |
| Aggl | 0.149***(0.006) | 0.061**(0.036) | 0.131***(0.004) | -0.484**(0.036) | 0.076(0.327) | -0.012(0.672) | -0.088(0.115) |
| Rate | 0.035(0.311) | 0.023(0.651) | 0.014(0.775) | 0.026**(0.012) | 0.047**(0.071) | 0.361**(0.034) | 0.012(0.761) |
| Popudens | 0.882(0.272) | 2.016(0.158) | -0.821(0.469) | 4.864(0.267) | 0.783(0.151) | 0.428(0.214) | 1.303**(0.032) |
| Landprice | -0.369*(0.029) | 4.144(0.111) | -0.089(0.968) | -0.889(0.669) | 2.557(0.139) | -0.031(0.176) | -1.873***(0.009) |
| WAP | 0.035(0.276) | -5.126(0.101) | 2.361(0.296) | 1.351*(0.076) | -2.879(0.324) | 0.403**(0.031) | 0.936*(0.091) |
| Workers | 0.124*(0.086) | 1.670(0.262) | 1.088(0.271) | 4.073(0.106) | 1.630(0.178) | 2.039(0.373) | 0.228**(0.035) |
| Roaddens | 0.561***(0.003) | 0.026(0.135) | 1.439(0.375) | 2.947(0.149) | 0.782(0.642) | 1.085***(0.007) | -0.040(0.965) |
| Center | -1.970**(0.049) | -0.639(0.642) | -0.268(0.886) | -0.852***(0.005) | -0.583***(0.010) | -1.207***(0.005) | 2.509*(0.086) |
| Railway | 0.259(0.679) | -0.001(0.999) | -1.509(0.187) | 0.010(0.994) | -2.051(0.171) | 0.236(0.861) | -0.086**(0.022) |
| Road | -1.332**(0.024) | -0.594(0.581) | -0.542(0.609) | -0.723(0.560) | -0.659**(0.032) | -0.743*(0.055) | -0.223***(0.005) |
| University | -1.103***(0.008) | -3.452***(0.006) | -1.324**(0.049) | -0.164(0.170) | -2.714(0.157) | -0.896(0.190) | 0.446(0.624) |
| DZ | 2.280***(0.003) | 1.164**(0.028) | 2.829***(0.002) | 2.714(0.119) | -1.008(0.579) | -6.908(0.145) | 0.882(0.530) |
| Planning | 4.430***(0.005) | 0.155(0.954) | -0.350(0.908) | -6.660(0.180) | 5.186(0.178) | 0.805(0.135) | 0.384(0.817) |
| Log-likehood | -2 297.2 | -1 475.4 | -1 424.9 | -1 065.2 | -1 327.7 | -944.6 | -1834.5 |
| Rseudo R2 | 0.5983 | 0.3713 | 0.3954 | 0.3155 | 0.4960 | 0.3703 | 0.5812 |
| 样本数量 | 2105 | 150 | 685 | 126 | 204 | 791 | 149 |
注:括号内数据为z检验值,*、**和***分别表示在10%、5%和1%统计水平上显著。 |
| [1] |
席强敏, 李国平. 京津冀生产性服务业空间分工特征及溢出效应[J]. 地理学报, 2015, 70(12):1926-1938.
|
| [2] |
杨帆. 生产性服务业发展的动力机制与空间效应研究进展[J]. 地理科学进展, 2018, 37(6):14-24.
|
| [3] |
甄峰, 刘慧, 郑俊. 城市生产性服务业空间分布研究:以南京为例[J]. 世界地理研究, 2008, 17(1):24-31.
|
| [4] |
|
| [5] |
|
| [6] |
|
| [7] |
|
| [8] |
|
| [9] |
|
| [10] |
|
| [11] |
|
| [12] |
|
| [13] |
|
| [14] |
|
| [15] |
|
| [16] |
|
| [17] |
|
| [18] |
|
| [19] |
|
| [20] |
|
| [21] |
|
| [22] |
薛东前, 石宁, 公晓晓. 西安市生产者服务业空间布局特征与集聚模式研究[J]. 地理科学, 2011, 31(10):1195-1201.
|
| [23] |
邱灵, 方创琳. 北京市生产性服务业空间集聚综合测度[J]. 地理研究, 2013, 32(1):99-110.
|
| [24] |
陈红霞. 北京市生产性服务业空间分布与集聚特征的演变[J]. 经济地理, 2018, 38(5):108-116.
|
| [25] |
宋昌耀, 罗心然, 席强敏. 超大城市生产性服务业空间分工及其效应分析——以北京为例[J]. 地理科学, 2018, 38(12):101-109.
|
| [26] |
张文忠. 大城市服务业区位理论及其实证研究[J]. 地理研究, 1999, 18(3):273-281.
|
| [27] |
万千欢, 千庆兰, 陈颖彪. 广州市生产性服务业影响因素研究[J]. 经济地理, 2014, 34(1):89-93.
|
| [28] |
唐晓华, 张欣珏, 李阳. 中国制造业与生产性服务业动态协调发展实证研究[J]. 经济研究, 2018(3):79-93.
|
| [29] |
简晓彬, 陈伟博. 生产性服务业发展与制造业价值链攀升——以江苏为例[J]. 华东经济管理, 2016, 30(7):29-34.
|
| [30] |
余泳泽, 刘大勇, 宣烨. 生产性服务业集聚对制造业生产效率的外溢效应及其衰减边界——基于空间计量模型的实证分析[J]. 金融研究, 2016(2):23-36.
|
| [31] |
申玉铭, 邱灵, 尚于力. 京沪生产性服务业比较研究[J]. 地理研究, 2009, 28(2):441-450.
|
| [32] |
邵晖. 北京市生产者服务业聚集特征[J]. 地理学报, 2010, 63(12):1289-1298.
|
| [33] |
赵群毅, 周一星. 北京都市区生产者服务业的空间结构——兼与西方主流观点的比较[J]. 城市规划, 2007(5):24-31.
|
| [34] |
|
| [35] |
|
| [36] |
肖琛, 陈雯, 袁丰. 大城市内部连锁超市空间分布格局及其区位选择——以南京市苏果超市为例[J]. 地理研究, 2013, 32(3):465-475.
|
| [37] |
李佳洺, 张文忠, 李业锦. 基于微观企业数据的产业空间集聚特征分析——以杭州市区为例[J]. 地理研究, 2016, 35(1):95-107.
|
| [38] |
|
| [39] |
吕卫国, 陈雯. 制造业企业区位选择与南京城市空间重构[J]. 地理学报, 2009(2):142-152.
|
| [40] |
余珮, 孙永平. 集聚效应对跨国公司在华区位选择的影响[J]. 经济研究, 2011(1):73-84.
|
| [41] |
赵浚竹, 李国平, 孙铁山. 中国汽车制造业集聚与企业区位选择[J]. 地理学报, 2014, 69(6):850-862.
|
| [42] |
王俊松. 集聚经济与中国制造业新企业区位选择[J]. 哈尔滨工业大学学报:社会科学版, 2011, 13(6):19-26.
|
| [43] |
韩会然, 杨成凤, 宋金平. 北京批发企业空间格局演化与区位选择因素[J]. 地理学报, 2018, 73(2):219-231.
|
| [44] |
贺灿飞, 魏后凯. 信息成本、集聚经济与中国外商投资区位[J]. 中国工业经济, 2001(9):38-45.
|
| [45] |
孙斌栋, 汪明峰, 张文新. 中国城市经济空间[M]. 北京: 科学出版社, 2018.
|
| [46] |
宁越敏. 上海市区商业中心区位的探讨[J]. 地理学报, 1984, 51(2):163-172.
|
/
| 〈 |
|
〉 |