
长株潭核心区土地利用变化时空格局及驱动力多维分析
|
李毅(1979—),男,湖南耒阳人,博士,讲师,硕士生导师,研究方向为生态经济、城市代谢与可持续发展。E-mail:yibsen@163.com |
收稿日期: 2020-05-27
修回日期: 2021-04-20
网络出版日期: 2025-03-31
基金资助
湖南省自然科学基金项目(2018JJ3247)
湖南省自然科学基金项目(2020JJ5265)
湖南省自然科学基金项目(2021JJ30368)
湖南省社会科学成果评审委员会一般项目(XSP20YBC402)
Spatio-temporal Pattern of Land Use Change in Changsha-Zhuzhou-Xiangtan Core Areas and Its Driving Forces
Received date: 2020-05-27
Revised date: 2021-04-20
Online published: 2025-03-31
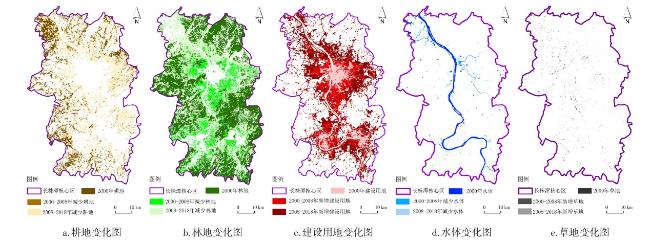
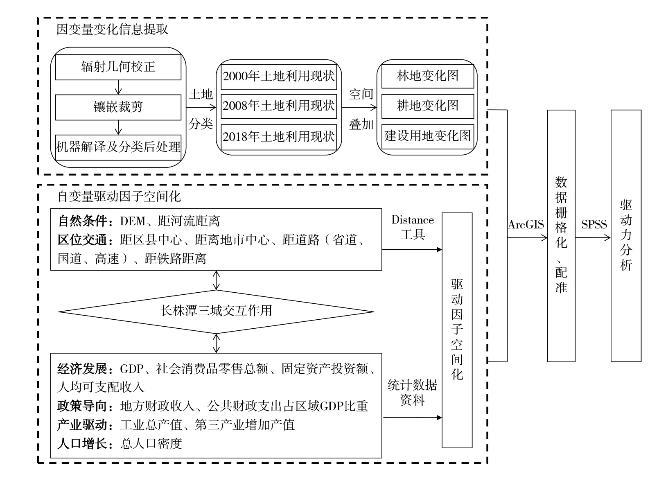
以长株潭城市群中开发强度最大的长株潭核心区作为研究对象,利用GIS和计量分析工具分析长株潭核心区2000—2018年土地利用变化的时空特征,从自然环境、区位交通、经济发展、政策导向、产业驱动、人口增长等六大维度,以及城市交互作用等方面研究土地利用变化驱动机制,采用Logistic回归模型探究各地类变化的驱动因子,研究结果表明:①2000—2018年,耕地减少324.96 km2、林地减少855.47 km2,建设用地增长1 161.87 km2,草地与水体面积总体保持稳定并略有变动。②2000—2008与2008—2018年两期耕地、林地、建设用地变化驱动因子存在较大差异。③自然环境(DEM、河流水系)是耕地、林地和建设用地变化的基础条件,从根本上决定着三种地类变化的空间形态;区位交通中公路、铁路等交通网络的延伸,扩大了三种地类变化的范围;经济发展、政策导向、产业发展、人口增长加快了三种地类变化的速度。④城市交互作用强度有效反映了各种地类变化,特别是建设用地变化的趋势,这表明城市交互作用强度是除六大维度外的第七大影响因素。
李毅 , 肖腊梅 , 胡文敏 , 易敏 , 谢宜章 . 长株潭核心区土地利用变化时空格局及驱动力多维分析[J]. 经济地理, 2021 , 41(7) : 173 -182 . DOI: 10.15957/j.cnki.jjdl.2021.07.19
Taking Changsha-Zhuzhou-Xiangtan core area as an example,it applies GIS and quantitative analysis to analyze the temporal and spatial characteristics of land use change between 2000 and 2018 in Changsha-Zhuzhou-Xiangtan core area,and builds an index system of land use change and driving force from the perspective of natural environment,regional traffic,economic development,policy orientation,industry drive,population growth and urban interaction. Based on the GIS and Logistic regression model,it explores driving factors of different land type. The results are as follows: 1) Cultivated land was reduced by 324.96 km2 in 2000-2018,forestland by 855.47 km2,but construction land was increased by 1 161.87 km2. The grasslands and water areas remain stable as a whole with a slight change. 2) During two periods from 2000 to 2008 and 2008 to 2018,it exhibits significant difference in the driving factors of different land use change(cultivated land,forest land and construction land). 3) Nature environment (DEM and river system) is fundamental condition for changes of cultivated land,forestland and construction land,determine the spatial form of those three kind of lands. Extension of transport network such as highway and railway enlarges the changing range of those three kind of lands. Economic development,policy orientation,industrial development and population growth have accelerated the pace of changes in three land categories. 4) The strength of urban interaction can effectively reflect the change trend of various land types,especially the change of construction land,which indicates that the strength of urban interaction is the seventh important influencing factor besides six factors above.
表1 自变量与因变量GIS数据库Tab.1 GIS database of independent variable and dependent variable |
| 变量 | 指标 | 栅格类型 | 赋值/单位/描述 | |
|---|---|---|---|---|
| 因变量 | 耕地变化(2000—2008、2008—2018年) | 两分类 | 0或1 | |
| 林地变化(2000—2008、2008—2018年) | 两分类 | 0或1 | ||
| 建设用地变化(2000—2008、2008—2018年) | 两分类 | 0或1 | ||
| 自变量 | 自然环境 | DEM(x1) | 连续型 | m |
| 距河流距离(x2) | 连续型 | km | ||
| 区位交通 | 距区县中心距离(x3) | 连续型 | km | |
| 距地市中心距离(x4) | 连续型 | km | ||
| 距道路(省道、国道、高速)距离(x5) | 连续型 | km | ||
| 距铁路距离(x6) | 连续型 | km | ||
| 经济发展 | GDP(x7) | 连续型 | 万元 | |
| 社会消费品零售总额(x8) | 连续型 | 万元 | ||
| 固定资产投资额(x9) | 连续型 | 万元 | ||
| 人均可支配收入(x10) | 连续型 | 元/人 | ||
| 政策导向 | 地方财政收入(x11) | 连续型 | 万元 | |
| 公共财政支出占区域GDP比重(x12) | 连续型 | 万元 | ||
| 产业驱动 | 工业总产值(x13) | 连续型 | 万元 | |
| 第三产业增加值(x14) | 连续型 | 万元 | ||
| 人口增长 | 总人口密度(x15) | 连续型 | 人/km2 | |
表2 遥感卫星影像信息一览表Tab.2 List of remote sensing satellite image information |
| 影像时期 | 日期 | 行列号 | 数据类型 | 云量(%) |
|---|---|---|---|---|
| 2000 | 2000-09-13 | 123/040 | Landsat 5 TM | 2.20 |
| 2000-09-13 | 123/041 | Landsat 5 TM | 5.00 | |
| 2008 | 2008-09-19 | 123/040 | Landsat 5 TM | 5.00 |
| 2008-09-19 | 123/041 | Landsat 5 TM | 1.00 | |
| 2018 | 2018-07-29 | 123/040 | Landsat 8 OLI_TIRS | 12.16 |
| 2018-07-29 | 123/041 | Landsat 8 OLI_TIRS | 2.79 |
表3 研究区2000—2018年各地类变化情况Tab.3 The change of land use type from 2000 to 2018 in Changsha-Zhuzhou-Xiangtan core region |
| 地类 | 面积(km2) | 年变化率(%) | |||||
|---|---|---|---|---|---|---|---|
| 2000 | 2008 | 2018 | 2000—2008 | 2008—2018 | 2000—2018 | ||
| 耕地 | 1 136.66 | 1 013.54 | 811.70 | -1.52 | -1.99 | -1.58 | |
| 林地 | 2 901.79 | 2 602.25 | 2 046.32 | -1.44 | -2.14 | -1.64 | |
| 草地 | 18.63 | 26.16 | 44.80 | 3.60 | 7.12 | 7.80 | |
| 水体 | 196.01 | 156.05 | 188.40 | -3.20 | 2.07 | -0.22 | |
| 建设用地 | 346.21 | 801.30 | 1 508.08 | 7.10 | 8.82 | 18.64 | |
| 合计 | 4 599.30 | 4 599.30 | 4 599.30 | ||||
表4 研究区2000—2018年耕地变化模型估计结果Tab.4 Estimation results of cultivated land change model in the study area from 2000 to 2018 |
| 时间段 | 自变量 | 回归系数(β) | 标准误差(SE) | Wald统计量 | 自由度(df) | 显著水平(p) | 发生比(OR) |
|---|---|---|---|---|---|---|---|
| 第1期 2000—2008 HL=14.03 p=0.09 | DEM(x1) | -1.70 | 0.68 | 6.22 | 1 | 0.01 | 0.18 |
| 距河流距离(x2) | -1.86 | 0.38 | 24.37 | 1 | 0.00 | 0.16 | |
| 距区县中心距离(x3) | -2.93 | 0.33 | 77.74 | 1 | 0.00 | 0.05 | |
| 距地市中心距离(x4) | -0.91 | 0.28 | 10.33 | 1 | 0.00 | 0.40 | |
| 距铁路距离(x6) | -0.50 | 0.22 | 5.20 | 1 | 0.02 | 0.61 | |
| GDP(x7) | 0.36 | 0.16 | 5.23 | 1 | 0.02 | 1.43 | |
| 社会消费品零售总额(x8) | 1.78 | 0.23 | 60.98 | 1 | 0.00 | 5.92 | |
| 人均可支配收入(x10) | 1.08 | 0.23 | 22.32 | 1 | 0.00 | 0.34 | |
| 地方财政收入(x11) | 0.38 | 0.17 | 5.14 | 1 | 0.02 | 0.68 | |
| 公共财政支出占区域GDP比重(x12) | 0.28 | 0.16 | 3.03 | 1 | 0.08 | 1.33 | |
| 工业总产值(x13) | 0.70 | 0.25 | 8.07 | 1 | 0.00 | 2.01 | |
| 总人口密度(x15) | 2.91 | 0.12 | 566.86 | 1 | 0.00 | 18.42 | |
| 常数项 | -0.61 | 0.12 | 27.40 | 1 | 0.00 | 0.59 | |
| 第2期 2008—2018 HL=12.20 p=0.16 | DEM(x1) | -2.76 | 0.55 | 24.93 | 1 | 0.00 | 0.06 |
| 距河流距离(x2) | -2.27 | 0.23 | 100.03 | 1 | 0.00 | 0.10 | |
| 距区县中心距离(x3) | -1.82 | 0.27 | 43.25 | 1 | 0.00 | 0.16 | |
| 距铁路距离(x6) | -1.53 | 0.16 | 91.00 | 1 | 0.00 | 0.21 | |
| GDP(x7) | 1.78 | 0.37 | 23.40 | 1 | 0.00 | 5.95 | |
| 社会消费品零售总额(x8) | 1.53 | 0.22 | 47.26 | 1 | 0.00 | 0.21 | |
| 地方财政收入(x11) | 1.92 | 0.27 | 52.23 | 1 | 0.00 | 0.16 | |
| 工业总产值(x13) | 2.04 | 0.25 | 66.17 | 1 | 0.00 | 7.69 | |
| 第三产业增加值(x14) | 1.41 | 0.19 | 56.73 | 1 | 0.00 | 4.10 | |
| 总人口密度(x15) | 0.53 | 0.26 | 4.31 | 1 | 0.03 | 1.70 | |
| 常数项 | -0.81 | 0.10 | 60.89 | 1 | 0.00 | 0.50 |
注:HL为模型拟合优度指标;p为变量发生概率,以下略。 |
表5 研究区2000—2018年林地变化模型估计结果Tab.5 Estimation results of forest land change model in the study area from 2000 to 2018 |
| 时间段 | 自变量 | 回归系数(β) | 标准误差(SE) | Wald统计量 | 自由度(df) | 显著水平(p) | 发生比(OR) |
|---|---|---|---|---|---|---|---|
| 第1期 2000—2008 HL=12.45 p=0.14 | DEM(x1) | -0.90 | 0.44 | 4.17 | 1 | 0.03 | 0.31 |
| 距河流距离(x2) | -1.29 | 0.30 | 18.05 | 1 | 0.00 | 0.27 | |
| 距区县中心距离(x3) | -2.44 | 0.31 | 60.88 | 1 | 0.00 | 0.08 | |
| 距地市中心距离(x4) | -1.31 | 0.26 | 26.07 | 1 | 0.00 | 0.27 | |
| 距道路(省道、国道、高速)距离(x5) | -0.47 | 0.24 | 3.98 | 1 | 0.04 | 0.63 | |
| 距铁路距离(x6) | -0.82 | 0.21 | 15.88 | 1 | 0.00 | 0.44 | |
| 社会消费品零售总额(x8) | 1.18 | 0.21 | 30.33 | 1 | 0.00 | 3.24 | |
| 固定资产投资额(x9) | 0.86 | 0.12 | 53.62 | 1 | 0.00 | 2.37 | |
| 人均可支配收入(x10) | 0.97 | 0.23 | 17.33 | 1 | 0.00 | 0.71 | |
| 地方财政收入(x11) | 0.29 | 0.15 | 3.97 | 1 | 0.04 | 1.34 | |
| 工业总产值(x13) | 0.34 | 0.07 | 23.32 | 1 | 0.00 | 2.64 | |
| 总人口密度(x15) | 0.46 | 0.22 | 4.33 | 1 | 0.03 | 0.63 | |
| 常数项 | 0.33 | 0.10 | 9.26 | 1 | 0.00 | 1.39 | |
| 第2期 2008—2018 HL=11.34 p=0.19 | DEM(x1) | -3.69 | 0.35 | 114.49 | 1 | 0.00 | 0.03 |
| 距河流距离(x2) | -0.33 | 0.17 | 3.80 | 1 | 0.05 | 0.72 | |
| 距区县中心距离(x3) | -1.91 | 0.20 | 92.30 | 1 | 0.00 | 0.15 | |
| 距地市中心距离(x4) | -1.08 | 0.15 | 51.90 | 1 | 0.00 | 0.34 | |
| 距道路(省道、国道、高速)距离(x5) | -0.47 | 0.14 | 11.14 | 1 | 0.00 | 0.63 | |
| 距铁路距离(x6) | -0.41 | 0.12 | 11.56 | 1 | 0.00 | 0.66 | |
| GDP(x7) | 0.66 | 0.20 | 11.39 | 1 | 0.00 | 1.94 | |
| 社会消费品零售总额(x8) | 0.86 | 0.18 | 24.26 | 1 | 0.00 | 2.37 | |
| 固定资产投资额(x9) | 0.93 | 0.14 | 45.04 | 1 | 0.00 | 2.53 | |
| 地方财政收入(x11) | 1.36 | 0.21 | 43.82 | 1 | 0.00 | 3.91 | |
| 工业总产值(x13) | 0.43 | 0.16 | 7.16 | 1 | 0.00 | 0.65 | |
| 常数项 | -0.04 | 0.06 | 0.50 | 1 | 0.50 | 0.95 |
表6 研究区2000—2018年建设用地变化模型估计结果Tab.6 Estimation results of construction land change model in the study area from 2000 to 2018 |
| 时间段 | 自变量 | 回归系数(β) | 标准误差(SE) | Wald统计量 | 自由度(df) | 显著水平(p) | 发生比(OR) |
|---|---|---|---|---|---|---|---|
| 第1期 2000—2008 HL=12.37 P=0.18 | DEM(x1) | -0.89 | 0.43 | 4.28 | 1 | 0.03 | 0.30 |
| 距河流距离(x2) | -1.29 | 0.30 | 18.05 | 1 | 0.00 | 0.28 | |
| 距区县中心距离(x3) | -2.45 | 0.31 | 60.88 | 1 | 0.00 | 0.09 | |
| 距地市中心距离(x4) | -1.31 | 0.26 | 26.07 | 1 | 0.00 | 0.27 | |
| 距道路(省道、国道、高速)距离(x5) | -0.47 | 0.24 | 3.98 | 1 | 0.04 | 0.63 | |
| 距铁路距离(x6) | -0.82 | 0.21 | 15.89 | 1 | 0.00 | 0.44 | |
| 社会消费品零售总额(x8) | 1.46 | 0.14 | 111.16 | 1 | 0.00 | 4.31 | |
| 固定资产投资额(x9) | 0.86 | 0.12 | 53.62 | 1 | 0.00 | 2.37 | |
| 人均可支配收入(x10) | 0.46 | 0.22 | 4.33 | 1 | 0.03 | 0.63 | |
| 工业总产值(x13) | 0.29 | 0.15 | 3.97 | 1 | 0.04 | 1.34 | |
| 第三产业增加值(x14) | 0.34 | 0.07 | 23.32 | 1 | 0.00 | 2.64 | |
| 总人口密度(x15) | 0.97 | 0.23 | 17.33 | 1 | 0.00 | 0.71 | |
| 常数 | 0.15 | 0.13 | 1.20 | 1 | 0.27 | 1.16 | |
| 第2期 2008—2018 HL=13.14 p=0.12 | DEM(x1) | 1.64 | 0.27 | 38.17 | 1 | 0.00 | 5.15 |
| 距区县中心距离(x3) | -0.75 | 0.16 | 22.53 | 1 | 0.00 | 0.47 | |
| 距地市中心距离(x4) | -0.39 | 0.20 | 3.80 | 1 | 0.05 | 0.68 | |
| GDP(x7) | 1.17 | 0.20 | 34.05 | 1 | 0.00 | 0.31 | |
| 社会消费品零售总额(x8) | 0.53 | 0.14 | 14.09 | 1 | 0.00 | 1.69 | |
| 人均可支配收入(x10) | 0.39 | 0.11 | 13.03 | 1 | 0.00 | 1.47 | |
| 工业总产值(x13) | 1.31 | 0.12 | 128.84 | 1 | 0.00 | 3.72 | |
| 第三产业增加值(x14) | 0.97 | 0.15 | 43.46 | 1 | 0.00 | 2.65 | |
| 总人口密度(x15) | 1.02 | 0.21 | 23.99 | 1 | 0.00 | 0.36 | |
| 常数 | -1.36 | 0.09 | 198.90 | 1 | 0.00 | 0.26 |
表7 长沙—株洲—湘潭三市2000、2008和2018年交互作用相关变量Tab.7 Interaction related variables of Changsha-Zhuzhou-Xiangtan in 2000, 2008 and 2018 |
| 城市 | 2000 | 2008 | 2018 | 距离(km)/交互作用强度 | ||||||||
|---|---|---|---|---|---|---|---|---|---|---|---|---|
| 总人口 (万人) | 工业增加值(亿元) | 总人口 (万人) | 工业增加值(亿元) | 总人口 (万人) | 工业增加值(亿元) | 长沙* | 株洲** | 湘潭*** | ||||
| 长沙 | 583.19 | 620.49 | 645.14 | 1567.41 | 815.47 | 4 660.19 | 26/4265.67 10/29769.59 3/335791.60 | |||||
| 株洲 | 370.09 | 116.76 | 381.15 | 497.20 | 402.08 | 1 149.20 | 23/5436.82 15/29183.71 7/189304.88 | |||||
| 湘潭 | 280.00 | 121.40 | 293.99 | 298.11 | 286.49 | 932.10 | 10/3832.56 5/25774.96 3/17089.72 | |||||
备注:*栏中三行数据分别为2000、2008、2018年长沙与株洲城市边界的距离和两城间交互作用强度;**栏中三行数据分别为2000、2008、2018年株洲与湘潭城市边界距离和两城间交互作用强度;***栏中三行数据分别为2000、2008、2018年长沙与湘潭城市边界的距离和两城间交互作用强度。 |
| [1] |
何志超, 赵春红, 李国煜, 等. 从空间规划到土地利用变化——差异、现状、挑战和未来方向[J]. 城市规划, 2020, 44(10):9-16.
|
| [2] |
张佰发, 苗长虹. 黄河流域土地利用时空格局演变及驱动力[J]. 资源科学, 2020, 42(3):460-473.
|
| [3] |
徐谅慧, 杨磊, 李加林, 等. 基于GIS-Logistic耦合模型的杭州湾南岸景观演变驱动力分析[J]. 应用海洋学学报, 2016, 35(1):75-86.
|
| [4] |
李孝永, 匡文慧. 京津冀1980—2015年城市土地利用变化时空轨迹及未来情景模拟[J]. 经济地理, 2019, 39(3):187-194,200.
|
| [5] |
杨建新, 龚健, 高静, 等. 国家中心城市土地利用变化稳定性和系统性特征——以武汉市为例[J]. 资源科学, 2019, 41(4):701-716.
|
| [6] |
付丽娜, 陈晓红, 冷智花. 基于超效率DEA模型的城市群生态效率研究——以长株潭“3+5”城市群为例[J]. 中国人口·资源与环境, 2013, 23(4):169-175.
|
| [7] |
何建华, 王宵君, 杜超, 等. 武汉城市圈土地利用变化系统仿真模拟与驱动力分析[J]. 长江流域资源与环境, 2015, 24(8):1270-1278.
|
| [8] |
|
| [9] |
|
| [10] |
|
| [11] |
|
| [12] |
|
| [13] |
|
| [14] |
|
| [15] |
|
| [16] |
姚士谋, 吴楚材, 徐桂卿. 现代城市发展若干问题的探讨[J]. 地理科学, 1982(2):179-187.
|
| [17] |
姚士谋. 我国城市群的特征、类型与空间布局[J]. 城市问题, 1992(1):10-15,66.
|
| [18] |
郗凤明, 贺红士, 胡远满, 等. 辽宁中部城市群城市增长时空格局及其驱动力[J]. 应用生态学报, 2010, 21(3):707-713.
|
| [19] |
朱磊, 岳嘉琛, 陈诗音, 等. 1992—2016年京津冀城市群城市扩展过程和驱动分析[J]. 北京师范大学学报:自然科学版, 2019, 55(2):291-298.
|
| [20] |
董会忠, 李旋, 张仁杰. 粤港澳大湾区绿色创新效率时空特征及驱动因素分析[J]. 经济地理, 2021, 41(5):134-143.
|
| [21] |
谭雪兰, 欧阳巧玲, 安悦, 等. 长株潭城市群地区乡村功能的动态演变及驱动机制(英文)[J]. Journal of Geographical Sciences, 2019, 29(8):1381-1395.
|
| [22] |
张猛, 曾永年. 长株潭城市群湿地景观时空动态变化及驱动力分析[J]. 农业工程学报, 2018, 34(1):241-249.
|
| [23] |
胡顺石, 彭雨龙, 秦建新, 等. 长株潭城市群植被指数动态变化及城市扩展对其影响分析[J]. 经济地理, 2019, 39(12):178-186.
|
| [24] |
李毅, 杨仁斌, 毕军平, 等. 长株潭地区生态资产变化格局分析[J]. 经济地理, 2015, 35(2):184-188,208.
|
| [25] |
邓楚雄, 李晓青, 向云波, 等. 长株潭城市群地区耕地数量时空变化及其驱动力分析[J]. 经济地理, 2013, 33(6):142-147.
|
| [26] |
陈彦光. 人口与资源预测中Logistic模型承载量参数的自回归估计[J]. 自然资源学报, 2009, 24(6):1105-1114.
|
| [27] |
孙才志, 闫晓露. 基于GIS-Logistic耦合模型的下辽河平原景观格局变化驱动机制分析[J]. 生态学报, 2014, 34(24):7280-7292.
|
| [28] |
李毅. 长株潭核心区土地利用变化及其生态环境效应研究[D]. 长沙: 湖南农业大学, 2015.
|
| [29] |
许学强, 周一星, 宁越敏. 城市地理学[M]. 北京: 高等教育出版社, 2003.
|
/
| 〈 |
|
〉 |