
我国农业保险空间格局动态演变及收敛研究
|
王韧(1978—),女,湖南平江人,博士,教授,研究方向为农业风险与保险。E-mail:renwang@hutb.edu.cn |
收稿日期: 2020-05-28
修回日期: 2021-03-10
网络出版日期: 2025-03-31
基金资助
国家社会科学基金项目(19BGL206)
The Spatio-temporal Evolution of Agricultural Insurance in China and Its Convergence Analysis
Received date: 2020-05-28
Revised date: 2021-03-10
Online published: 2025-03-31
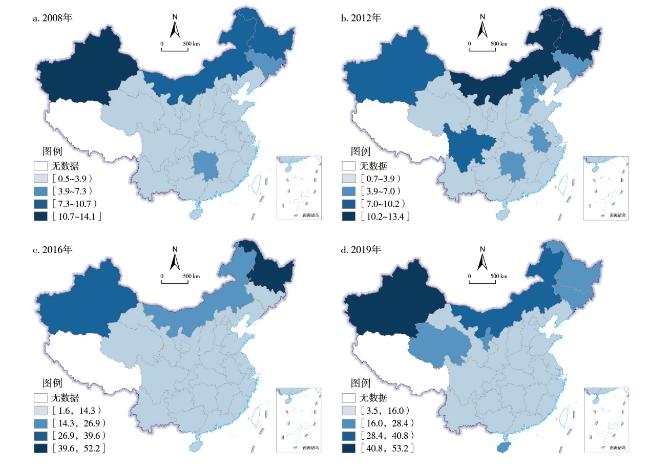
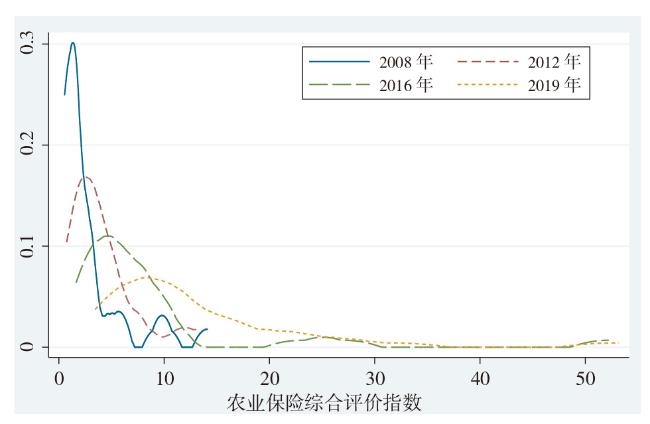
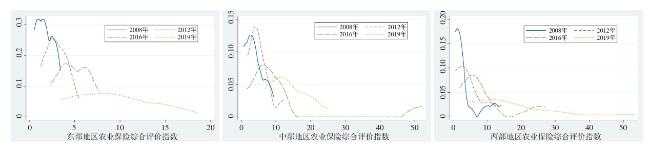
基于2008—2019年我国30个省域间的农业保险相关数据,通过信息量权重法刻画我国农业保险综合发展指数,运用Kernel密度估计和Markov链等分析方法从不同维度对我国农业保险发展的时空格局进行探索。结果显示,我国农业保险的综合发展水平呈逐年上升的趋势,但是东部、中部、西部发展的整体差异较大,长期则趋于稳态收敛发展。最后,引用空间计量模型,运用GeoDa软件进行β收敛分析,验证了我国农业保险发展存在显著的空间收敛,且空间误差模型SEM是最适合研究农业保险收敛性的模型。基于上述研究,政府应优化农业保险差异发展策略,完善制度供给,保险企业则应提高产品创新技能,提升风险管理能力,以促进区域农业保险均衡发展,从而形成稳定的农业保险市场。
王韧 , 匡祎琦 , 农通理 , 刘国权 . 我国农业保险空间格局动态演变及收敛研究[J]. 经济地理, 2021 , 41(7) : 164 -172 . DOI: 10.15957/j.cnki.jjdl.2021.07.018
Based on the data of agricultural insurance of 22 provinces,4 municipalities and 4 autonomous regions in China from 2008 to 2019,the paper describes the comprehensive development index of agricultural insurance in China by the means of information weight method,and explores its spatial-temporal pattern from different dimensions using the methods of Kernel density estimation and Markov chain analysis. The results show that the comprehensive development level of China's agricultural insurance is increasing year by year,but the overall development is quite different in the eastern,central and western regions,and tends to converge at a steady state in the long term. Hence,the spatial econometric model and GeoDa are used for convergence analysis to verify the significant spatial convergence of China's agricultural insurance development. The spatial error model (SEM) is tested to be the most suitable model for studying the convergence of agricultural insurance. Based on the above research,this paper proposes suggestions for further improvements and measures which include optimizing the regional development policy of agricultural insurance,improving the system supply and product innovation skill,strengthening risk management ability,in order to balance the development of regional agricultural insurance and form a stable agricultural insurance market.
表1 农业保险综合发展评价体系Tab.1 Evaluation index and weight of comprehensive development system of agricultural insurance |
| 主要指标 | 指标说明 | 权重 | |||
|---|---|---|---|---|---|
| 2008 | 2012 | 2016 | 2019 | ||
| 农业保险保费收入增长率(%) | 保费增长率=[(本年农险保费收入/上年农险保费收入)-1]·100% | 0.1458 | 0.2296 | 0.2766 | 0.1940 |
| 农业保险保费收入(亿元) | 0.1474 | 0.1319 | 0.1368 | 0.1309 | |
| 农业保险密度(元/人) | 保险密度=(农业保费收入/人口总数)·100% | 0.1875 | 0.1391 | 0.1459 | 0.1670 |
| 农业保险深度(%) | 保险深度=(农业保费收入/农林牧渔业总产值)·100% | 0.1563 | 0.1421 | 0.1077 | 0.1711 |
| 农业保险保障水平(%) | 保障水平=(农业保险总保额/农林牧渔业总产值)·100% | 0.1444 | 0.1613 | 0.1174 | 0.1328 |
| 农业保险赔付率(%) | 赔付率=(农业保险赔付支出/农业保险保费收入)·100% | 0.0513 | 0.0614 | 0.0412 | 0.0515 |
| 农业保险市场占有率(%) | 市场占有率=(农业保险保费收入/财产保险保费收入)·100% | 0.1673 | 0.1345 | 0.1744 | 0.1526 |
表2 2008、2012、2016、2019年各省农业保险综合评价指数排名Tab.2 Ranking of the comprehensive development index of agricultural insurance of China in 2008,2012,2016 and 2019 |
| 地区 | 2008 | 2012 | 2016 | 2019 | |||||||
|---|---|---|---|---|---|---|---|---|---|---|---|
| C值 | 排名 | C值 | 排名 | C值 | 排名 | C值 | 排名 | ||||
| 北京 | 3.424 | 7 | 4.278 | 9 | 4.995 | 18 | 7.587 | 22 | |||
| 天津 | 0.774 | 25 | 1.239 | 28 | 3.220 | 25 | 6.227 | 26 | |||
| 河北 | 2.505 | 9 | 5.543 | 8 | 7.651 | 10 | 12.910 | 12 | |||
| 山西 | 0.780 | 24 | 2.170 | 21 | 3.489 | 23 | 6.814 | 25 | |||
| 内蒙古 | 10.288 | 2 | 13.365 | 1 | 23.137 | 3 | 31.383 | 2 | |||
| 辽宁 | 2.503 | 10 | 3.607 | 13 | 7.453 | 12 | 13.023 | 10 | |||
| 吉林 | 5.539 | 5 | 5.957 | 6 | 10.099 | 4 | 17.246 | 7 | |||
| 黑龙江 | 9.320 | 3 | 12.621 | 2 | 52.230 | 1 | 25.082 | 3 | |||
| 上海 | 2.287 | 12 | 3.376 | 14 | 4.800 | 19 | 7.283 | 23 | |||
| 江苏 | 2.737 | 8 | 3.771 | 11 | 5.455 | 15 | 12.089 | 13 | |||
| 浙江 | 1.038 | 19 | 1.802 | 24 | 2.757 | 27 | 4.264 | 28 | |||
| 安徽 | 2.118 | 13 | 6.520 | 5 | 8.288 | 9 | 10.731 | 14 | |||
| 福建 | 0.560 | 28 | 1.669 | 25 | 2.347 | 28 | 3.451 | 30 | |||
| 江西 | 0.728 | 26 | 2.896 | 17 | 3.749 | 21 | 8.041 | 20 | |||
| 山东 | 1.489 | 16 | 2.716 | 19 | 5.354 | 16 | 10.078 | 15 | |||
| 河南 | 2.003 | 14 | 3.735 | 12 | 8.301 | 8 | 14.748 | 9 | |||
| 湖北 | 2.378 | 11 | 1.900 | 22 | 1.632 | 30 | 6.931 | 24 | |||
| 湖南 | 5.801 | 4 | 5.560 | 7 | 9.355 | 6 | 15.075 | 8 | |||
| 广东 | 0.900 | 22 | 1.474 | 26 | 3.002 | 26 | 5.284 | 27 | |||
| 广西 | 1.289 | 17 | 0.733 | 30 | 4.057 | 20 | 9.120 | 16 | |||
| 海南 | 0.919 | 21 | 2.979 | 16 | 6.488 | 13 | 18.644 | 6 | |||
| 重庆 | 1.547 | 15 | 1.242 | 27 | 1.991 | 29 | 4.217 | 29 | |||
| 四川 | 3.876 | 6 | 7.190 | 4 | 9.881 | 5 | 8.950 | 17 | |||
| 贵州 | 0.554 | 29 | 0.906 | 29 | 3.669 | 22 | 8.202 | 18 | |||
| 云南 | 1.197 | 18 | 3.228 | 15 | 5.254 | 17 | 7.971 | 21 | |||
| 陕西 | 0.876 | 23 | 1.806 | 23 | 3.473 | 24 | 8.101 | 19 | |||
| 甘肃 | 0.570 | 27 | 2.896 | 18 | 5.979 | 14 | 12.918 | 11 | |||
| 青海 | 0.547 | 30 | 2.406 | 20 | 7.516 | 11 | 23.574 | 4 | |||
| 宁夏 | 1.034 | 20 | 3.886 | 10 | 9.228 | 7 | 21.146 | 5 | |||
| 新疆 | 14.097 | 1 | 9.944 | 3 | 27.028 | 2 | 53.190 | 1 | |||
| 均值 | 2.789 | 4.047 | 8.396 | 13.143 | |||||||
表3 农业保险综合评价指数区域差异测度Tab.3 Regional difference measurement of the comprehensive evaluation index of agricultural insurance |
| 年份 | Gini | VAR | Theil | 年份 | Gini | VAR | Theil | |
|---|---|---|---|---|---|---|---|---|
| 2008 | 0.515 | 1.160 | 0.470 | 2014 | 0.396 | 0.925 | 0.292 | |
| 2009 | 0.529 | 1.154 | 0.489 | 2015 | 0.380 | 0.866 | 0.265 | |
| 2010 | 0.418 | 1.409 | 0.290 | 2016 | 0.453 | 1.187 | 0.413 | |
| 2011 | 0.471 | 1.055 | 0.393 | 2017 | 0.351 | 0.745 | 0.213 | |
| 2012 | 0.390 | 0.790 | 0.253 | 2018 | 0.343 | 0.711 | 0.198 | |
| 2013 | 0.410 | 0.915 | 0.302 | 2019 | 0.355 | 0.769 | 0.220 |
表4 2008—2019年农业保险综合评价指数LISA聚类表Tab.4 LISA clusters of the comprehensive evaluation index of agricultural insurance in 2008-2019 |
| 2008 | 2012 | 2016 | 2019 | |
|---|---|---|---|---|
| 高—高集聚区 | 黑龙江、吉林 | 黑龙江、吉林 | 黑龙江、吉林 | 青海 |
| 低—低集聚区 | - | 海南 | 福建 | 江西、福建 |
| 低—高集聚区 | 甘肃 | 甘肃、辽宁 | - | 甘肃 |
| 高—低集聚区 | 四川、新疆 | 四川、湖南 | 湖南 | 湖南 |
表5 农业保险综合评价指数的Markov链转移矩阵概率分布Tab.5 Markov matrix for the comprehensive evaluation index of agricultural insurance |
| 指数 | 2008—2013 | 2014—2019 | |||||||||
|---|---|---|---|---|---|---|---|---|---|---|---|
| LL | LM | MM | MH | HH | LL | LM | MM | MH | HH | ||
| LL | 0.417 | 0.333 | 0.167 | 0.083 | 0.000 | 0.385 | 0.538 | 0.077 | 0.000 | 0.000 | |
| LM | 0.400 | 0.200 | 0.400 | 0.000 | 0.000 | 0.000 | 0.429 | 0.429 | 0.143 | 0.000 | |
| MM | 0.125 | 0.125 | 0.500 | 0.250 | 0.000 | 0.000 | 0.286 | 0.571 | 0.143 | 0.000 | |
| MH | 0.000 | 0.000 | 0.000 | 1.000 | 0.000 | 0.000 | 0.000 | 0.000 | 1.000 | 0.000 | |
| HH | 0.000 | 0.000 | 0.000 | 0.000 | 1.000 | 0.000 | 0.000 | 0.000 | 0.500 | 0.500 | |
表6 绝对β收敛空间计量模型估计结果Tab.6 Results of absolute β convergence based on the spatial econometric model |
| 模型参数 | OLS模型 | 空间滞后模型 | 空间误差模型 |
|---|---|---|---|
| 2.148*** | 1.6843*** | 2.2214*** | |
| -0.6090*** | -0.6418*** | -0.7056*** | |
| 0.2732 | |||
| 0.6832*** | |||
| LogL | -21.8347 | -20.7656 | -17.0409 |
| AIC | 47.6695 | 47.5311 | 38.0817 |
| SC | 50.4719 | 51.7347 | 40.8841 |
| R2 | 0.5447 | 0.5838 | 0.7137 |
| LMLAG | 1.9207 | ||
| R-LMLAG | 0.8662 | ||
| LMERR | 7.4823** | ||
| R-LMERR | 6.4279* |
注:***、**、*分别表示在1%、5%、10%的统计水平上显著。表7同。 |
表7 条件β收敛空间计量模型估计结果Tab.7 Results of conditional β convergence based on the spatial econometric model |
| 变量 | 系数 | 标准差 | Z检验 |
|---|---|---|---|
| 2.3120*** | 0.5429 | 4.2584 | |
| -0.6814*** | 0.1046 | -6.5174 | |
| IND | -0.2323 | 0.3103 | -0.7488 |
| INC | -0.0001 | 0.0001 | -0.9340 |
| PER | 0.3449 | 0.4254 | 0.8107 |
| INS | 1.3611 | 1.1675 | 1.1658 |
| SUB | -4.6514 | 9.7705 | -0.4761 |
| LAMBDA | 0.5509** | 0.1718 | 3.2063 |
| R-squared=0.7705 |
| [1] |
张祖荣, 马岚. 我国省域政策性农业保险发展不平衡的实证分析[J]. 财经科学, 2016(7):20-30.
|
| [2] |
何小伟, 庹国柱, 谢远涛. 农业保险保费补贴的央地责任分担:基于区域公平的视角[J]. 保险研究, 2019(4):3-14.
|
| [3] |
王韧, 黄渊基, 刘莹, 等. 中国省域农业保险发展水平的时空格局及影响因素[J]. 经济地理, 2018, 38(6):117-125.
|
| [4] |
祝仲坤, 聂文广, 陶建平. 中国农业保险区域差异的变动及成因解释——基于Shapley值分解方法[J]. 中国农业大学学报, 2015, 20(3):241-250.
|
| [5] |
张伟, 黄颖, 何小伟, 等. 贫困地区农户因灾致贫与政策性农业保险精准扶贫[J]. 农业经济问题, 2020(12):28-40.
|
| [6] |
王克, 何小伟, 肖宇谷, 等. 农业保险保障水平的影响因素及提升策略[J]. 中国农村经济, 2018(7):34-45.
|
| [7] |
|
| [8] |
|
| [9] |
|
| [10] |
|
| [11] |
|
| [12] |
陈堂, 陈光. 科技创新对产业结构升级的空间外溢效应研究——基于省域空间面板模型的分析[J]. 云南财经大学学报, 2020, 36(1):21-31.
|
| [13] |
高一铭, 徐映梅, 季传凤, 等. 我国金融业高质量发展水平测度及时空分布特征研究[J]. 数量经济技术经济研究, 2020, 37(10):63-82.
|
| [14] |
|
| [15] |
徐婷婷, 陈先洁. 农村普惠保险减贫的机制及空间效应研究[J]. 保险研究, 2021(1):3-21.
|
| [16] |
李恩龙, 杨永春, 史坤博, 等. 省域视角下中国保险业市场的时空特征[J]. 经济地理, 2017, 37(5):116-124.
|
| [17] |
|
| [18] |
|
| [19] |
杨万平, 李冬. 中国生态全要素生产率的区域差异与空间收敛[J]. 数量经济技术经济究, 2020, 37(9):80-99.
|
| [20] |
于伟, 张鹏, 姬志恒. 中国城市群生态效率的区域差异、分布动态和收敛性研究[J]. 数量经济技术经济研究, 2021, 38(1):23-42.
|
| [21] |
沈扬扬. 中国保险业区域不平衡发展研究——基于修正数据的研究[J]. 保险研究, 2012(3):12-23.
|
| [22] |
孙喆. 中国互联网保险的地区差距及收敛性研究[J]. 保险研究, 2021(1):58-72.
|
| [23] |
|
| [24] |
黄琦, 陶建平, 张红梅. 农业保险市场结构、空间依赖性与农业保险条件收敛研究[J]. 中国管理科学, 2017(5):116-124.
|
| [25] |
黄倩, 李政. 县域普惠金融发展与经济包容性增长——基于云南省120个县域数据的实证分析[J] 云南财经大学学报, 2019(1):52-66.
|
| [26] |
董雪兵, 池若楠. 中国区域经济差异与收敛的时空演进特征[J]. 经济地理, 2020, 40(10):11-21.
|
| [27] |
李研. 中国数字经济产出效率的地区差异及动态演变[J]. 数量经济技术经济研究, 2021, 38(2):60-77.
|
| [28] |
张峭, 王克, 宋建国, 等. 中国农业保险保障分析与评价[M]. 北京: 中国金融出版社, 2020.
|
/
| 〈 |
|
〉 |