
中国大陆苹果零部件供应链空间组织研究
|
康江江(1989—),男,山西吕梁人,博士,助理研究员,研究方向为城市地理与产业发展。E-mail:jjkang@sass.org.cn |
收稿日期: 2020-10-21
修回日期: 2021-05-22
网络出版日期: 2025-03-31
基金资助
国家社会科学基金重点项目(19AZS018)
国家社会科学基金重点项目(19AZD007)
上海市教育委员会科研创新计划重大项目(2021-01-07-00-08-E00130)
上海市哲学社会科学规划青年课题(2020ECK006)
上海社会科学院重大系列课题(2021ZD029)
Spatial organization and Influencing Factors of Apple's Component Supply Chain in China
Received date: 2020-10-21
Revised date: 2021-05-22
Online published: 2025-03-31
康江江 , 林柄全 , 宁越敏 . 中国大陆苹果零部件供应链空间组织研究[J]. 经济地理, 2021 , 41(7) : 138 -145 . DOI: 10.15957/j.cnki.jjdl.2021.07.015
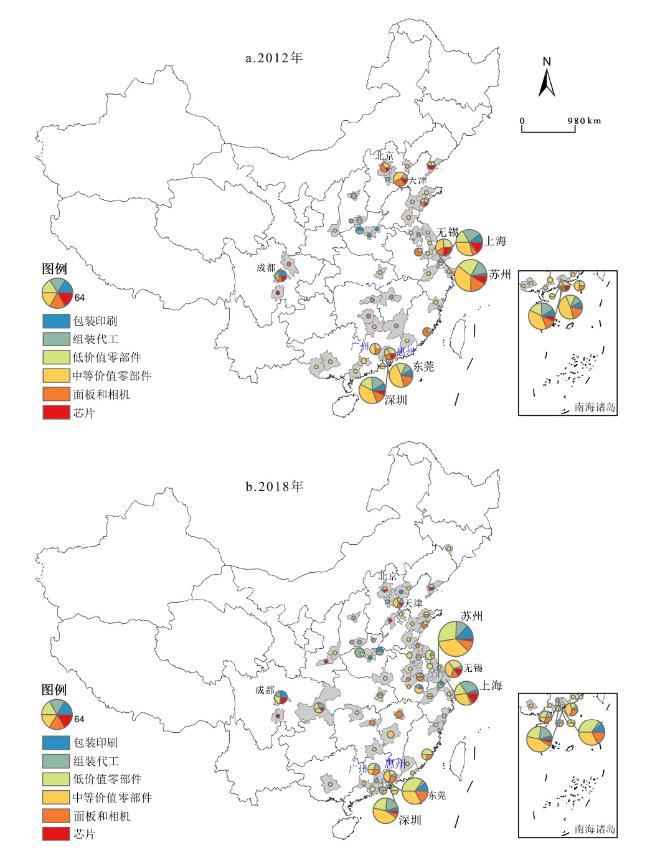
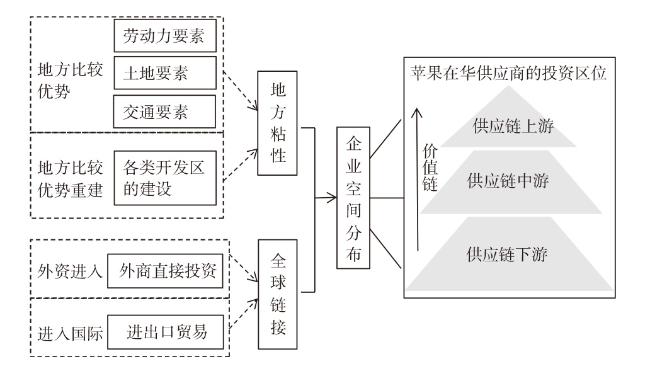
Based on the address and product information data of Apple's component suppliers in Mainland China from 2012 to 2018,this paper interprets the spatial distribution of Apple's component supply chain by using the method of Herfindahl index and GIS spatial analysis. In addition,the negative binomial regression method is used to empirically test the influence of local factors and global factors. The main conclusions are as follows: Firstly,Apple's component supply chain mainly concentrated in a few cities and provinces,and showed the characteristics of high agglomeration in large urban agglomerations and decrease property on the urban scale. Secondly,the suppliers at core cities of the Yangtze River Delta and the Pearl River Delta are clustered with producing components of different links,which is mainly manifested as regional co-agglomeration of suppliers with the same function and different function. The general cities and the cities in the central and western regions mainly specialize in the production of single component,which is mainly manifested as regional co-agglomeration with same function. Lastly,Apple's component supply chain tends to choose cities with more economic development zones and stronger transportation capacity. The increased ability to participate in global trade will also promote the distribution of Apple suppliers to this city. The firms of upstream supply chain tends to choose the cities with developed economy and large population,while labor cost and industrial land cost will have significant negative effects. The FDI will have a significant negative impact on the location selection of the midstream supply chain. The downstream supply chain tends to choose the cities with a large manufacturing population,strong port transportation capacity and large participation in global trade.
表1 2012—2018年苹果公司供应商企业在中国大陆的分布变化Tab.1 The number change of Apple's suppliers in China from 2012 to 2018 |
| 时间/企业数量 | 2012 | 2013 | 2014 | 2015 | 2016 | 2017 | 2018 |
|---|---|---|---|---|---|---|---|
| 在中国大陆分布的企业数量 | 329 | 347 | 336 | 343 | 329 | 356 | 380 |
| 其余国家和地区分布数量 | 472 | 455 | 425 | 435 | 415 | 422 | 428 |
| 全球供应商企业总数 | 801 | 802 | 761 | 778 | 744 | 778 | 808 |
| 在中国大陆的企业数量占比(%) | 41.07 | 43.27 | 44.15 | 44.09 | 44.22 | 45.76 | 47.03 |
表2 2012—2018年苹果供应链分省市的局域集中特征Tab.2 The local concentration features of Apple's component supply chain in different provinces and cities from 2012 to 2018 |
| 2012 | 2013 | 2014 | 2015 | 2016 | 2017 | 2018 | 分布区域 | |
|---|---|---|---|---|---|---|---|---|
| 前三大省赫芬达尔指数 | 0.2196 | 0.2386 | 0.2336 | 0.2448 | 0.2410 | 0.2161 | 0.2247 | 广东、江苏、上海 |
| 省域均匀分布均值 | 0.0556 | 0.0588 | 0.0556 | 0.0526 | 0.0526 | 0.0526 | 0.0476 | |
| 前三大省数量占比(%) | 77.51 | 79.54 | 78.57 | 78.72 | 78.11 | 75 | 75.53 | |
| 前五大城市赫芬达尔指数 | 0.1049 | 0.0967 | 0.0959 | 0.0946 | 0.0894 | 0.0889 | 0.0868 | 苏州、东莞、深圳、 上海、无锡 |
| 市域均匀分布均值 | 0.0204 | 0.0185 | 0.0189 | 0.0185 | 0.0179 | 0.0161 | 0.0156 | |
| 前五大城市数量占比(%) | 67.78 | 66.28 | 65.48 | 64.43 | 62.61 | 60.96 | 60.26 |
表3 2018年苹果供应链分布前五大城市的主要企业名称及产品类型Tab.3 Firm name and product types in the top five cities of Apple component supply chain in 2018 |
| 城市 | 上游代表企业和具体产品 | 中游代表企业及具体产品 | 下游代表企业及具体产品 | |||||
|---|---|---|---|---|---|---|---|---|
| 代表企业 | 产品类型 | 代表企业 | 产品类型 | 代表企业 | 产品类型 | |||
| 苏州 | 瑞萨电子、日月光、松下、三星电子、JDI等 | 3D超声波指纹传感器、芯片封装、液晶面板等 | 台达集团、立讯精密、东山精密、欣兴电子、楼氏电子等 | 连接器、散热组件、声学器件 | 金箭印刷、捷普、领益智造、迈锐集团、和硕、裕同包、东阳理化学等 | 代工组装、结构件、包装印刷、功能材料等 | ||
| 东莞 | JDI、京瓷、大立光、高伟电子、阿尔卑斯、钛鼎科技等 | 液晶面板、触控面板、摄像头镜头 | 国泰达鸣、正崴精密、金龙控股、日本电产株式会社等 | 充电器、连接器、精密马达等 | 正隆股份、卡士莫实业、领益智造、TDK等 | 结构件、包装印刷、功能材料等 | ||
| 深圳 | 日本电工、旭硝子、安森美、意法半导体 | 液晶面板、电源管理芯片、集成电路设计芯片 | 瑞声科技、雅特生科技、比亚迪、欣旺达、安费诺、奇鋐科技等 | 声学器件、连接器、散热组件等 | 鸿海精密、捷普、领益智造、裕同包装、正美集团等 | 代工组装、包装印刷、结构件等 | ||
| 上海 | 日月光半导体、达尔科技、美蓓亚等 | 芯片封装、芯片生产 | 藤仓、莱尔德、迅达科技、奇鋐科技等 | 连接器、散热件、电池 | 赫比、鸿海、和硕、广达、统一钢铁科技等 | 代工组装、外壳、结构件等 | ||
| 无锡 | 江苏长电、高通、SK海力士、夏普等 | 芯片封装、液晶面板 | 村田制作所、国泰达鸣、住友电气等 | 电阻、连接器、充电器 | 捷普、光宝、领益智造等 | 代工组装、功能材料 | ||
注:由于篇幅有限,表中主要列举了部分代表性企业以及具体产品,企业名称主要以简称为主,具体可查阅该企业公司网站。 |
表4 变量基本属性与描述Tab.4 Description of independent variables |
| 变量名称 | 定义 | 最大值 | 最小值 | 均值 | |
|---|---|---|---|---|---|
| 因变量 | Y | 城市供应商数量 | 82 | 0 | 4.802 |
| 地方化要素 | lnWage | 在岗职工平均工资(元) | 11.917 | -23.026 | 10.913 |
| lnLand price | 招标、拍卖或挂牌出售的土地的平均价格(万元/hm2) | 12.393 | 5.502 | 7.671 | |
| lnIDZ | 供应商分布在开发区的数量(个) | 3.951 | -23.026 | -7.862 | |
| lnRoad | 城市人均道路面积(m2/人) | 9.619 | 6.906 | 8.000 | |
| lnPorts | 港口货运量(万t) | 11.520 | -20.723 | -10.389 | |
| lnAirport | 机场货运量 | 15.251 | -20.723 | -3.273 | |
| 全球化要素 | lnFDI | 外商直接投资总额(亿美元) | 5.731 | -3.878 | 2.270 |
| lnIaE | 货物进出口总额(亿美元) | 8.589 | 0.486 | 4.712 | |
| 控制变量 | lnPgdp | 人均GDP(亿元) | 13.056 | 9.532 | 11.022 |
| lnPopulation | 城市常住人口数量(万人) | 7.167 | -0.077 | 3.260 | |
| lnEmp-density | 制造业人口从业密度(人/km2) | 8.040 | 4.253 | 6.340 |
表5 苹果供应链影响因素的负二项回归结果Tab.5 The estimated results of negative binomial regression |
| 自变量 | 地方粘性变量 (模型1) | 全球链接变量 (模型2) | 整个模型 (模型3) | 供应链上游 (模型4) | 供应链中游 (模型5) | 供应链下游 (模型6) |
|---|---|---|---|---|---|---|
| lnWage | -0.0030(0.0833) | -0.0070(0.1334) | -0.7178***(0.2134) | -0.0703(0.2042) | 0.0015(0.1632) | |
| lnLand price | -0.0435(0.0310) | -0.0440(0.0305) | -0.1997***(0.0543) | 0.0501(0.0772) | -0.0586(0.0397) | |
| lnIDZ | 0.0821***(0.0134) | 0.0821***(0.0138) | 0.1017(0.1147) | 0.0597***(0.0158) | 0.0785(0.2244) | |
| lnRoad | 0.2385*(0.1432) | 0.2150(0.1602) | 0.0332(0.2499) | 0.1901(0.2126) | 0.2830(0.2031) | |
| lnPorts | 0.0084**(0.0039) | 0.0074*(0.0039) | 0.0175(0.0615) | 0.0012(0.0043) | 0.0161*(0.0097) | |
| lnAirport | 0.0167(0.0340) | 0.0216(0.0369) | -0.0252(0.1249) | 0.0021(0.0677) | 0.0559(0.0511) | |
| lnFDI | -0.0029(0.0550) | -0.0443(0.0527) | 0.1512(0.0928) | -0.1408*(0.0778) | -0.0642(0.0996) | |
| lnIaE | 0.3414**(0.1557) | 0.2376*(0.1365) | 0.2839(0.2802) | 0.0106(0.1704) | 0.5858***(0.2171) | |
| lnPgdp | 0.1254(0.0838) | 0.0711(0.0494) | 0.1008(0.0839) | 0.4154*(0.2231) | 0.0349(0.1040) | 0.0524(0.0880) |
| lnPopulation | 0.8841***(0.2398) | 0.8987(0.5619) | 0.8150***(0.2865) | 1.5075***(0.4598) | 1.1979***(0.4332) | 0.9279(0.5901) |
| lnEmp-density | 0.0367(0.0626) | 0.0236(0.0887) | 0.0311(0.0721) | -0.0248(0.1153) | -0.0792(0.2636) | 0.1394**(0.0688) |
| N | 504 | 504 | 504 | 154 | 252 | 245 |
注:括号内为标准误,***,p<0.01;**,p<0.05;*,p<0.1。其中,上、中、下游城市有所重叠,同时将2012—2018年不同供应链环节供应商数量在1~3家的城市剔除。由于常数的回归系数不显著,故没有放入模型。 |
| [1] |
高翔. 中国电子通讯设备制造业的区位选择研究[J]. 地理与地理信息科学, 2010, 26(3):54-58.
|
| [2] |
|
| [3] |
康江江, 张凡, 宁越敏. 苹果手机零部件全球价值链的价值分配与中国角色演变[J]. 地理科学进展, 2019, 38(3):395-406.
|
| [4] |
|
| [5] |
刘卫东. 新冠肺炎疫情对经济全球化的影响分析[J]. 地理研究, 2020, 39(7):1439-1449.
|
| [6] |
|
| [7] |
朱晟君, 金文纨, 胡晓辉. 关联视角下的区域产业动态研究进展与反思[J]. 地理研究, 2020, 39(5):1045-1055.
|
| [8] |
高菠阳, 李俊玮. 全球电子信息产业贸易网络演化特征研究[J]. 世界地理研究, 2017, 26(1):1-11.
|
| [9] |
高月华, 韦素琼, 刘善开. 模块化视角下大陆台资电子信息产业价值链的时空演变[J]. 台湾研究集刊, 2016(3):52-63.
|
| [10] |
盖骁敏, 高彦梅. 产业集聚与集聚转移:中国电子及通信设备制造业的竞争力[J]. 改革, 2013(12):113-121.
|
| [11] |
高菠阳, 李俊玮, 刘红光. 中国电子信息产业转移特征及驱动因素——基于区域间投入产出表分析[J]. 经济地理, 2015, 35(10):103-109.
|
| [12] |
潘峰华, 王缉慈. 全球化背景下中国手机制造产业的空间格局及其影响因素[J]. 经济地理, 2010, 30(4):608-613.
|
| [13] |
陈肖飞, 杨洁辉, 王恩儒, 等. 基于汽车产业供应链体系的中国城市网络特征研究[J]. 地理研究, 2019, 39(2):370-383.
|
| [14] |
刘清, 杨永春, 蒋小荣. 全球价值生产的空间组织:以苹果手机供应链为例[J]. 地理研究, 2020, 39(12):2743-2762.
|
| [15] |
|
| [16] |
陈强. 高级计量经济学及Stata应用(第二版)[M]. 北京: 高等教育出版社, 2014.
|
| [17] |
|
| [18] |
|
| [19] |
韩峰, 李玉双. 产业集聚、公共服务供给与城市规模扩张[J]. 经济研究, 2019, 54(11):149-164.
|
| [20] |
|
| [21] |
贺灿飞, 胡绪千. 1978年改革开放以来中国工业地理格局演变[J]. 地理学报, 2019, 74(10):1962-1979.
|
| [22] |
|
| [23] |
沈玉良, 彭羽. 全球价值链视角下中国电子产品的技术复杂度提升了吗?:以智能手机为例[J]. 世界经济研究, 2018(6):23-35,135.
|
| [24] |
袁丰, 魏也华, 陈雯, 等. 苏州市区信息通讯企业空间集聚与新企业选址[J]. 地理学报, 2010, 65(2):153-163.
|
| [25] |
姜海宁, 谷人旭, 李广斌. 中国制造业企业500强总部空间格局及区位选择[J]. 经济地理, 2011, 31(10):1666-1673.
|
| [26] |
|
| [27] |
吕卫国, 陈雯. 制造业企业区位选择与南京城市空间重构[J]. 地理学报, 2009, 64(2):142-152.
|
| [28] |
周浩, 陈益. FDI外溢对新建企业选址的影响[J]. 管理世界, 2013(12):78-88.
|
| [29] |
林柄全, 谷人旭, 王俊松. 集聚经济与基于价值链的企业区位选择——重新发现内部集聚经济[J]. 经济地理, 2020, 40(4):56-64,74.
|
| [30] |
孙浦阳, 韩帅, 靳舒晶. 产业集聚对外商直接投资的影响分析——基于服务业与制造业的比较研究[J]. 数量经济技术经济研究, 2012, 29(9):40-57.
|
/
| 〈 |
|
〉 |