
城市轨道交通沿线住宅租金的空间分异分析——以长沙市地铁1号线、2号线和4号线为例
|
唐文彬(1975—),男,湖南双峰人,博士,副教授,研究方向为城市经济、项目管理。E-mail:wbtang2003@163.com |
收稿日期: 2020-01-14
修回日期: 2020-10-07
网络出版日期: 2025-03-31
基金资助
国家社会科学基金一般项目(14BGL160)
国家社会科学基金一般项目(16CGL004)
湖南省自然科学基金面上项目(2021JJ30748)
湖南省高校创新平台开放基金项目(17K008)
湖南省教育厅重点项目(19A082)
长沙理工大学湖南省企业战略管理与投资决策研究基地(19qyzd02)
Spatial Differentiation of Residential Rents along Urban Rail Transit:The Case of Metro Line 1,Line 2 and Line 4 in Changsha
Received date: 2020-01-14
Revised date: 2020-10-07
Online published: 2025-03-31
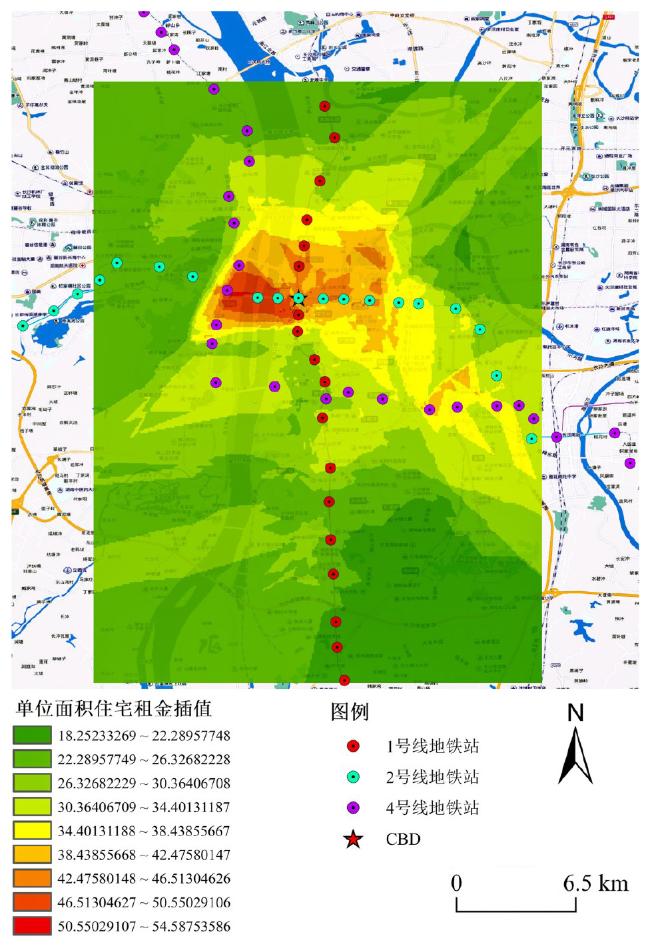
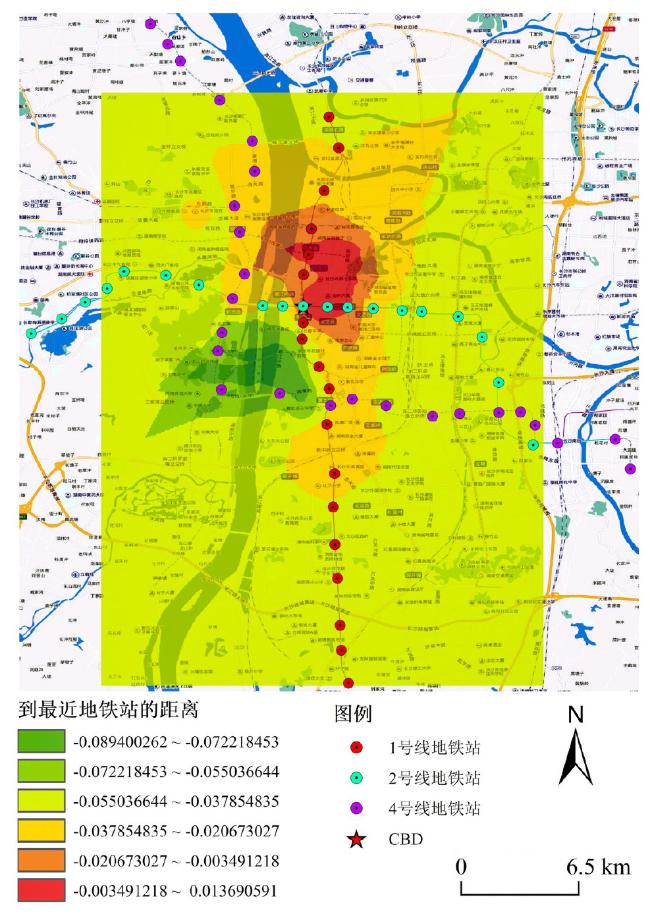
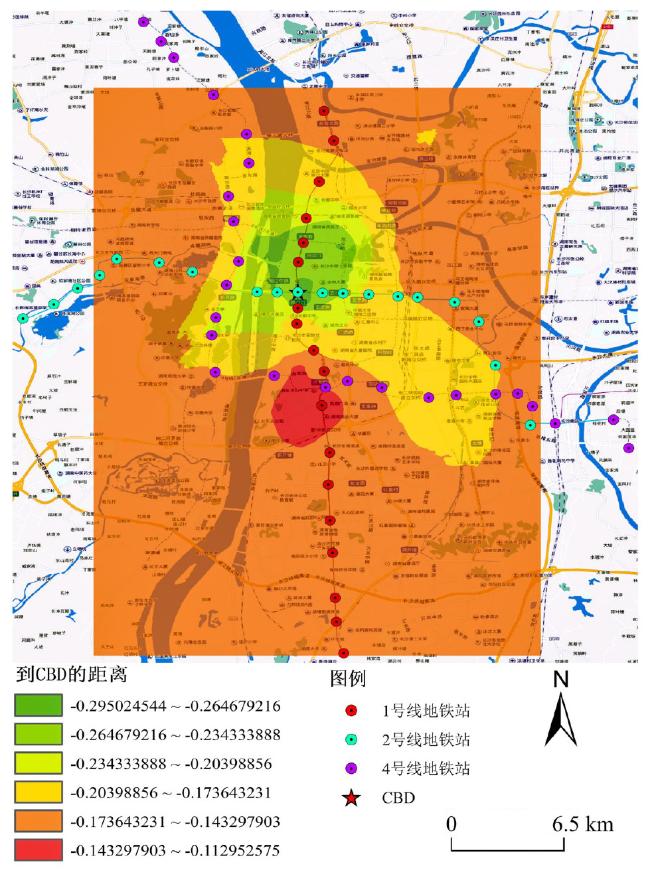
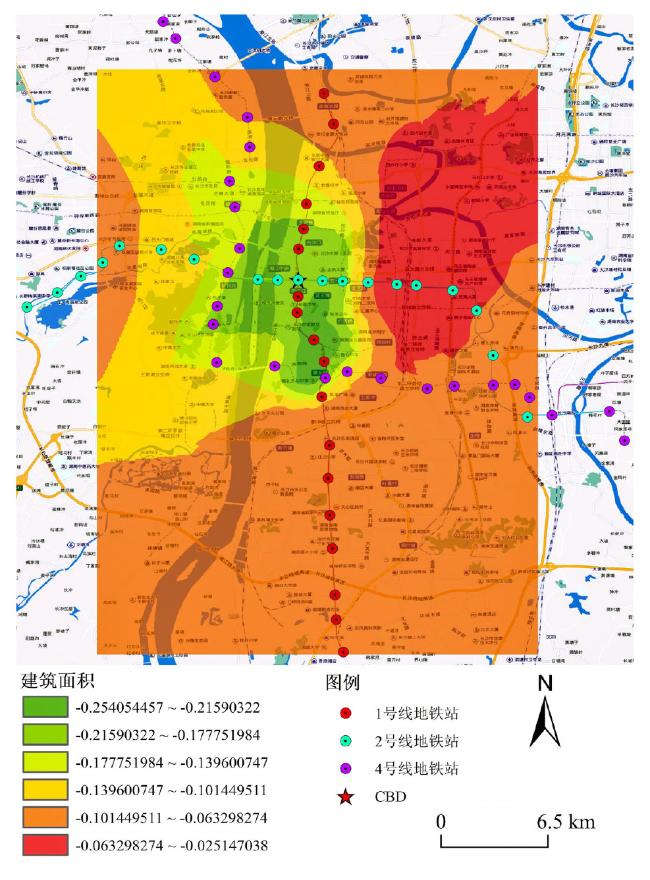
考虑到样本数据存在空间相关性与异质性特征,基于空间计量视角构建地理加权回归模型(GWR),分析在城市轨道交通(URT)沿线住宅租金的空间分异特征,按照每200 m的间隔对租金影响范围进行细分,预测URT对住宅租金的影响强度在各区间内的变化趋势,以新一线城市长沙为例,选取地铁沿线2.6 km范围内的2 233个样本展开实证研究,结果表明:与普通最小二乘法(OLS)相比,GWR具有更好的模型拟合优度;在12个主要影响因素中,住宅到城市商业中心(CBD)的距离对租金的影响最为显著,其次是住宅建筑面积,体现了租户首先考虑的是住宅区位因素和结构因素,然后才是邻里因素的心理特征;靠近中央商务区的小户型住宅更受租户青睐,具有更高的收益率;长沙地铁对沿线住宅租金会产生积极影响,尤其是对600~1 000 m范围内的住宅租金影响最大。
唐文彬 , 肖秋菱 , 颜红艳 , 陈艳 . 城市轨道交通沿线住宅租金的空间分异分析——以长沙市地铁1号线、2号线和4号线为例[J]. 经济地理, 2021 , 41(7) : 100 -108 . DOI: 10.15957/j.cnki.jjdl.2021.07.011
Taking account of the spatial correlation and heterogeneity of the sample data,and based on the geographically weighted regression model (GWR) from the perspective of spatial measurement,this study analyzes the spatial differentiation characteristics of residential rents along the urban rail transit (URT). According to the interval of every 200 m,the scope of rent influence is subdivided to predict the changing trend of the influence intensity of URT on residential rents in each interval,and enriches of the relevant predictive studies on the overall evaluation. The article takes Changsha,a new first-tier city,as an example, selects 2 233 samples within 2.6 km along the metro to conduct empirical research. The results show that,compared with ordinary least squares (OLS), the GWR model has better goodness of fit. Among the 12 main influencing factors,the distance from the residence to the central business district (CBD) has the most significant impact on rents,followed by the residential building area,which reflects the psychological characteristics that tenants firstly consider residential location and structural factors,and then neighborhood factors; Small-sized residences close to the CBD are more favored by tenants and have a higher rate of return; Changsha Metro will have a positive impact on the rent of houses along the line,especially within the range of 600 m to 1 000 m.
表1 变量描述性统计表Tab.1 Summary statistic of variables |
| 影响因素 | 变量 | 单位 | 变量描述 | 平均值 | 标准差 |
|---|---|---|---|---|---|
| 区位因素 | CBD | m | 出租房源到CBD(五一广场中心商业区)的距离 | 3 702.69 | 2 669.65 |
| metro | m | 出租房源到最近地铁站点的距离 | 585.62 | 456.20 | |
| 结构因素 | area | m2 | 住宅出租房源建筑面积 | 93.26 | 76.59 |
| gr | - | 出租房源所在小区绿化用地面积与占地面积之比 | 0.38 | 0.09 | |
| cost | 元/(月·m2) | 出租房源所在小区住宅物业费均价 | 1.69 | 0.67 | |
| bed | 间 | 出租房源卧室个数 | 2.20 | 0.92 | |
| tol | 间 | 出租房源卫生间个数 | 1.29 | 0.53 | |
| flo | - | 出租房源所在楼栋总层数 | 27.21 | 11.42 | |
| 邻里因素 | park | m | 出租房源到最近公园的距离 | 518.79 | 223.18 |
| sch | m | 出租房源到最近重点中小学校的距离 | 1 623.24 | 1 180.04 | |
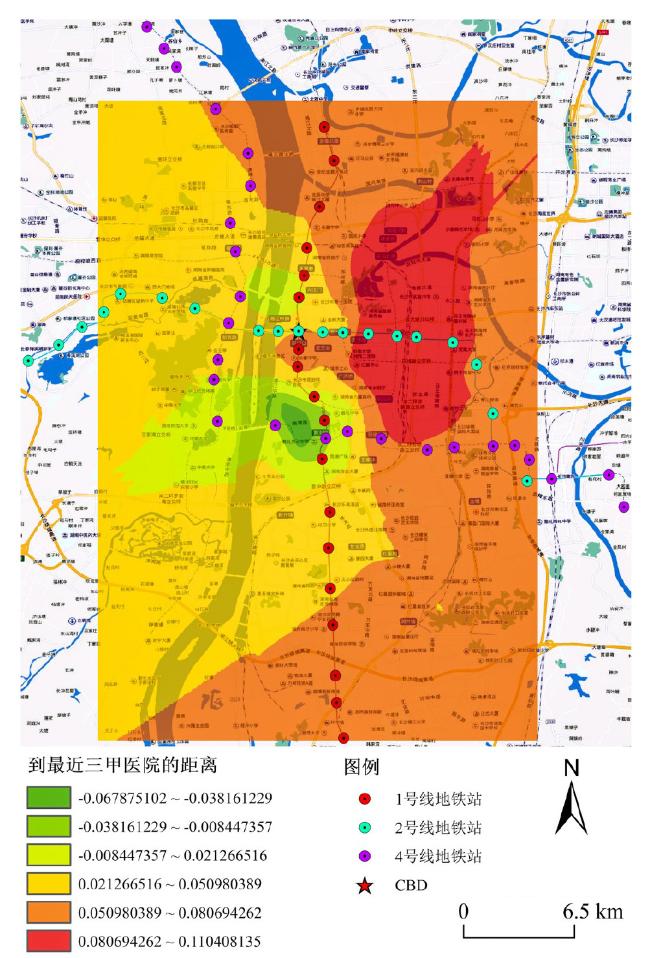
| hos | m | 出租房源到最近三甲医院的距离 | 1 489.99 | 1 240.11 | |
| bus | m | 出租房源到最近公交站点的距离 | 200.56 | 107.78 |
表2 OLS模型计算结果统计表Tab.2 Calculation results of OLS model |
| 变量 | 未标准化系数 | 标准化系数 Beta | t | 显著性 | 共线性统计 | ||
|---|---|---|---|---|---|---|---|
| B | 标准误差 | 容差 | VIF | ||||
| CBD | -0.000059 | 0 | -0.456 | -14.274 | 0 | 0.190 | 5.257 |
| metro | -0.000113 | 0 | -0.149 | -8.742 | 0 | 0.668 | 1.498 |
| area | -0.000994 | 0 | -0.220 | -13.999 | 0 | 0.788 | 1.269 |
| cost | 0.114406 | 0.009 | 0.221 | 13.401 | 0 | 0.714 | 1.401 |
| bed | -0.080428 | 0.007 | -0.213 | -11.088 | 0 | 0.524 | 1.908 |
| tol | 0.064303 | 0.012 | 0.098 | 5.360 | 0 | 0.580 | 1.725 |
| flo | 0.007272 | 0.001 | 0.240 | 13.966 | 0 | 0.658 | 1.519 |
| sch | -0.000010 | 0 | -0.034 | -1.663 | 0.096 | 0.465 | 2.150 |
| hos | 0.000045 | 0 | 0.160 | 5.617 | 0 | 0.240 | 4.164 |
| bus | 0.000134 | 0 | 0.042 | 2.888 | 0.004 | 0.936 | 1.068 |
| (常量) | 3.474466 | 0.023 | 148.238 | 0 | |||
表3 GWR模型计算结果统计表Tab.3 Calculation results of GWR model |
| 变量 | 回归系数平均值 | 最小值 | 下四分位数 | 中位数 | 上四分位数 | 最大值 | F值 |
|---|---|---|---|---|---|---|---|
| CBD | -0.18633 | -0.29631 | -0.20143 | -0.17185 | -0.15857 | -0.11160 | 7.50951 |
| metro | -0.03981 | -0.09034 | -0.05232 | -0.04309 | -0.02392 | 0.01439 | 8.37483 |
| area | -0.15696 | -0.25438 | -0.21182 | -0.18024 | -0.09528 | -0.02636 | 18.02436 |
| cost | 0.06647 | 0.04793 | 0.05845 | 0.06986 | 0.07423 | 0.07870 | 12.84838 |
| bed | -0.04864 | -0.10077 | -0.06937 | -0.03936 | -0.02985 | -0.01619 | 9.92802 |
| tol | 0.02221 | -0.00360 | 0.01440 | 0.02337 | 0.03056 | 0.05125 | 14.71409 |
| flo | 0.11055 | 0.07146 | 0.09595 | 0.11461 | 0.12479 | 0.14792 | 13.84002 |
| sch | 0.02899 | -0.03939 | -0.00905 | 0.03600 | 0.05534 | 0.09065 | 7.41810 |
| hos | 0.03225 | -0.06797 | 0.01362 | 0.04595 | 0.05749 | 0.10955 | 7.20407 |
| bus | 0.00667 | -0.0359 | -0.01178 | 0.00696 | 0.02899 | 0.05420 | 16.90364 |
| intercept | 3.45248 | 3.39890 | 3.43537 | 3.45494 | 3.47088 | 3.49325 | 8.54382 |
| 模型F值 | 10.33490 | CV | 0.04781 | ||||
| 0.61779 | sigma | 0.21200 | |||||
表4 各区间段地铁对住宅租金影响的地理加权回归结果统计表Tab.4 Results of metro’ impact on residential rent in every interval based on GWR model |
| 最近地铁站距离(m) | 样本个数 (个) | 样本比例 (%) | 累计百 分比(%) | 回归系数 平均值 | Stdresidual | Cooks D | local R2 | 住宅租金平均 增值(元/m2) |
|---|---|---|---|---|---|---|---|---|
| 0~200 | 239 | 10.70 | 10.70 | -0.04092 | -0.22277 | 0.00053 | 0.63058 | 1.29220 |
| 200~400 | 674 | 30.18 | 40.89 | -0.03187 | 0.06857 | 0.00067 | 0.62661 | 1.00641 |
| 400~600 | 628 | 28.12 | 69.01 | -0.03757 | 0.03355 | 0.00168 | 0.61470 | 1.18641 |
| 600~800 | 247 | 11.06 | 80.07 | -0.05332 | 0.00531 | 0.00100 | 0.62723 | 1.68377 |
| 800~1 000 | 89 | 3.99 | 84.06 | -0.05364 | -0.04881 | 0.00062 | 0.62718 | 1.69388 |
| 1 000~1 200 | 81 | 3.63 | 87.68 | -0.04626 | -0.28950 | 0.00050 | 0.61505 | 1.46083 |
| 1 200~1 400 | 88 | 3.94 | 91.63 | -0.04416 | 0.45174 | 0.00342 | 0.62199 | 1.39451 |
| 1 400~1 600 | 84 | 3.76 | 95.39 | -0.04175 | 0.05788 | 0.00038 | 0.65018 | 1.31841 |
| 1 600~1 800 | 14 | 0.63 | 96.01 | -0.04485 | -0.16285 | 0.00052 | 0.63168 | - |
| 1 800~2 000 | 9 | 0.40 | 96.42 | -0.04476 | 0.53887 | 0.00195 | 0.62676 | - |
| 2 000~2 200 | 73 | 3.27 | 99.69 | -0.04995 | -0.33281 | 0.00029 | 0.59999 | - |
| 2 200~2 400 | 6 | 0.27 | 99.96 | -0.05089 | 0.77962 | 0.00052 | 0.60099 | - |
| 2 400~2 600 | 1 | 0.04 | 100.00 | -0.03633 | 2.99162 | 0.17911 | 0.58598 | - |
| [1] |
苏亚艺, 朱道林, 耿槟. 北京市住宅租金空间结构及其影响因素[J]. 经济地理, 2014, 34(4):64-69.
|
| [2] |
唐文彬, 张飞涟, 颜红艳, 等. 城市轨道交通对沿线住宅价值影响的空间效应[J]. 湖南科技大学学报:社会科学版, 2013, 16(6):96-100.
|
| [3] |
|
| [4] |
郑燕巧, 焦世泰, 张晓奇. 城市结构对轨道交通系统与房地产价格关系的影响——以北京、杭州、南京、成都4个城市为例[J]. 经济地理, 2019, 39(6):75-85.
|
| [5] |
汪佳莉, 季民河, 邓中伟. 基于地理加权特征价格法的上海外环内住宅租金分布成因分析[J]. 地域研究与开发, 2016, 35(5):72-80.
|
| [6] |
战昶威. 共享单车、地铁与城市住宅租金——基于李嘉图租金理论的再推导[J]. 现代城市研究, 2019(6):24-30,68.
|
| [7] |
|
| [8] |
崔娜娜, 古恒宇, 沈体雁. 北京市住房价格和租金的空间分异与相互关系[J]. 地理研究, 2019, 38(6):1420-1434.
|
| [9] |
|
| [10] |
|
| [11] |
张若曦, 贾士军. 广州市住宅租金影响因素的研究[J]. 工程管理学报, 2014, 28(6):118-123.
|
| [12] |
|
| [13] |
尹上岗, 宋伟轩, 马志飞, 等. 南京市住宅价格时空分异格局及其影响因素分析——基于地理加权回归模型的实证研究[J]. 人文地理, 2018, 33(3):68-77.
|
| [14] |
陈成吨, 林善浪, 叶炜. 城市快速轨道交通对楼宇租金的影响研究——兼论福州城市快速轨道交通建设与楼宇经济联动发展[J]. 福建师范大学学报:哲学社会科学版, 2017(4):100-106.
|
| [15] |
|
| [16] |
|
| [17] |
王洪强, 李小雪, 张英婕. 上海市住宅租金价格空间分异格局及其影响因素分析[J]. 管理现代化, 2019(5):95-100.
|
| [18] |
阚博颖, 濮励杰, 徐彩瑶, 等. 基于GWR模型的南京主城区住宅地价空间异质性驱动因素研究[J]. 经济地理, 2019, 39(3):100-107.
|
/
| 〈 |
|
〉 |