
数字普惠金融对农村消费的影响研究——基于空间计量模型
|
黎翠梅(1969—),女,湖南华容人,博士,教授,研究方向为农村金融。E-mail:licuimei999@163.com |
收稿日期: 2021-07-28
修回日期: 2021-10-12
网络出版日期: 2025-03-31
基金资助
国家自然科学基金项目(71673307)
教育部人文社会科学规划基金项目(17YJA790040)
Influence of Digital Inclusive Finance on Rural Consumption:Based on Spatial Econometric Model
Received date: 2021-07-28
Revised date: 2021-10-12
Online published: 2025-03-31
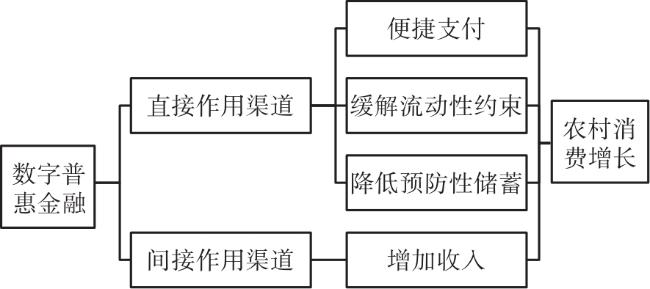
提升农村消费水平是扩大消费、拉动内需、促进经济增长的重要途径,而数字普惠金融可依托数字信息技术创新金融服务,增强金融可获性,从而刺激农村消费增长。文章基于我国2011—2018年的省级面板数据,运用空间计量模型,实证检验数字普惠金融对农村消费的影响及作用机制。研究表明:数字普惠金融可以促进农村消费增长,且空间溢出效应显著;数字普惠金融借助数字化支付、信贷、保险等途径直接刺激农村消费增长,数字化支付是最主要的影响渠道;在间接渠道方面,数字普惠金融能够提高居民收入,从而间接促进农村消费增长;数字普惠金融对农村消费的影响存在区域差异。因此,为促进农村消费增长,我国应加快数字金融服务体系建设,在因地制宜基础上引导地区间加强合作。
黎翠梅 , 周莹 . 数字普惠金融对农村消费的影响研究——基于空间计量模型[J]. 经济地理, 2021 , 41(12) : 177 -186 . DOI: 10.15957/j.cnki.jjdl.2021.12.019
Improving the level of rural consumption is an important way to expand consumption,stimulate domestic demand and promote economic growth. Digital inclusive finance can rely on digital information technology to innovate financial services and enhance financial availability,so as to stimulate the growth of rural consumption. Based on China's provincial panel data from 2011 to 2018,this paper empirically tests the impact and mechanism of digital inclusive finance on rural consumption by using spatial econometric model. The research shows that digital inclusive finance can promote the growth of rural consumption,and the spatial spillover effect is significant. Digital inclusive finance directly stimulates the growth of rural consumption by means of digital payment,credit and insurance,and digital payment is the main influence channel. In terms of indirect channels,digital inclusive finance can improve residents' income,so as to indirectly promote the growth of rural consumption. There are regional differences in the impact of digital inclusive finance on rural consumption. Therefore,in order to promote the growth of rural consumption,China should speed up the construction of digital financial service system and guide regions to strengthen cooperation on the basis of adjusting measures to local conditions.
表1 变量具体含义、公式及描述性统计Tab.1 Specific meaning,formula and descriptive statistics of variables |
| 评价指标 | 基本含义及公式 | 单位 | 平均值 | 标准差 | 最小值 | 最大值 |
|---|---|---|---|---|---|---|
| 农村居民消费率(cr) | 农村居民消费总支出/GDP | % | 10.26094 | 4.831266 | 1.444793 | 22.63597 |
| 数字普惠金融指数(df) | 各省数字普惠金融发展状况 | - | 188.1858 | 84.97977 | 18.33 | 377.73 |
| 农村收入水平(income) | 农村居民人均可支配收入 | 元/人 | 10 489.01 | 4 134.128 | 3 909.4 | 25 756 |
| 农村医疗水平(health) | 每千农村人口村卫生室人员数 | 人 | 1.792292 | 1.314557 | 0.61 | 10.75 |
| 农村老龄化水平(old) | 农村老年抚养比 | % | 16.43892 | 5.060916 | 7.05 | 34.77 |
| 农业机械化水平(power) | 农村人均农业机械总动力 | kW/人 | 1.651533 | 0.7638941 | 0.3263889 | 4.04299 |
| 农村物价水平(cpi) | 农村居民消费价格指数 | - | 1.078967 | 0.048217 | 1 | 1.182656 |
| 农户固定资产投资水平(fix) | 农户固定资产投资/农林牧渔业增加值 | % | 20.65613 | 9.782636 | 1.681345 | 49.26641 |
| 财政支农水平(fsa) | 地方农林水事务支出 | 亿元 | 470.4794 | 218.2334 | 91.78 | 1 217.919 |
| 教育支持力度(edu) | 地方教育支出/地方财政总支出 | % | 16.54566 | 2.597748 | 9.894548 | 22.21688 |
| 产业结构(str) | 第二、三产业占GDP比重 | % | 90.1678 | 5.112291 | 73.86766 | 99.68063 |
| 城镇化水平(urban) | 城镇人口占地区总人口比重 | % | 57.11056 | 12.29909 | 34.96685 | 89.60663 |
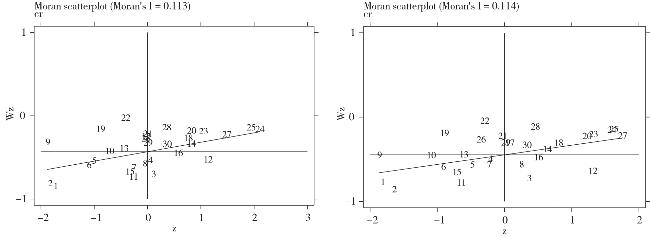
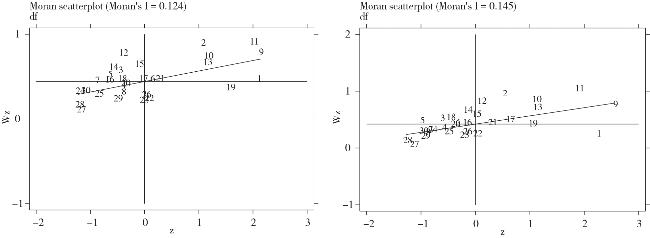
表2 农村居民消费率和数字普惠金融的全局莫兰指数Tab.2 Global Moran index of consumption rate of rural residents and digital inclusive finance |
| 年份 | cr | df | |||||
|---|---|---|---|---|---|---|---|
| Moran's I | Z值 | P值 | Moran's I | Z值 | P值 | ||
| 2011 | 0.113 | 3.822 | 0.000 | 0.124 | 4.098 | 0.000 | |
| 2012 | 0.111 | 3.750 | 0.000 | 0.142 | 4.613 | 0.000 | |
| 2013 | 0.114 | 3.821 | 0.000 | 0.136 | 4.454 | 0.000 | |
| 2014 | 0.117 | 3.903 | 0.000 | 0.137 | 4.495 | 0.000 | |
| 2015 | 0.116 | 3.854 | 0.000 | 0.114 | 3.898 | 0.000 | |
| 2016 | 0.112 | 3.770 | 0.000 | 0.126 | 4.229 | 0.000 | |
| 2017 | 0.116 | 3.856 | 0.000 | 0.133 | 4.398 | 0.000 | |
| 2018 | 0.114 | 3.813 | 0.000 | 0.145 | 4.681 | 0.000 | |
表3 LM检验Tab.3 LM test |
| 检验 | LM值 | P值 |
|---|---|---|
| LM-Lag检验 | 9.221 | 0.002 |
| 稳健的LM-Lag检验 | 3.083 | 0.079 |
| LM-Error检验 | 33.545 | 0.000 |
| 稳健的LM-Error检验 | 27.407 | 0.000 |
表4 模型回归结果Tab.4 Model regression results |
| 变量名称 | SAR | SEM | SDM |
|---|---|---|---|
| lndf | -0.0124(-0.62) | 0.0327(0.85) | 0.1020**(2.26) |
| lnincome | 0.7650***(4.78) | 0.9950***(5.93) | 0.7010***(3.81) |
| lnhealth | 0.0458*(1.90) | 0.0446*(1.93) | 0.0083(0.36) |
| lnold | 0.0894**(2.00) | 0.1240***(2.69) | 0.0408(1.00) |
| lnpower | 0.1010***(3.00) | 0.0954***(2.65) | 0.0785**(2.46) |
| lncpi | -0.2980(-0.52) | 0.6130(0.97) | -1.6250**(-2.16) |
| lnfix | -0.0092(-0.29) | -0.0280(-0.88) | -0.0214(-0.74) |
| lnfsa | 0.0468(0.97) | 0.0373(0.73) | 0.1250***(2.59) |
| lnedu | 0.0645(0.79) | 0.1050(1.10) | 0.1300*(1.66) |
| lnstr | -0.7710(-1.50) | -0.5300(-1.01) | 0.2580(0.55) |
| lnurban | -1.0700***(-3.89) | -1.2130***(-4.16) | -1.4250***(-5.45) |
| Constant | 1.2350(0.53) | -0.7370(-0.31) | |
| W×lndf | 0.181**(2.16) | ||
| 控制变量 | - | - | 空间滞后 |
| Log-L | 216.8243 | 209.3338 | 359.6703 |
| σ2 | 0.0044*** | 0.0045*** | 0.0029*** |
| 拟合优度 | 0.9127 | 0.9020 | 0.9366 |
| 豪斯曼检验 | -12.17 | -11.99 | 84.06*** |
| LR检验 | 285.69*** | 300.67*** |
表5 空间效应分解Tab.5 Spatial effect decomposition |
| 变量 | 直接效应 | 间接效应 | 总效应 |
|---|---|---|---|
| lndf | 0.1048850** | 0.2010570* | 0.3059419*** |
| lnincome | 0.6913571*** | 1.1691690** | 1.8605260*** |
| lnhealth | 0.0097215 | -0.3845873*** | -0.3748658*** |
| lnold | 0.0394278 | -0.5002929*** | -0.4608651*** |
| lnpower | 0.0783926** | -0.5191267*** | -0.4407342*** |
| lncpi | -1.6360410** | -6.5347050*** | -8.1707460*** |
| lnfix | -0.0215592 | -0.2650941* | -0.2866533* |
| lnfsa | 0.1248362*** | 0.4351918** | 0.5600279*** |
| lnedu | 0.1328793* | -1.8841570*** | -1.7512780*** |
| lnstr | 0.3087180 | 6.7961120 | 7.1048300 |
| lnurban | -1.4300750*** | -1.2991850 | -2.7292600** |
表6 数字普惠金融直接渠道的效应分析Tab.6 Effect analysis of direct channel of digital financial inclusion |
| 变量 | 直接效应 | 间接效应 | 总效应 |
|---|---|---|---|
| lnpay | 0.0140467** | 0.1674606*** | 0.1815073*** |
| lncredit | 0.0384214* | -0.0640834 | -0.0256619 |
| lninsurance | 0.0037301 | 0.1284852*** | 0.1322154*** |
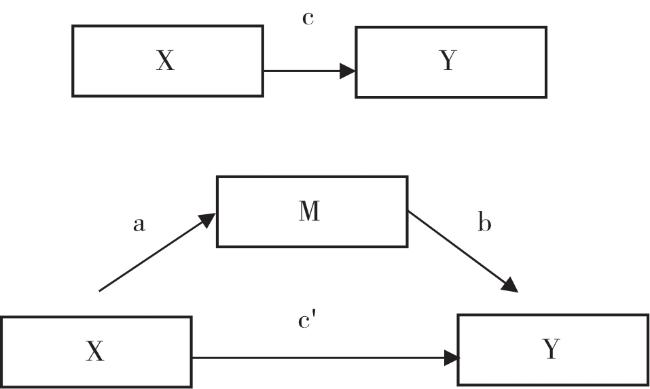
表7 中介模型回归结果Tab.7 Regression results of mediation model |
| 被解释 变量 | 模型(1) lncr | 模型(2) lnincome | 模型(3) lncr |
|---|---|---|---|
| lndf | 0.1430***(3.12) | 0.0590***(3.78) | 0.1020**(2.26) |
| lnincome | 0.7010***(3.81) | ||
| lnhealth | 0.0312(1.34) | 0.0251***(3.17) | 0.0083(0.36) |
| lnold | 0.0186(0.45) | -0.0438***(-3.09) | 0.0408(1.00) |
| lnpower | 0.1000***(3.07) | 0.0303***(2.72) | 0.0785**(2.46) |
| lncpi | -1.9970***(-2.66) | -0.9180***(-3.59) | -1.6250**(-2.16) |
| lnfix | 0.0331(1.23) | 0.0678***(7.38) | -0.0214(-0.74) |
| lnfsa | 0.1350***(2.69) | 0.0129(0.77) | 0.1250***(2.59) |
| lnedu | 0.1290(1.60) | -0.0171(-0.62) | 0.1300*(1.66) |
| lnstr | 0.3050(0.65) | -0.2440(-1.51) | 0.2580(0.55) |
| lnurban | -0.9370***(-3.89) | 0.6500***(7.92) | -1.4250***(-5.45) |
| 控制变量 | 空间滞后 | 空间滞后 | 空间滞后 |
| Log-L | 349.2335 | 605.5264 | 359.6703 |
| σ2 | 0.0032*** | 0.0004*** | 0.0029*** |
| 拟合优度 | 0.9293 | 0.9893 | 0.9366 |
表8 数字普惠金融影响农村消费的异质性分析Tab.8 Heterogeneity analysis of the impact of digital inclusive finance on rural consumption |
| 地区 | 变量 | 直接效应 | 间接效应 | 总效应 |
|---|---|---|---|---|
| 经济发达地区 | lndf | -0.0246424 | 0.6196839** | 0.5950415** |
| 经济发展中等地区 | lndf | 0.0979531** | -0.2715885*** | -0.1736354*** |
| 经济落后地区 | lndf | -0.100135 | 0.0762064 | -0.0239286 |
| [1] |
潘红虹, 唐珏岚. 人口老龄化对居民消费率的影响研究[J]. 江西社会科学, 2021, 41(1):51-60.
|
| [2] |
李金昌, 窦雪霞. 经济转型时期中国农村居民消费与收入关系变迁实证分析[J]. 中国农村经济, 2007(7):45-52.
|
| [3] |
张勋, 万广华, 张佳佳, 等. 数字经济、普惠金融与包容性增长[J]. 经济研究, 2019, 54(8):71-86.
|
| [4] |
郭峰, 王靖一, 王芳, 等. 测度中国数字普惠金融发展:指数编制与空间特征[J]. 经济学(季刊), 2020, 19(4):1401-1418.
|
| [5] |
|
| [6] |
|
| [7] |
|
| [8] |
陈慧卿, 陈国生, 魏晓博, 等. 数字普惠金融的增收减贫效应——基于省际面板数据的实证分析[J]. 经济地理, 2021, 41(3):184-191.
|
| [9] |
易行健, 周利. 数字普惠金融发展是否显著影响了居民消费——来自中国家庭的微观证据[J]. 金融研究, 2018(11):47-67.
|
| [10] |
张勋, 杨桐, 汪晨, 等. 数字金融发展与居民消费增长:理论与中国实践[J]. 管理世界, 2020, 36(11):48-63.
|
| [11] |
邹新月, 王旺. 数字普惠金融对居民消费的影响研究——基于空间计量模型的实证分析[J]. 金融经济学研究, 2020, 35(4):133-145.
|
| [12] |
郭华, 张洋, 彭艳玲, 等. 数字金融发展影响农村居民消费的地区差异研究[J]. 农业技术经济, 2020(12):66-80.
|
| [13] |
|
| [14] |
|
| [15] |
|
| [16] |
|
| [17] |
王策, 周博. 房价上涨、 涟漪效应与预防性储蓄[J]. 经济学动态, 2016(8):71-81.
|
| [18] |
何燕, 李静. 授人以渔:数字普惠金融的减贫效应及就业机制[J]. 消费经济, 2021, 37(3):69-79.
|
| [19] |
王修华, 黄明. 金融资源空间分布规律:一个金融地理学的分析框架[J]. 经济地理, 2009, 29(11):1808-1811,1815.
|
| [20] |
|
| [21] |
|
| [22] |
|
| [23] |
温忠麟. 张雷, 侯杰泰, 等. 中介效应检验程序及其应用[J]. 心理学报, 2004(5):614-620.
|
| [24] |
王翠琴, 李林, 薛惠元. 人口年龄结构、城乡居民基本养老保险对农村居民消费率的影响——基于2010—2017年中国省际面板数据的实证分析[J]. 社会保障研究, 2020(3):85-93.
|
| [25] |
王宏伟. 中国农村居民消费的基本趋势及制约农民消费行为的基本因素分析[J]. 管理世界, 2000(4):163-174.
|
| [26] |
丁继红, 应美玲, 杜在超. 我国农村家庭消费行为研究——基于健康风险与医疗保障视角的分析[J]. 金融研究, 2013(10):154-166.
|
| [27] |
朱勤, 魏涛远. 中国人口老龄化与城镇化对未来居民消费的影响分析[J]. 人口研究, 2016, 40(6):62-75.
|
| [28] |
周振, 张琛, 彭超, 等. 农业机械化与农民收入:来自农机具购置补贴政策的证据[J]. 中国农村经济, 2016(2):68-82.
|
| [29] |
韩星焕. 农村居民消费影响因素的实证分析——以吉林省为例[J]. 农业技术经济, 2012(11):78-84.
|
| [30] |
王建平, 张宇青. 农户固定资产投资、收入结构与农民消费——基于脉冲响应函数与方差分析[J]. 农业考古, 2013(3):244-249.
|
| [31] |
朱建军, 常向阳. 地方财政支农支出对农村居民消费影响的面板模型分析[J]. 农业技术经济, 2009(2):38-45.
|
| [32] |
刘志忠, 吴飞. 地方政府财政支出的民生化进程与农村居民消费——基于总量和分类支出视角下的理论分析与实证检验[J]. 财经理论与实践, 2014, 35(1):75-80.
|
| [33] |
付波航, 方齐云, 宋德勇. 城镇化、人口年龄结构与居民消费——基于省际动态面板的实证研究[J]. 中国人口·资源与环境, 2013, 23(11):108-114.
|
| [34] |
潘明清, 高文亮. 我国城镇化对居民消费影响效应的检验与分析[J]. 宏观经济研究, 2014(1):118-125.
|
| [35] |
|
| [36] |
鲁钊阳, 郑中伟. 经济新常态下新消费增长点培育的逻辑起点、约束条件与路径选择[J]. 经济问题探索, 2016(1):1-6.
|
| [37] |
杜金岷, 韦施威, 吴文洋. 数字普惠金融促进了产业结构优化吗?[J]. 经济社会体制比较, 2020(6):38-49.
|
| [38] |
罗娟, 李宝珍. 数字普惠金融对我国消费不平等的影响研究——来自中国家庭金融调查及县级数据的证据[J]. 消费经济, 2021, 37(4):75-83.
|
| [39] |
吴雨, 李晓, 李洁, 等. 数字金融发展与家庭金融资产组合有效性[J]. 管理世界, 2021, 37(7):92-104,7.
|
/
| 〈 |
|
〉 |