
我国工业产能过剩的区域差异及成因分析
|
曹秋菊(1969—),女,湖南衡阳人,博士,教授,硕士生导师,研究方向为世界经济理论与投资。E-mail:345995618@qq.com |
收稿日期: 2021-03-14
修回日期: 2021-10-09
网络出版日期: 2025-03-31
基金资助
广西哲学社会科学规划研究课题(21FJL008)
广西财经学院2020年度“陆海经济一体化协同创新中心”研究项目(2020C08)
广西财经学院博士科研启动经费课题
Regional Differences and Causes of Industrial Overcapacity in China
Received date: 2021-03-14
Revised date: 2021-10-09
Online published: 2025-03-31
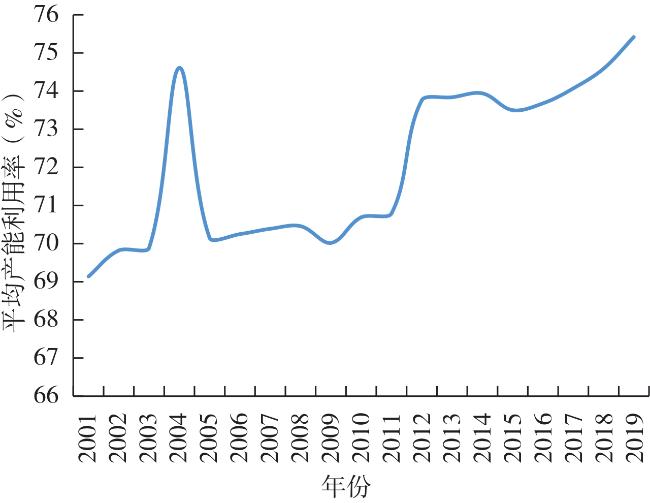
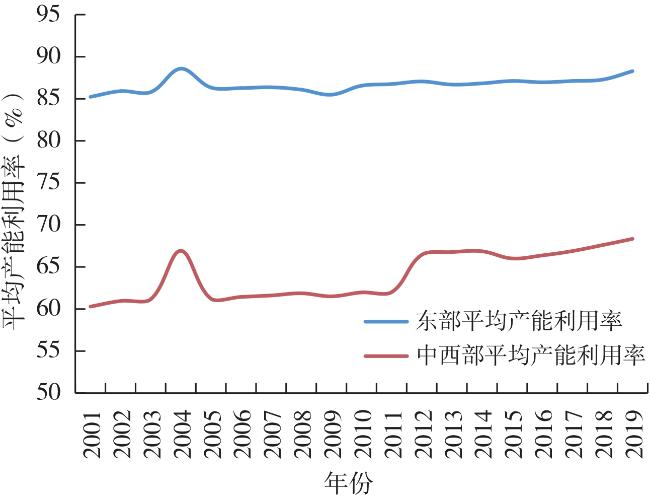
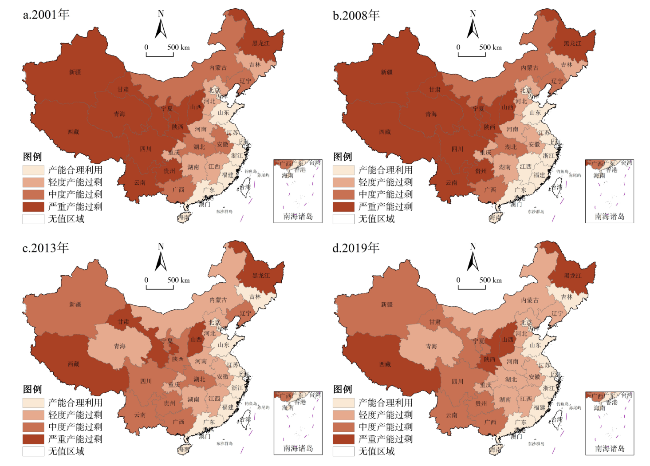
基于2001—2019年省际面板数据,运用SFA方法对其生产环节的产能利用率进行测算,并测算了省际销售环节的产能利用率,进而得到我国省域工业产能利用率。然后,根据产能过剩指数与产能利用率之间的关系计算出2001—2019年我国省际工业产能过剩指数。主要结论包括:①整体来看,2001—2019年中国工业平均产能利用率为70.56%,存在轻度产能过剩。从区域来看,东部地区绝大部分省域的产能利用合理,中部地区和西部地区都出现了产能过剩问题,且中部地区绝大部分省域为中度产能过剩,西部地区绝大部省域出现了严重的产能过剩。②从时间上看,我国产能过剩指数总体上呈下降趋势,即产能过剩问题随着时间的推移略有缓解。③究其原因,主要有我国区域经济发展不充分不平衡,区域产业结构、技术水平、区域资源配置与政策环境差异等。因此,要立足国内大循环、协调区域经济发展和协调区域科技发展水平,推进高质量国际投资与区域制造业分工优化相融合与协调发展,以破解我国区域性产能过剩的困境。
曹秋菊 , 唐新明 . 我国工业产能过剩的区域差异及成因分析[J]. 经济地理, 2021 , 41(12) : 132 -141 . DOI: 10.15957/j.cnki.jjdl.2021.12.014
This paper extends the connotation of the capacity utilization from production to sales,estimates the capacity utilization rate of provincial marketing chain using the logarithm production model and the method of SFA based on provincial panel data in China,and measures the industrial capacity utilization rate of provinces in China. According to the relationship between overcapacity index and the capacity utilization rate,it calculates industrial overcapacity index during 2001 and 2019 in China's provinces. The main conclusions are as follows: 1) On the whole,China's average industrial capacity utilization rate was 70.56% from 2001 to 2019,indicating slight overcapacity. From the regional perspective,the vast majority of provinces (municipalities) in the eastern region have reasonable capacity utilization,the central region and western region have overcapacity problem, the vast majority provinces of the central region is moderate overcapacity,and the vast majority of provinces (autonomous regions) in the western region have serious overcapacity problem. 2) From the perspective of time,China's overcapacity index showed a downward trend,that is,the problem of overcapacity eased slightly as time went by. 3) However,according to recent studies,overcapacity in traditional industries has not been completely solved,emerging industries are in a prominent position of overcapacity,which has become a constraint factor for high-quality economic development and opening-up in China under the new development pattern. The reasons are the impact of unbalanced regional economic development level,difference of regional industrial structure,difference in technical level,differences of regional resource allocation and policy environment. Therefore,based on the great domestic cycle, it is necessary to coordinate regional economic development and the level of regional scientific and technological development,and to promote the integration and coordinated development of high-quality international investment and regional manufacturing division optimization, so as to solve the dilemma of regional overcapacity in China.
表1 2001—2019年中国31个省(自治区、直辖市)工业供给侧产能利用率(CUp)和需求侧产能利用率(CUd)(%)Tab.1 Industrial capacity utilization rate based on supply side(CUp) and demand side(CUd)in 31 provinces (autonomous regions,municipalities) in China from 2001 to 2019(Unit: %) |
| 省域名称 | CUp | CUd | |||||||||||
|---|---|---|---|---|---|---|---|---|---|---|---|---|---|
| 2001 | 2004 | 2008 | 2013 | 2016 | 2019 | 2001 | 2004 | 2008 | 2013 | 2016 | 2019 | ||
| 北京 | 88.69 | 88.88 | 89.14 | 89.46 | 89.64 | 90.63 | 98.17 | 111.71 | 98.95 | 98.94 | 98.62 | 99.62 | |
| 天津 | 97.11 | 97.16 | 97.23 | 97.31 | 97.36 | 97.60 | 98.02 | 111.34 | 98.40 | 99.18 | 97.27 | 98.26 | |
| 河北 | 72.09 | 72.52 | 73.10 | 73.81 | 74.22 | 75.02 | 98.05 | 107.17 | 97.30 | 100.37 | 97.64 | 97.95 | |
| 山西 | 42.93 | 43.61 | 44.51 | 45.63 | 46.30 | 47.30 | 97.06 | 95.14 | 97.67 | 101.30 | 101.75 | 101.25 | |
| 内蒙古 | 64.88 | 65.40 | 66.09 | 66.94 | 67.44 | 68.33 | 97.93 | 111.71 | 97.38 | 110.59 | 104.40 | 107.36 | |
| 辽宁 | 65.38 | 65.90 | 66.58 | 67.42 | 67.91 | 68.92 | 97.33 | 108.84 | 97.32 | 99.70 | 103.14 | 103.18 | |
| 吉林 | 77.11 | 77.48 | 77.97 | 78.57 | 78.72 | 79.92 | 96.94 | 97.75 | 97.78 | 103.74 | 103.78 | 107.78 | |
| 黑龙江 | 53.80 | 54.43 | 55.25 | 56.26 | 56.87 | 57.88 | 97.61 | 106.14 | 98.30 | 101.97 | 97.47 | 98.75 | |
| 上海 | 92.11 | 92.25 | 92.43 | 92.65 | 92.78 | 93.15 | 98.83 | 100.31 | 98.72 | 99.55 | 99.75 | 99.82 | |
| 江苏 | 91.78 | 91.93 | 92.12 | 92.35 | 92.48 | 93.43 | 97.06 | 104.39 | 98.14 | 100.91 | 100.50 | 100.80 | |
| 浙江 | 86.38 | 86.61 | 86.92 | 87.29 | 87.51 | 87.85 | 96.59 | 98.65 | 97.27 | 97.89 | 97.20 | 98.02 | |
| 安徽 | 71.32 | 71.77 | 72.36 | 73.08 | 73.51 | 73.91 | 98.32 | 112.38 | 97.43 | 99.89 | 97.44 | 98.73 | |
| 福建 | 85.53 | 85.77 | 86.10 | 86.49 | 86.73 | 88.17 | 96.98 | 93.07 | 97.54 | 97.49 | 97.23 | 97.83 | |
| 江西 | 77.73 | 78.09 | 78.57 | 79.15 | 79.50 | 78.05 | 97.60 | 116.10 | 110.32 | 99.57 | 97.23 | 98.27 | |
| 山东 | 90.75 | 90.91 | 91.12 | 91.38 | 91.53 | 91.79 | 97.77 | 102.35 | 96.46 | 98.73 | 100.15 | 99.01 | |
| 河南 | 72.01 | 72.45 | 73.02 | 73.73 | 74.15 | 74.96 | 97.89 | 105.62 | 98.34 | 100.76 | 99.38 | 99.76 | |
| 湖北 | 62.33 | 62.88 | 63.60 | 64.49 | 65.02 | 65.71 | 97.60 | 112.64 | 97.64 | 103.53 | 105.37 | 107.67 | |
| 湖南 | 73.27 | 73.70 | 74.25 | 74.93 | 75.33 | 75.93 | 98.72 | 106.28 | 98.69 | 99.77 | 98.39 | 98.89 | |
| 广东 | 94.49 | 94.59 | 94.72 | 94.87 | 94.97 | 95.67 | 97.62 | 94.46 | 97.13 | 97.36 | 96.62 | 97.65 | |
| 广西 | 68.96 | 69.43 | 70.06 | 70.83 | 71.28 | 72.25 | 97.18 | 104.99 | 94.85 | 95.71 | 96.00 | 96.73 | |
| 海南 | 98.07 | 98.10 | 98.15 | 98.21 | 98.24 | 98.26 | 95.31 | 82.84 | 98.78 | 91.10 | 94.34 | 98.32 | |
| 重庆 | 73.41 | 73.83 | 74.39 | 75.06 | 75.46 | 75.86 | 97.91 | 101.22 | 97.95 | 98.04 | 98.29 | 99.26 | |
| 四川 | 58.61 | 59.20 | 59.97 | 60.92 | 61.48 | 67.48 | 98.01 | 108.37 | 97.70 | 106.37 | 103.66 | 103.96 | |
| 贵州 | 48.30 | 48.96 | 49.82 | 50.90 | 51.54 | 52.34 | 95.73 | 99.18 | 95.44 | 125.31 | 126.83 | 127.53 | |
| 云南 | 59.92 | 60.49 | 61.24 | 62.17 | 62.72 | 63.21 | 98.61 | 106.37 | 95.18 | 103.95 | 103.51 | 107.51 | |
| 西藏 | 40.58 | 41.26 | 42.17 | 43.31 | 43.98 | 44.98 | 89.32 | 81.66 | 91.84 | 133.56 | 131.23 | 131.73 | |
| 陕西 | 54.90 | 55.51 | 56.32 | 57.32 | 57.92 | 59.92 | 97.17 | 106.44 | 96.98 | 105.80 | 99.38 | 99.77 | |
| 甘肃 | 59.85 | 60.42 | 61.18 | 62.11 | 62.66 | 62.96 | 96.99 | 120.89 | 97.51 | 96.22 | 99.11 | 99.85 | |
| 青海 | 59.88 | 60.45 | 61.20 | 62.13 | 62.68 | 63.02 | 93.32 | 121.60 | 95.12 | 119.69 | 112.26 | 118.72 | |
| 宁夏 | 61.24 | 61.80 | 62.54 | 63.44 | 63.98 | 64.80 | 96.79 | 109.49 | 95.62 | 96.48 | 96.12 | 97.13 | |
| 新疆 | 59.90 | 60.48 | 61.23 | 62.16 | 62.71 | 63.06 | 99.08 | 102.35 | 97.75 | 96.75 | 98.34 | 98.62 | |
表2 2001—2019年我国31个省(自治区、直辖市)工业产能利用率(CU)(%)和工业产能过剩指数(EXCA)Tab.2 Industrial capacity utilization rate (CU) (Unit: %)and industrial overcapacity index (EXCA)of 31 provinces ( autonomous regions, municipalities) in China from 2001 to 2019 |
| 省域名称 | CU | EXCA | |||||||||||
|---|---|---|---|---|---|---|---|---|---|---|---|---|---|
| 2001 | 2004 | 2008 | 2013 | 2016 | 2019 | 2001 | 2004 | 2008 | 2013 | 2016 | 2019 | ||
| 北京 | 87.06 | 99.29 | 88.21 | 88.51 | 88.40 | 90.28 | 1.15 | 1.01 | 1.13 | 1.13 | 1.13 | 1.11 | |
| 天津 | 95.19 | 108.18 | 95.67 | 96.52 | 94.71 | 95.91 | 1.05 | 0.92 | 1.05 | 1.04 | 1.06 | 1.04 | |
| 河北 | 70.68 | 77.72 | 71.12 | 74.08 | 72.48 | 73.48 | 1.41 | 1.29 | 1.41 | 1.35 | 1.38 | 1.36 | |
| 山西 | 41.67 | 41.49 | 43.47 | 46.23 | 47.11 | 47.89 | 2.40 | 2.41 | 2.30 | 2.16 | 2.12 | 2.09 | |
| 内蒙古 | 63.53 | 73.06 | 64.36 | 74.03 | 70.40 | 73.35 | 1.57 | 1.37 | 1.55 | 1.35 | 1.42 | 1.36 | |
| 辽宁 | 63.64 | 71.72 | 64.80 | 67.21 | 70.04 | 71.11 | 1.57 | 1.39 | 1.54 | 1.49 | 1.43 | 1.41 | |
| 吉林 | 74.75 | 75.73 | 76.24 | 81.51 | 81.70 | 86.14 | 1.34 | 1.32 | 1.31 | 1.23 | 1.22 | 1.16 | |
| 黑龙江 | 52.52 | 57.77 | 54.31 | 57.37 | 55.43 | 57.16 | 1.90 | 1.73 | 1.84 | 1.74 | 1.80 | 1.75 | |
| 上海 | 91.03 | 92.54 | 91.25 | 92.24 | 92.55 | 92.98 | 1.10 | 1.08 | 1.10 | 1.08 | 1.08 | 1.08 | |
| 江苏 | 89.09 | 95.96 | 90.40 | 93.19 | 92.95 | 94.19 | 1.12 | 1.04 | 1.11 | 1.07 | 1.08 | 1.06 | |
| 浙江 | 83.43 | 85.44 | 84.55 | 85.45 | 85.06 | 86.11 | 1.20 | 1.17 | 1.18 | 1.17 | 1.18 | 1.16 | |
| 安徽 | 70.12 | 80.65 | 70.50 | 73.00 | 71.63 | 72.97 | 1.43 | 1.24 | 1.42 | 1.37 | 1.40 | 1.37 | |
| 福建 | 82.94 | 79.83 | 83.98 | 84.32 | 84.32 | 86.26 | 1.21 | 1.25 | 1.19 | 1.19 | 1.19 | 1.16 | |
| 江西 | 75.86 | 90.67 | 86.68 | 78.81 | 77.29 | 76.70 | 1.32 | 1.10 | 1.15 | 1.27 | 1.29 | 1.30 | |
| 山东 | 88.73 | 93.04 | 87.90 | 90.23 | 91.67 | 90.89 | 1.13 | 1.07 | 1.14 | 1.11 | 1.09 | 1.10 | |
| 河南 | 70.48 | 76.51 | 71.81 | 74.29 | 73.69 | 74.78 | 1.42 | 1.31 | 1.39 | 1.35 | 1.36 | 1.34 | |
| 湖北 | 60.83 | 70.82 | 62.10 | 66.77 | 68.51 | 70.74 | 1.64 | 1.41 | 1.61 | 1.50 | 1.46 | 1.41 | |
| 湖南 | 72.33 | 78.32 | 73.28 | 74.76 | 74.12 | 75.09 | 1.38 | 1.28 | 1.36 | 1.34 | 1.35 | 1.33 | |
| 广东 | 92.24 | 89.34 | 92.00 | 92.37 | 91.75 | 93.41 | 1.08 | 1.12 | 1.09 | 1.08 | 1.09 | 1.07 | |
| 广西 | 67.01 | 72.90 | 66.45 | 67.79 | 68.43 | 69.89 | 1.49 | 1.37 | 1.50 | 1.48 | 1.46 | 1.43 | |
| 海南 | 93.47 | 81.27 | 96.95 | 89.47 | 92.68 | 96.61 | 1.07 | 1.23 | 1.03 | 1.12 | 1.08 | 1.04 | |
| 重庆 | 71.87 | 74.73 | 72.86 | 73.59 | 74.17 | 75.30 | 1.39 | 1.34 | 1.37 | 1.36 | 1.35 | 1.33 | |
| 四川 | 57.45 | 64.15 | 58.59 | 64.80 | 63.73 | 70.15 | 1.74 | 1.56 | 1.71 | 1.54 | 1.57 | 1.43 | |
| 贵州 | 46.24 | 48.55 | 47.55 | 63.79 | 65.37 | 66.74 | 2.16 | 2.06 | 2.10 | 1.57 | 1.53 | 1.50 | |
| 云南 | 59.08 | 64.34 | 58.29 | 64.63 | 64.92 | 67.96 | 1.69 | 1.55 | 1.72 | 1.55 | 1.54 | 1.47 | |
| 西藏 | 36.24 | 33.70 | 38.73 | 57.84 | 57.72 | 59.26 | 2.76 | 2.97 | 2.58 | 1.73 | 1.73 | 1.69 | |
| 陕西 | 53.34 | 59.09 | 54.62 | 60.65 | 57.56 | 59.78 | 1.87 | 1.69 | 1.83 | 1.65 | 1.74 | 1.67 | |
| 甘肃 | 58.05 | 73.04 | 59.65 | 59.76 | 62.10 | 62.86 | 1.72 | 1.37 | 1.68 | 1.67 | 1.61 | 1.59 | |
| 青海 | 55.88 | 73.51 | 58.22 | 74.37 | 70.37 | 74.81 | 1.79 | 1.36 | 1.72 | 1.34 | 1.42 | 1.34 | |
| 宁夏 | 59.28 | 67.67 | 59.80 | 61.21 | 61.50 | 62.94 | 1.69 | 1.48 | 1.67 | 1.63 | 1.63 | 1.59 | |
| 新疆 | 59.35 | 61.89 | 59.85 | 60.14 | 61.67 | 62.19 | 1.68 | 1.62 | 1.67 | 1.66 | 1.62 | 1.61 | |
| [1] |
|
| [2] |
|
| [3] |
|
| [4] |
马红旗, 申广军. 规模扩张、“创造性破坏”与产能过剩——基于钢铁企业微观数据的实证分析[J]. 经济学(季刊), 2021, 21(1):71-92.
|
| [5] |
张亚斌, 朱虹, 范子杰. 地方补贴性竞争对我国产能过剩的影响——基于倾向匹配倍差法的经验分析[J]. 财经研究, 2018, 44(5):36-47,152.
|
| [6] |
刘满凤, 刘熙, 徐野, 等. 资源错配、政府干预与新兴产业产能过剩[J]. 经济地理, 2019, 39(8):126-136.
|
| [7] |
|
| [8] |
|
| [9] |
沈利生. 我国潜在经济增长率变动趋势估计[J]. 数量经济技术经济研究, 1999(12):3-6.
|
| [10] |
熊思觅. 产能利用水平与通货膨胀的相关性研究[D]. 大连: 东北财经大学, 2011.
|
| [11] |
|
| [12] |
|
| [13] |
|
| [14] |
|
| [15] |
韩国高, 高铁梅, 王立国, 等. 中国制造业产能过剩的测度、波动及成因研究[J]. 经济研究, 2011(12):18-31.
|
| [16] |
吕品, 李超超, 杨君. 外部需求扩张能否提高中国制造业的产能利用率——基于GMM和LSDV法的面板数据分析[J]. 国际贸易问题, 2016(7):40-50.
|
| [17] |
|
| [18] |
|
| [19] |
|
| [20] |
|
| [21] |
杨振兵, 张诚. 中国工业部门产能过剩的测度与影响因素分析[J]. 南开经济研究, 2015(6):92-109.
|
| [22] |
李铁伦. 中国制造业产能过剩的测度及其影响因素分析[D]. 济南: 山东大学, 2016.
|
| [23] |
张皓, 张梅青, 黄彧. 产能过剩对企业全要素生产率的影响——特征事实与经验证据[J]. 云南财经大学学报, 2018, 34(4):32-45.
|
| [24] |
李瑞杰, 孟祥慧. 溢出效应视角下中国产能过剩空间分布研究[J]. 云南财经大学学报, 2018, 34(10):27-36.
|
| [25] |
陈俊龙, 牛月. 市场不确定性、政府规制与产能过剩分析[J]. 软科学, 2018, 32(10):38-42.
|
| [26] |
徐升艳, 邬径纬. 行政审批改革对产能过剩行业土地供应的影响[J]. 资源科学, 2020, 42(11):2224-2236.
|
| [27] |
韩国高, 邵忠林. 环境规制、地方政府竞争策略对产能过剩的影响[J]. 财经问题研究, 2020(3):29-38.
|
| [28] |
陈晓珊, 刘洪铎. 对外开放、金融发展与产能过剩化解——基于我国国有企业供给侧结构性改革的视角[J]. 财经科学, 2016(10):1-10.
|
| [29] |
刘航, 孙早. 有偏技术进步与工业产能过剩——基于开放格局的供给侧改革[J]. 经济学家, 2017(1):47-54.
|
| [30] |
吕萍, 刘小猛. 对外直接投资如何化解产能过剩?——基于中国工业企业的实证研究[J]. 兰州大学学报:社会科学版, 2020, 48(4):60-68.
|
| [31] |
|
| [32] |
|
/
| 〈 |
|
〉 |