
基于游客GPS轨迹大数据的西藏旅游流格局与成因
|
郑鑫(1995—),女,博士,特别研究助理,研究方向为旅游地理与生态旅游。E-mail:zhengxin0722@igsnrr.ac.cn |
收稿日期: 2024-04-18
修回日期: 2024-10-30
网络出版日期: 2024-12-18
基金资助
国家自然科学基金面上项目(42371253)
国家自然科学基金青年项目(42307588)
自然资源部陆表系统与人地关系重点实验室开放基金资助课题(LBXT2023YB06)
广东省基础与应用基础研究基金项目(2022A1515010696)
Spatial Pattern and Influencing Factors of Tourism Flow in Xizang Autonomous Region Based on Tourists' GPS Trajectory Data
Received date: 2024-04-18
Revised date: 2024-10-30
Online published: 2024-12-18
郑鑫 , 王甫园 , 李俊霏 , 杨兆萍 , 余玲 . 基于游客GPS轨迹大数据的西藏旅游流格局与成因[J]. 经济地理, 2024 , 44(11) : 212 -221 . DOI: 10.15957/j.cnki.jjdl.2024.11.022
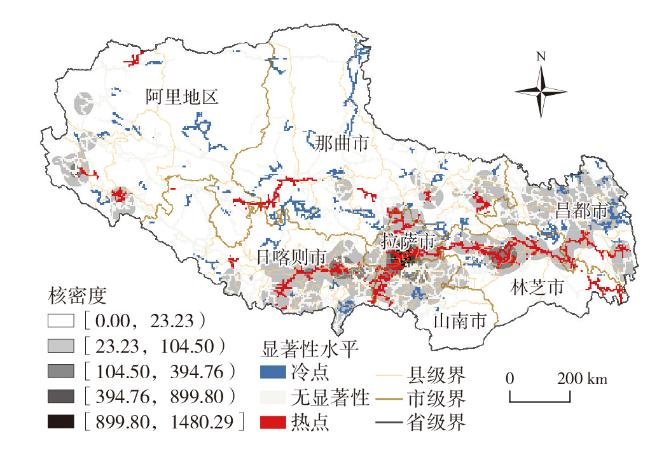
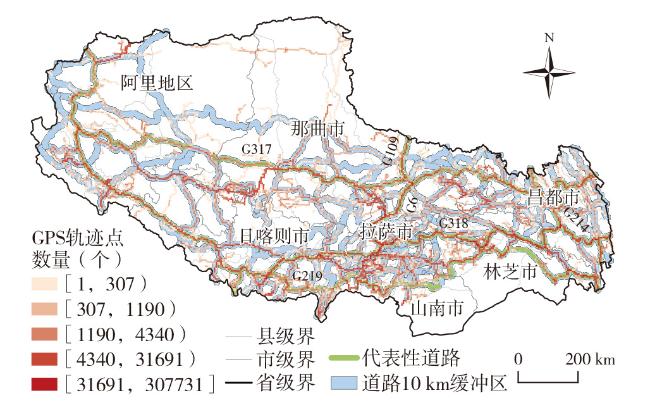
Tourism flow,as a spatial flow phenomenon that reflects the geographical location changes of tourists,can reveal the changes in the people flow,logistics,and information flow in tourist destinations,with tourists as the main body. Based on the GPS trajectory data of tourists in Xizang Autonomous Region from 2018 to 2019,this study uses the methods of spatial autocorrelation,hotspot analysis,geographical detectors and kernel density estimation to identify and discuss the spatial pattern and influencing factors of tourism flows in Xizang. The research findings show that: 1) The spatial linear corridor agglomeration characteristics and spatial correlation characteristics of the overall tourism flow in Xizang are significant. Lhasa City,Shannan City,Nyingchi City and Qamdo City have formed multiple primary and secondary agglomeration centers of tourism flow,and the "core-edge" structural characteristics are prominent. 2) The tourism flow in Xizang has formed a regional tourism network interwoven with two major and eight minor tourism circuits,promoting the spatial agglomeration and diffusion of tourism flow and related elements. 3) In the east of Lhasa City,the tourist flow hotspots areas form obvious linear agglomeration distribution characteristics in space. There are small-scale isolated hotspots areas in Xigaze City,Nagqu City and Ngari Prefecture. 4) Altitude,population density,tourist attraction density,and tourist reception facility density are the main factors affecting the spatial distribution of tourism flows in Xizang. The interaction of multiple factors,such as altitude and temperature-humidity index,altitude and tourism reception facility density,predominantly shapes the spatial distribution of tourism flow in Xizang. 5) The study proposes that tourism flow structure optimization and high-quality tourism development of Xizang can be promoted in ways like optimizing local loops to improve tourism flow network,enhancing the linkage effect of linear elements on tourism resources,fully leveraging the radiating and driving role of core tourism areas,and scientifically managing environmental risks.
表1 西藏旅游流影响因素指标体系与数据来源Tab.1 Index system and data sources of influencing factors of tourism flow in Xizang |
| 要素层 | 指标层 | 说明 | 数据来源与处理 |
|---|---|---|---|
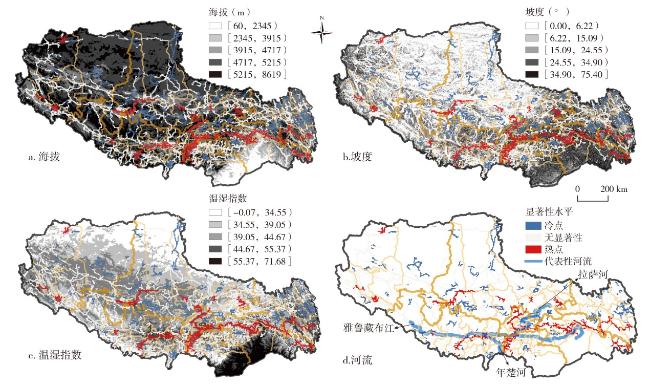
| 自然 地理 条件 | 海拔(N1) | 区县海拔均值 | 中国科学院资源环境科学数据中心 (https://www.resdc.cn/),1 km分辨率 |
| 坡度(N2) | 区县坡度均值 | 运用ArcGIS平台的坡度工具对海拔数据计算生成 | |
| 含氧量(N3) | 区县含氧量均值,计算方法参考石磊等的研究[28] | 中国科学院资源环境科学数据中心 (https://www.resdc.cn/),1 km分辨率 | |
| 植被覆盖率(N4) | 区县植被指数(Normalized Difference Vegetation Index,NDVI)均值 | ||
| 温湿指数(N5) | 区县温湿指数均值,计算方法参考Zhong等的研究[29] | ||
| 风寒指数(N6) | 区县风寒指数均值,计算方法参考Zhong等的研究[29] | ||
| 河流密度(N7) | 区县河流密度均值 | 西藏自治区自然资源厅 (http://zrzyt.xizang.gov.cn/) | |
| 社会 经济 要素 | 人均GDP(E1) | 区县人均GDP均值 | 中国科学院资源环境科学数据中心 (https://www.resdc.cn/),1 km分辨率 |
| 第三产业占比(E2) | 区县第三产业占GDP百分比均值 | ||
| 人口密度(E3) | 区县人口密度均值 | ||
| 旅游 资源 禀赋 | 旅游景点密度(R1) | 区县旅游景点密度均值。旅游景点包含A级旅游景区、世界遗产、自然保护区、森林公园、湿地公园、风景区、人文古迹、寺庙等景点 | 高德地图开放平台 (https://lbs.amap.com/) |
| 旅游 服务 水平 | 旅游接待设施密度(S1) | 区县旅游接待设施密度均值。旅游接待设施包括休闲餐饮、休闲娱乐、酒店住宿、休闲购物和交通设施 | 高德地图开放平台 (https://lbs.amap.com/) |
| 道路密度(S2) | 区县交通路网密度均值。交通路网包含高速公路、国道和省道 | 西藏自治区自然资源厅 (http://zrzyt.xizang.gov.cn/) |
表2 西藏旅游流全局莫兰指数Tab.2 Moran's Index of tourism flow in Xizang |
| Moran's I | z-score | p-value | |
|---|---|---|---|
| 西藏 | 0.28 | 85.85 | 0.00 |
| 拉萨市 | 0.24 | 8.37 | 0.00 |
| 昌都市 | 0.31 | 43.02 | 0.00 |
| 日喀则市 | 0.31 | 30.74 | 0.00 |
| 林芝市 | 0.36 | 23.10 | 0.00 |
| 山南市 | 0.25 | 25.07 | 0.00 |
| 那曲市 | 0.33 | 46.98 | 0.00 |
| 阿里地区 | 0.39 | 34.01 | 0.00 |
表3 西藏旅游流影响因素指标体系与因子探测结果Tab.3 Index system and factor detection results of influencing factors of tourism flow in Xizang |
| 要素层 | 指标层 | p值 | q统计量 |
|---|---|---|---|
| 自然地理条件 | N1海拔 | 0.00 | 0.78 |
| N2坡度 | 0.04 | 0.29 | |
| N3含氧量 | 0.46 | 0.15 | |
| N4植被覆盖率 | 0.37 | 0.46 | |
| N5温湿指数 | 0.03 | 0.30 | |
| N6风寒指数 | 0.05 | 0.23 | |
| N7河流密度 | 0.01 | 0.27 | |
| 社会经济要素 | E1人均GDP | 0.18 | 0.53 |
| E2第三产业占比 | 0.16 | 0.16 | |
| E3人口密度 | 0.02 | 0.63 | |
| 旅游资源禀赋 | R1旅游景点密度 | 0.02 | 0.62 |
| 旅游服务水平 | S1旅游接待设施密度 | 0.01 | 0.61 |
| S2道路密度 | 0.18 | 0.27 |
表4 西藏旅游流影响因素交互探测结果Tab.4 Interactive detection results of influencing factors of tourism flow in Xizang |
| N1 | N2 | N7 | N5 | R1 | S1 | E3 | |
|---|---|---|---|---|---|---|---|
| N1 | 0.78 | ||||||
| N2 | 0.89 | 0.29 | |||||
| N7 | 0.85 | 0.78 | 0.27 | ||||
| N5 | 0.90 | 0.90 | 0.57 | 0.30 | |||
| R1 | 0.85 | 0.76 | 0.73 | 0.72 | 0.62 | ||
| S1 | 0.90 | 0.80 | 0.77 | 0.73 | 0.67 | 0.61 | |
| E3 | 0.86 | 0.85 | 0.77 | 0.75 | 0.72 | 0.74 | 0.63 |
| [1] |
章锦河, 张捷, 李娜, 等. 中国国内旅游流空间场效应分析[J]. 地理研究, 2005, 24(2):293-303.
|
| [2] |
|
| [3] |
秦静, 李郎平, 唐鸣镝, 等. 基于地理标记照片的北京市入境旅游流空间特征[J]. 地理学报, 2018, 73(8):1556-1570.
|
| [4] |
唐顺铁, 郭来喜. 旅游流体系研究[J]. 旅游学刊, 1998 (3):38-41.
|
| [5] |
蒋依依, 刘焱序, 王宁, 等. 2004—2019年全球旅游流网络中心度时空演变[J]. 地理研究, 2022, 41(3):698-712.
|
| [6] |
石建中, 范齐. 亚太经合组织旅游流网络结构演化及影响因素[J]. 自然资源学报, 2022, 37(8):2169-2180.
|
| [7] |
方叶林, 黄震方, 李经龙, 等. 中国市域旅游流网络结构空间分异及其效应研究——基于携程旅行网的大数据挖掘[J]. 自然资源学报, 2022, 37(1):70-82.
|
| [8] |
|
| [9] |
|
| [10] |
|
| [11] |
|
| [12] |
刘大均, 陈君子, 贾垚焱. 8·8九寨沟地震对区域旅游流地理分布及其流动的影响[J]. 干旱区资源与环境, 2020, 34(7):201-208.
|
| [13] |
李磊, 陶卓民, 陆林, 等. 贵州省避暑旅游流网络结构特征及其影响因素[J]. 地理研究, 2021, 40(11):3208-3224.
|
| [14] |
杨勇, 眭霞芸, 刘震. 中国省际虚拟旅游流网络结构的空间演变特征研究[J]. 地理科学进展, 2022, 41(8):1349-1363.
|
| [15] |
|
| [16] |
查晓莉, 徐雨晨, 陆林, 等. 上海迪士尼国内旅游流地理分布与流动特征[J]. 旅游学刊, 2019, 34(6):58-73.
|
| [17] |
王超, 阚瑷珂, 曾业隆, 等. 基于随机森林模型的西藏人口分布格局及影响因素[J]. 地理学报, 2019, 74(4):664-680.
|
| [18] |
刘艳平, 保继刚, 黄应淮, 等. 基于GPS数据的自驾车游客时空行为研究——以西藏为例[J]. 世界地理研究, 2019, 28(1):149-160.
|
| [19] |
朱冬芳, 虞虎, 刘青青, 等. 入藏旅游流网络结构特征与组织模式:基于团队游和自助游视角的比较分析[J]. 地理科学进展, 2021, 40(5):812-824.
|
| [20] |
|
| [21] |
|
| [22] |
孙才志, 李欣. 基于核密度估计的中国海洋经济发展动态演变[J]. 经济地理, 2015, 35(1):96-103.
|
| [23] |
郭源园, 李莉. 西部内陆省区区域经济差异影响因素——以重庆为例[J]. 地理研究, 2017, 36(5):926-944.
|
| [24] |
李俊翰, 高明秀. 滨州市生态系统服务价值与生态风险时空演变及其关联性[J]. 生态学报, 2019, 39(21):7815-7828.
|
| [25] |
|
| [26] |
李维维, 陈田, 马晓龙. 西安城市旅游休闲业态空间热点特征及形成机制[J]. 地理科学, 2020, 40(3):437-446.
|
| [27] |
王劲峰, 徐成东. 地理探测器:原理与展望[J]. 地理学报, 2017, 72(1):116-134.
|
| [28] |
石磊, 黄晓清, 尼玛吉, 等. 西藏自治区旅游气候适应性分析[J]. 冰川冻土, 2015, 37(5):1412-1419.
|
| [29] |
|
| [30] |
|
| [31] |
王秀伟, 李晓军. 中国乡村旅游重点村的空间特征与影响因素[J]. 地理学报, 2022, 77(4):900-917.
|
| [32] |
王甫园, 王开泳, 虞虎, 等. 珠三角城市群生态游憩空间分异特征及关联性因素[J]. 地理研究, 2020, 39(9):2148-2164.
|
| [33] |
荣慧芳, 陶卓民. 基于网络数据的乡村旅游热点识别及成因分析——以江苏省为例[J]. 自然资源学报, 2020, 35(12):2848-2861.
|
| [34] |
|
| [35] |
长安, 葛全胜, 方修琦, 等. 青藏铁路旅游线气候适宜性分析[J]. 地理研究, 2007, 26(3):533-540.
|
| [36] |
|
| [37] |
|
| [38] |
汪德根, 陈田, 陆林, 等. 区域旅游流空间结构的高铁效应及机理——以中国京沪高铁为例[J]. 地理学报, 2015, 70(2):214-233.
|
/
| 〈 |
|
〉 |