
浙江省县域绿色金融发展水平变化特征、影响因素与情景预测
|
孔凡斌(1967—),男,博士,教授,研究方向为生态经济、农林经济和资源环境经济学。E-mail:kongfanbin@aliyun.com |
收稿日期: 2024-03-25
修回日期: 2024-11-19
网络出版日期: 2024-12-18
基金资助
国家自然科学基金项目(42371294)
国家自然科学基金项目(42301328)
国家自然科学基金项目(42071283)
Change Characteristics of the Green Finance Development Level and Its Influencing Factors and Scenario Prediction in Counties of Zhejiang Province
Received date: 2024-03-25
Revised date: 2024-11-19
Online published: 2024-12-18
孔凡斌 , 罗锐峰 , 徐彩瑶 . 浙江省县域绿色金融发展水平变化特征、影响因素与情景预测[J]. 经济地理, 2024 , 44(11) : 132 -140 . DOI: 10.15957/j.cnki.jjdl.2024.11.014
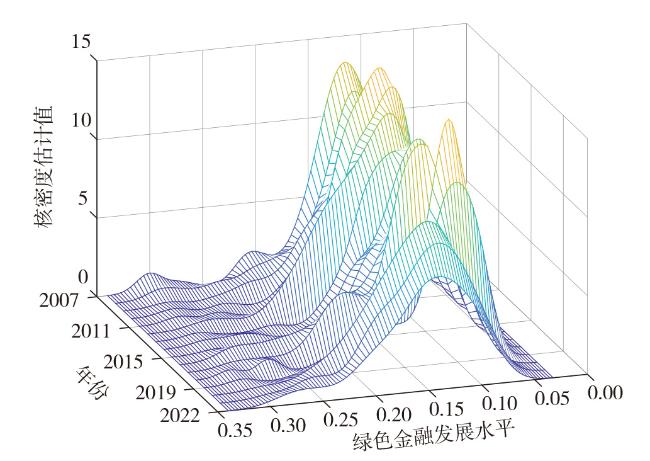
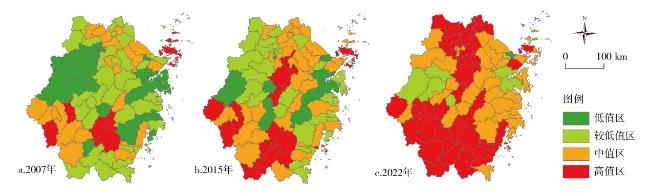
Taking Zhejiang Province as the research area,this paper establishes an evaluation index system of the green finance development level at county level, and reveals the evolution characteristics of green finance development from 2007 to 2022. It uses spatial econometric models to identify the key factors influencing the green finance development level in counties of Zhejiang Province, and system dynamics (SD) models for simulation and prediction. It's found that: 1) The green finance development level has been consistently rising in counties of Zhejiang Province,with notable spatial disparities among them. 2) The green finance development level has shifted from primarily low-value areas to predominantly high-value areas,exhibiting clear directional characteristics and a general trend of shrinking distribution range. 3) Factors such as technological innovation,deposit level,industrial structure upgrading and environmental pollution exhibit a positive impact, economic development and energy consumption level have a significant negative effect. 4) When Zhejiang Province maintains a collaborative development path, the county-level green finance development capacity achieves the highest scores which are 75.46 in 2030 and 78.80 in 2035,respectively. Conversely, under the stable status quo path, the county-level green finance development capability achieves the lowest scores which are 74.78 in 2030 and 77.04 in 2035, respectively.
表1 区域绿色金融发展水平评价指标体系及说明Tab.1 Evaluation index system and explanation of regional green finance development level |
| 一级指标 | 二级指标 | 三级指标 | 指标定义 | 影响方向 | 权重 |
|---|---|---|---|---|---|
| 绿色金融 发展水平 | 绿色信贷 | 绿色信贷占比 | 五大行绿色信贷总额/五大行信贷总额 | + | 0.1456 |
| 绿色投资 | 财政环境保护支出占比 | 财政环境保护支出/财政一般预算支出 | - | 0.0036 | |
| 环境污染治理投资占GDP比重 | 环境污染治理投资/GDP | + | 0.1932 | ||
| 绿色保险 | 农业保险规模占比 | 农业保险支出/保险总支出 | + | 0.2154 | |
| 农业保险赔付率 | 农业保险支出/农业保险收入 | + | 0.3103 | ||
| 绿色债券 | 绿色债券发展程度 | 县域GDP占比×市级绿色债券发行总额 | + | 0.1319 |
表2 浙江省县域绿色金融发展水平标准差椭圆的相关参数Tab.2 Related parameters of standard deviation ellipse of green finance development level in counties of Zhejiang Province |
| 年份 | 重心经度 | 重心纬度 | 长度 | 扁率 | 面积 | 方位角 | 移动距离 | ||||
|---|---|---|---|---|---|---|---|---|---|---|---|
| 东经(°) | 北纬(°) | X轴(km) | Y轴(km) | (万km2) | (°) | (km) | |||||
| 2007 | 120.41 | 29.31 | 117.72 | 167.34 | 0.30 | 6.19 | 27.79 | - | |||
| 2011 | 120.51 | 29.45 | 119.48 | 167.49 | 0.29 | 6.29 | 26.33 | 18.52 | |||
| 2015 | 120.39 | 29.25 | 116.62 | 166.73 | 0.30 | 6.11 | 20.74 | 24.44 | |||
| 2019 | 120.44 | 29.38 | 121.48 | 166.23 | 0.27 | 6.34 | 26.24 | 14.98 | |||
| 2022 | 120.38 | 29.34 | 112.33 | 165.54 | 0.32 | 5.84 | 8.74 | 7.35 | |||
表3 区域绿色金融发展水平的影响因素指标及说明Tab.3 Indicators and explanation of factors influencing the regional green finance development level |
| 变量 | 指标 | 测算方法与说明 |
|---|---|---|
| 科技创新水平(TEC) | 万元GDP的创新产出 | |
| 存款水平(SAV) | 万元GDP的存款 | |
| 经济发展水平(ECO) | 夜间灯光数据 | 夜间灯光密度 |
| 环境污染(ENV) | 碳排放量 | CO2排放量 |
| 产业结构升级(IND) | 产业结构升级指数 | F+2·S+3·T,其中F、S、T分别为一、二、三产增加值 |
| 能耗水平(EFF) | 万元GDP的能耗 | 煤炭消耗量/GDP |
表4 浙江省县域绿色金融发展水平的影响因素分析结果Tab.4 Analysis results of influencing factors on the green finance development level in counties of Zhejiang Province |
| 变量 | (1) SDM | (2) SAR | (3) SEM | (4) OLS |
|---|---|---|---|---|
| TEC | 0.14***(0.04) | 0.29***(0.04) | 0.25***(0.04) | 0.29***(0.05) |
| SAV | 0.01***(0.00) | 0.00(0.00) | 0.01**(0.00) | 0.01***(0.00) |
| ECO | -0.00***(0.00) | -0.00***(0.00) | -0.00***(0.00) | -0.00***(0.00) |
| ENV | 0.00***(0.00) | 0.00***(0.00) | 0.00***(0.00) | 0.00***(0.00) |
| IND | 0.04***(0.01) | 0.02***(0.01) | 0.03***(0.01) | 0.03**(0.01) |
| EFF | -0.23***(0.04) | -0.38***(0.04) | -0.34***(0.04) | -0.65***(0.05) |
| rho | 0.52***(0.03) | 0.46***(0.03) | - | - |
| sigma2_e | 0.00***(0.00) | 0.00***(0.00) | 0.00***(0.00) | - |
| lambda | - | - | 0.56***(0.03) | - |
注:***、**、*分别表示通过1%、5%和10%水平的显著性检验;括号内数值为标准误。表5同。 |
表5 各变量影响绿色金融发展的总效应及效应分解Tab.5 The total effect and effect decomposition of each variable on the development of green finance |
| 变量 | (1) | (2) | (3) |
|---|---|---|---|
| 直接效应 | 间接效应 | 总效应 | |
| TEC | 0.18***(0.05) | 0.51***(0.16) | 0.69***(0.18) |
| SAV | 0.01**(0.00) | -0.04***(0.01) | -0.03***(0.01) |
| ECO | -0.00***(0.00) | 0.00***(0.00) | 0.00(0.00) |
| ENV | 0.00***(0.00) | -0.01***(0.00) | -0.00(0.00) |
| IND | 0.04***(0.01) | 0.02**(0.01) | 0.06***(0.02) |
| EFF | -0.28***(0.04) | -0.69***(0.14) | -0.97***(0.15) |
表6 浙江省县域绿色金融发展水平仿真预测结果Tab.6 Simulation and prediction results of green finance development level in counties of Zhejiang Province |
| 路径 | 稳定现状型 | 经济发展型 | 金融发展型 | 科技发展型 | 环境保护发展型 | 协同发展型 | |||||||||||
|---|---|---|---|---|---|---|---|---|---|---|---|---|---|---|---|---|---|
| 2030 | 2035 | 2030 | 2035 | 2030 | 2035 | 2030 | 2035 | 2030 | 2035 | 2030 | 2035 | ||||||
| 县域绿色金融水平 | 74.78 | 77.04 | 75.21 | 77.99 | 74.93 | 77.51 | 74.79 | 77.13 | 74.85 | 77.28 | 75.46 | 78.80 | |||||
| 经济发展能力水平 | 141.59 | 148.20 | 142.34 | 149.83 | 141.85 | 149.03 | 141.60 | 148.29 | 141.56 | 148.20 | 142.61 | 150.75 | |||||
| 科技发展水平 | 56.69 | 58.95 | 57.02 | 59.66 | 56.80 | 59.30 | 56.72 | 59.10 | 56.75 | 59.13 | 57.22 | 60.35 | |||||
| 环境保护状况 | 28.32 | 26.29 | 28.56 | 26.83 | 28.40 | 26.57 | 28.32 | 26.32 | 28.49 | 26.84 | 28.83 | 27.68 | |||||
| [1] |
朱建华, 王虹吉, 郑鹏. 贵州省循环经济与绿色金融耦合协调发展研究[J]. 经济地理, 2019, 39(12):119-128.
|
| [2] |
王馨, 王营. 绿色信贷政策增进绿色创新研究[J]. 管理世界, 2021, 37(6):173-188,11.
|
| [3] |
涂强, 李慧哲, 李向前. 绿色金融改革创新试验区提升绿色企业价值研究[J]. 财经理论与实践, 2023, 44(5):12-18.
|
| [4] |
|
| [5] |
吴朝霞, 曾家豪, 刘泓轩, 等. 绿色金融促进治污减排机制与空间效应[J]. 经济地理, 2023, 43(10):128-138.
|
| [6] |
肖仁桥, 肖阳, 钱丽. 绿色金融、绿色技术创新与经济高质量发展[J]. 技术经济, 2023, 42(3):1-13.
|
| [7] |
|
| [8] |
韩叙, 柳潇明, 刘文婷, 等. 黄河流域绿色金融与经济高质量发展耦合协调时空特征及驱动因素[J]. 经济地理, 2023, 43(9):121-130.
|
| [9] |
宁译萱, 钟希余. 长江中游城市群绿色金融与绿色创新效率耦合协调的演变及驱动因素[J]. 经济地理, 2023, 43(12):48-57.
|
| [10] |
陈经伟, 姜能鹏, 李欣. “绿色金融”的基本逻辑、最优边界与取向选择[J]. 改革, 2019(7):119-131.
|
| [11] |
|
| [12] |
|
| [13] |
黄小勇, 陈飞羽, 查育新. 绿色金融与生态产品价值实现——基于全国百强县数据的实证研究[J]. 江西财经大学学报, 2023(6):27-39.
|
| [14] |
|
| [15] |
|
| [16] |
江红莉, 王为东, 王露, 等. 中国绿色金融发展的碳减排效果研究——以绿色信贷与绿色风投为例[J]. 金融论坛, 2020, 25(11):39-48,80.
|
| [17] |
陈国进, 丁赛杰, 赵向琴, 等. 中国绿色金融政策、融资成本与企业绿色转型——基于央行担保品政策视角[J]. 金融研究, 2021(12):75-95.
|
| [18] |
王康仕, 孙旭然, 王凤荣. 绿色金融发展、债务期限结构与绿色企业投资[J]. 金融论坛, 2019, 24(7):9-19.
|
| [19] |
邓淇中, 李纯英. 长江经济带生态环境与绿色金融耦合协调度的时空特征及影响因素[J/OL]. 长江流域资源与环境,1-18[2024-11-25]. http://kns.cnki.net/kcms/detail/42.1320.X.20240531.1820.002.html.
|
| [20] |
|
| [21] |
齐岳, 谢晨瑶, 黄佳宁. 中国地区碳金融发展水平测度及影响因素研究[J]. 中国软科学, 2024(S1):141-154.
|
| [22] |
|
| [23] |
|
| [24] |
陈明华, 刘华军, 孙亚男. 中国五大城市群金融发展的空间差异及分布动态:2003—2013年[J]. 数量经济技术经济研究, 2016, 33(7):130-144.
|
| [25] |
斯丽娟, 曹昊煜. 绿色信贷政策能够改善企业环境社会责任吗——基于外部约束和内部关注的视角[J]. 中国工业经济, 2022(4):137-155.
|
| [26] |
王冬梅, 王学渊, 赵连阁. 绿色金融助推重污染企业减排效应研究[J]. 经济经纬, 2024, 41(4):137-148.
|
| [27] |
徐彩瑶, 王宁, 孔凡斌, 等. 森林生态产品价值实现对县域发展差距的影响:以浙江省山区26县为例[J]. 林业科学, 2023, 59(1):12-30.
|
| [28] |
李戎, 刘璐茜. 绿色金融与企业绿色创新[J]. 武汉大学学报(哲学社会科学版), 2021, 74(6):126-140.
|
| [29] |
孙光林, 王颖, 李庆海. 绿色信贷对商业银行信贷风险的影响[J]. 金融论坛, 2017, 22(10):31-40.
|
| [30] |
李健, 卫平. 民间金融和全要素生产率增长[J]. 南开经济研究, 2015(5):74-91.
|
| [31] |
孔凡斌, 王苓, 徐彩瑶, 等. 大别山区县域自我发展能力时空演变及情景预测[J]. 经济地理, 2023, 43(10):108-118.
|
/
| 〈 |
|
〉 |