
中国减污降碳与扩绿增长耦合协调度的时空特征及其驱动因素
|
尹碧波(1979—),男,博士,教授,博士生导师,研究方向为环境经济。E-mail:yinbibo@126.com |
收稿日期: 2024-03-25
修回日期: 2024-08-30
网络出版日期: 2024-12-18
基金资助
国家社会科学基金一般项目(20BJL112)
湖南省社会科学成果评审委员会重大项目(XSP22ZDA002)
湖南省研究生科研创新重点项目(CX20231123)
Spatio-temporal Characteristics and Driving Factors of the Coupling Coordination Degree Between the Pollution-Carbon Reduction,and the Green Expansion and Economic Growth in China
Received date: 2024-03-25
Revised date: 2024-08-30
Online published: 2024-12-18
尹碧波 , 邝萍 , 欧阳昕彤 , 郑佳琦 . 中国减污降碳与扩绿增长耦合协调度的时空特征及其驱动因素[J]. 经济地理, 2024 , 44(11) : 122 -131 . DOI: 10.15957/j.cnki.jjdl.2024.11.013
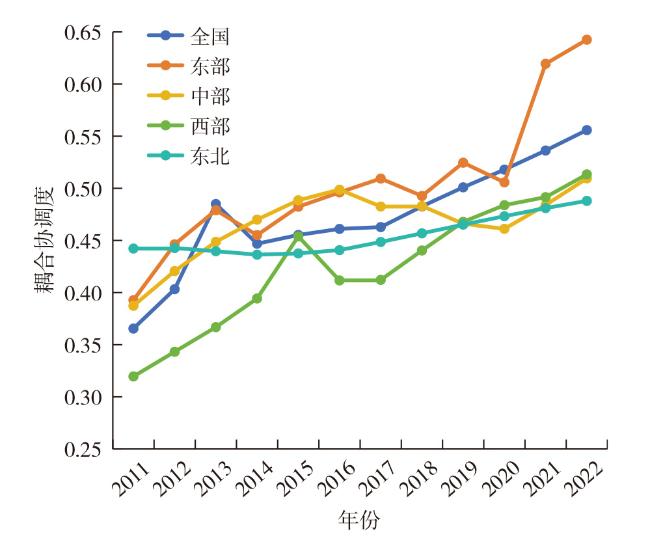
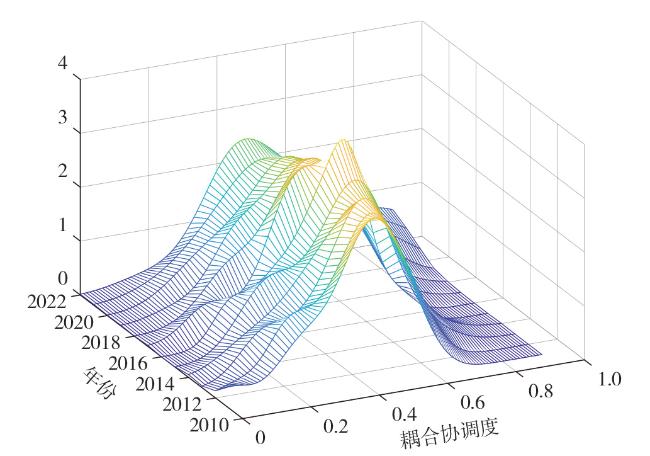
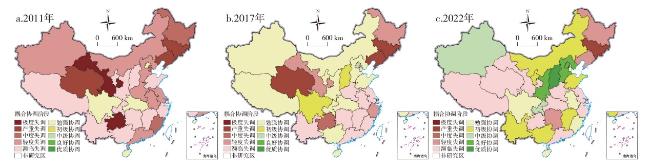
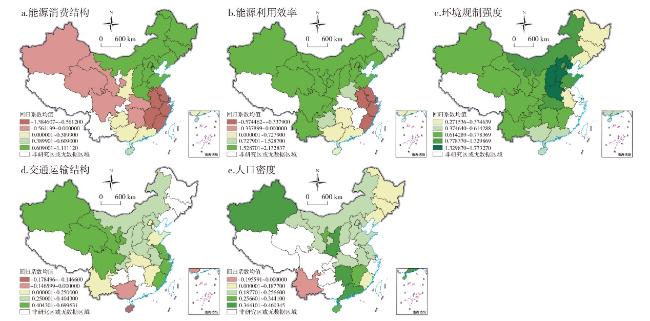
This article constructs the evaluation index systems of the synergy level of pollution-carbon reduction,and the index of green expansion and economic growth. Based on the panel data of 31 provincial-level regions in China from 2011 to 2022,it investigates the spatio-temporal evolution characteristics and driving factors of the coupling coordination degree between the pollution-carbon reduction,and the green expansion and economic growth in China using the methods of game theory combination weighting method,coupling coordination degree model,multi-scale geographical weighted regression model. The research indicates that: 1) From 2011 to 2022, the overall coupling coordination degree between the pollution-carbon reduction,and the green expansion and economic growth showed an upward trend in provincial-level regions of China,rising from the stage of mild imbalance to the stage of barely coordinated. The spatial distribution of coupling coordination degree from high to low is the eastern,central,northeastern,and western regions,with the leading advantage of the eastern region being obvious and gradually expanding. 2) The coupling coordination degree between the pollution-carbon reduction,and the green expansion and economic growth showed the characteristics of spatial solidification and dynamic changes from 2011 to 2022,with a few provinces always at the same stage of coupling coordination and most rising to the stage of barely coordinated and above. 3) Energy consumption structure exerts greater driving effect on the coupling coordination degree in the northeast China and Beijing-Tianjin-Hebei regions,environmental regulation intensity plays a greater driving role in the coupling coordination degree in north China,transportation structure plays a greater role in driving the coupling coordination in the eastern coastal region,population density has a larger driving effect on the coupling coordination in central and southern China,while the positive effect of energy utilization efficiency basically covers all provincial-level samples.
表1 减污降碳协同水平评价指标体系Tab.1 Evaluation indicator system of the synergy level of pollution-carbon reduction |
| 系统层 | 准则层 | 指标含义 | 单位 | 排放当量系数 | 权重 |
|---|---|---|---|---|---|
| 减污 | 大气污染 物排放 | SO2排放量 | 万t | 1/0.95 | 0.5 |
| 氮氧化物排放量 | 万t | 1/0.95 | |||
| 烟(粉)尘排放量 | 万t | 1/2.18 | |||
| 降碳 | 碳排放 | CO2排放量 | 万t | - | 0.5 |
表2 扩绿增长指数评价指标体系及说明Tab.2 Evaluation indicator system for green expansion and economic growth |
| 系统层 | 准则层 | 指标含义 | 层次分析法 | 熵权法 | 博弈论组合赋权法 |
|---|---|---|---|---|---|
| 自然资源管理 | 造林面积 | 造林总面积(千hm2) | 0.0191 | 0.0333 | 0.0297 |
| 生态水比例 | 生态用水总量/用水总量(%) | 0.0191 | 0.0655 | 0.0538 | |
| 活力木蓄积量 | 立木材积总量/有林地总面积(亿m3/hm2) | 0.0191 | 0.0580 | 0.0482 | |
| 自然保护区覆盖率 | 自然保护区面积/行政区域面积(%) | 0.0191 | 0.0343 | 0.0305 | |
| 森林病虫鼠害防治 | 森林病虫鼠害防治率(%) | 0.0191 | 0.0070 | 0.0100 | |
| 地质灾害防治投资 | 地质灾害防治投资总额(万元) | 0.0191 | 0.0922 | 0.0738 | |
| 生态建设与保护投资 | 生态建设与保护本年完成投资总额(万元) | 0.0191 | 0.0305 | 0.0276 | |
| 绿色创新能力 | 绿色发明专利申请数量(个) | 0.0191 | 0.0733 | 0.0597 | |
| 环境质量 | 公园密度 | 公园个数/公园面积(个/km2) | 0.0487 | 0.0168 | 0.0248 |
| 公园绿地率 | 公园绿地面积/公园面积(%) | 0.0487 | 0.0161 | 0.0243 | |
| 森林覆盖率 | 森林面积/行政区域面积(%) | 0.0487 | 0.0227 | 0.0292 | |
| 植被健康状况 | 归一化植被指数 | 0.0487 | 0.0084 | 0.0185 | |
| 建成区绿地率 | 建成区绿地面积/建成区面积(%) | 0.0487 | 0.0253 | 0.0312 | |
| 建成区绿化覆盖率 | 绿化面积/建成区面积(%) | 0.0487 | 0.0018 | 0.0136 | |
| 环保投入强度 | 地方财政环保支出/财政一般预算支出(%) | 0.0487 | 0.0134 | 0.0222 | |
| 环境规制强度 | 工业治理完成投资额/第二产业增加值(%) | 0.0487 | 0.0414 | 0.0432 | |
| 经济发展 | 经济发展水平 | 人均GDP(元/人) | 0.0354 | 0.0231 | 0.0262 |
| 经济发展速度 | GDP指数(上年=100) | 0.0354 | 0.0032 | 0.0113 | |
| 通货膨胀水平 | 居民消费价格指数(上年=100) | 0.0354 | 0.0074 | 0.0144 | |
| 居民收入水平 | 居民人均可支配收入(元/人) | 0.0354 | 0.0222 | 0.0255 | |
| 地方财税收入 | 地方财政税收收入(亿元) | 0.0354 | 0.0381 | 0.0374 | |
| 资本形成增速 | 固定资产投资(不含农户)比上年增长(%) | 0.0354 | 0.0015 | 0.0100 | |
| 劳动报酬占比 | 劳动者报酬/GDP(%) | 0.0354 | 0.0099 | 0.0163 | |
| 外商依存程度 | 外商投资企业投资总额/GDP(%) | 0.0354 | 0.1750 | 0.1399 | |
| 劳动力市场状况 | 城镇登记失业率(%) | 0.0354 | 0.0059 | 0.0133 | |
| 研发投入强度 | 规模以上企业R&D经费/GDP(%) | 0.0354 | 0.0256 | 0.0281 | |
| 技术交易活跃度 | 技术市场成交额/GDP(%) | 0.0354 | 0.0822 | 0.0704 | |
| 城乡结构 | 城市化水平 | 城镇化率(%) | 0.0113 | 0.0073 | 0.0083 |
| 产业结构 | 第三产业增加值/第二产业增加值 | 0.0113 | 0.0268 | 0.0229 | |
| 消费需求结构 | 社会消费品零售总额/GDP(%) | 0.0113 | 0.0054 | 0.0069 | |
| 市场化程度 | 地区市场化指数(%) | 0.0113 | 0.0046 | 0.0063 | |
| 城乡消费差距 | 城镇人均消费支出/农村人均消费支出 | 0.0113 | 0.0161 | 0.0149 | |
| 民生性财政支出占比 | 地方财政教育、医疗卫生、住房保障、社会保障和就业支出/财政一般预算支出(%) | 0.0113 | 0.0054 | 0.0069 |
表3 耦合协调度阶段划分及标准Tab.3 Criteria for the division of stages of coupling coordination degree |
| 耦合协调度 | [0,0.1] | (0.1,0.2] | (0.2,0.3] | (0.3,0.4] | (0.4,0.5] | (0.5,0.6] | (0.6,0.7] | (0.7,0.8] | (0.8,0.9] | (0.9,1.0] |
|---|---|---|---|---|---|---|---|---|---|---|
| 耦合协调阶段 | 极度失调 | 严重失调 | 中度失调 | 轻度失调 | 濒临失调 | 勉强协调 | 初级协调 | 中级协调 | 良好协调 | 优质协调 |
表4 耦合协调度驱动因素的模型回归结果Tab.4 Model regression results of factors driving the coupling coordination degree |
| 驱动因素 | OLS模型 | Tobit模型 |
|---|---|---|
| 能源消费结构 | 0.2940***(0.0726) | 0.2970***(0.0723) |
| 能源利用效率 | 0.0539***(0.0107) | 0.0543***(0.0106) |
| 绿色技术创新 | 0.0045(0.0065) | 0.0046(0.0066) |
| 产业聚集程度 | -0.2039(0.2941) | -0.1989(0.2881) |
| 人力资本水平 | 0.1862(0.1630) | 0.1891(0.1606) |
| 政府干预程度 | -0.1366(0.1082) | -0.1359(0.1067) |
| 环境规制强度 | -0.5979***(0.1744) | -0.5997***(0.1704) |
| 交通运输结构 | 0.0050**(0.0022) | 0.0051**(0.0021) |
| 人口密度 | -0.0501***(0.0174) | -0.0503***(0.0171) |
| 控制变量 | YES | YES |
| 样本量 | 300 | 300 |
| R2 | 0.4513 | 0.5636 |
注:*、**、***分别表示通过10%、5%、1%水平的显著性检验,括号里为稳健标准误。 |
| [1] |
庄贵阳, 王思博. 协同推进降碳减污扩绿增长:内涵、挑战及应对[J]. 城市与环境研究, 2023(2):45-55.
|
| [2] |
陈菡, 陈文颖, 何建坤. 实现碳排放达峰和空气质量达标的协同治理路径[J]. 中国人口·资源与环境, 2020, 30(10):12-18.
|
| [3] |
毛显强, 邢有凯, 高玉冰, 等. 温室气体与大气污染物协同控制效应评估与规划[J]. 中国环境科学, 2021, 41(7):3390-3398.
|
| [4] |
|
| [5] |
邢有凯, 刘峥延, 毛显强, 等. 中国交通行业实施环境经济政策的协同控制效应研究[J]. 气候变化研究进展, 2021, 17(4):379-387.
|
| [6] |
李新, 路路, 穆献中, 等. 京津冀地区钢铁行业协同减排成本—效益分析[J]. 环境科学研究, 2020, 33(9):2226-2234.
|
| [7] |
|
| [8] |
|
| [9] |
|
| [10] |
|
| [11] |
|
| [12] |
田嘉莉, 付书科, 刘萧玮. 财政支出政策能实现减污降碳协同效应吗?[J]. 财政科学, 2022, 74(2):100-115.
|
| [13] |
唐湘博, 张野, 曹利珍, 等. 中国减污降碳协同效应的时空特征及其影响机制分析[J]. 环境科学研究, 2022, 35(10):2252-2263.
|
| [14] |
原伟鹏, 孙慧, 王晶, 等. 中国城市减污降碳协同的时空演化及驱动力探析[J]. 经济地理, 2022, 42(10):72-82.
|
| [15] |
黄占兵, 苏和, 祁婧. 协同推进降碳、减污、扩绿、增长,书写新时代内蒙古高质量发展新篇章——贯彻落实习近平总书记参加十三届全国人大五次会议内蒙古代表团审议时重要讲话精神第72期发展改革论坛综述[J]. 北方经济, 2022(3):35-37.
|
| [16] |
杨峰. 科学把握降碳减污扩绿增长新要求[J]. 群众, 2023, 699(5):65-66.
|
| [17] |
魏丽莉, 侯宇琦. 数字经济对中国城市绿色发展的影响作用研究[J]. 数量经济技术经济研究, 2022, 39(8):60-79.
|
| [18] |
张可云, 张江. 城市群多中心性与绿色发展效率——基于异质性的城镇化空间布局分析[J]. 中国人口·资源与环境, 2022, 32(2):107-117.
|
| [19] |
徐晓光, 樊华, 苏应生, 等. 中国绿色经济发展水平测度及其影响因素研究[J]. 数量经济技术经济研究, 2021, 38(7):65-82.
|
| [20] |
刘珊珊, 吴文婕, 王志强. 基于DPSIR-TOPSIS模型的乌鲁木齐市绿色发展水平测度及其影响因素[J]. 地球科学与环境学报, 2023, 45(4):857-868.
|
| [21] |
张旖琳, 吴相利. 国家重点生态功能区城市与毗邻非生态功能区城市绿色发展水平测度与时空差异[J]. 生态学报, 2022, 42(14):5761-5777.
|
| [22] |
赵英民. 以减污降碳协同增效促进绿色低碳高质量发展[J]. 中国党政干部论坛, 2022(10):53-55.
|
| [23] |
马军旗, 乐章. 黄河流域生态补偿的水环境治理效应——基于双重差分方法的检验[J]. 资源科学, 2021, 43(11):2277-2288.
|
| [24] |
吴凤平, 邵志颖, 季英雯. 新安江流域横向生态补偿政策的减排和绿色发展效应研究[J]. 软科学, 2022, 36(9):65-71.
|
| [25] |
扩大内需战略研究课题组,史丹. 论高质量供给引领和创造新需求[J]. 经济学动态, 2023(11):3-19.
|
| [26] |
李繁荣, 郭丕斌, 齐晓燕. 以能源生产和消费革命推进绿色发展——基于马克思人与自然物质变换思想的研究[J]. 经济问题, 2018(10):8-16.
|
| [27] |
韩叙, 柳潇明, 刘文婷, 等. 黄河流域绿色金融与经济高质量发展耦合协调时空特征及驱动因素[J]. 经济地理, 2023, 43(9):121-130.
|
| [28] |
王淑佳, 孔伟, 任亮, 等. 国内耦合协调度模型的误区及修正[J]. 自然资源学报, 2021, 36(3):793-810.
|
| [29] |
沈体雁, 于瀚辰, 周麟, 等. 北京市二手住宅价格影响机制——基于多尺度地理加权回归模型(MGWR)的研究[J]. 经济地理, 2020, 40(3):75-83.
|
| [30] |
陈晓红, 张嘉敏, 唐湘博. 中国工业减污降碳协同效应及其影响机制[J]. 资源科学, 2022, 44(12):2387-2398.
|
| [31] |
丁学谦, 吴群, 刘向南, 等. 土地利用、经济高质量发展与碳排放耦合协调度及影响因素——来自中国282个地级市的经验研究[J]. 资源科学, 2022, 44(11):2233-2246.
|
/
| 〈 |
|
〉 |