
海运服务贸易网络结构演变与各国角色识别
|
李焱(1977—),女,博士,教授,研究方向为国际贸易。E-mail:lilyyan@dlmu.edu.cn |
收稿日期: 2022-12-12
修回日期: 2024-07-10
网络出版日期: 2024-12-18
基金资助
国家社会科学基金研究专项课题(23VHQ001)
Evolution of the Network Structure of Maritime Service Trade and National Role Identification
Received date: 2022-12-12
Revised date: 2024-07-10
Online published: 2024-12-18
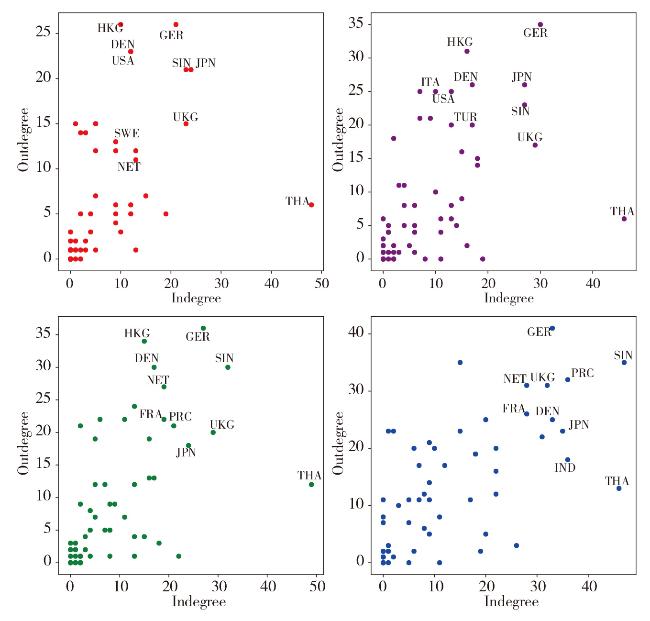
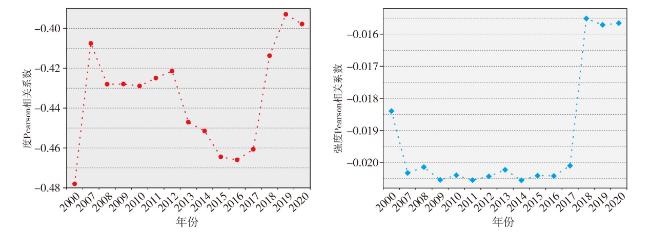
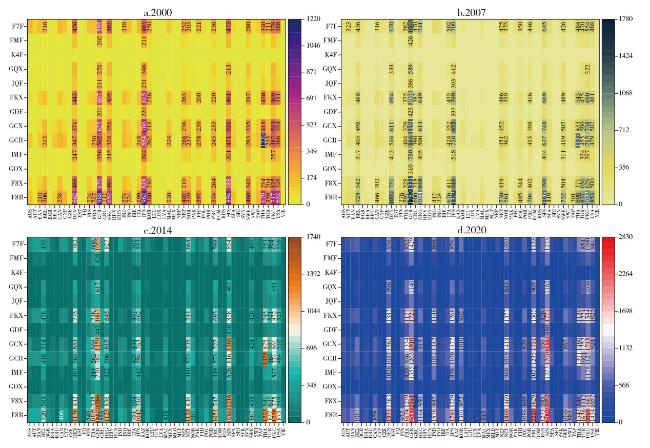
海运服务是实现贸易流通和经济全球化的纽带,准确辨析世界各国在海运服务贸易中的实际地位,对促进贸易良性循环和海运业稳定发展,量化识别海运服务贸易的格局及特征具有现实意义。文章利用社会网络方法,探究了全球海运服务贸易网络的拓扑特征和演化规律。研究发现:①从网络结构特征演变看,样本期内网络密度由0.143增长到0.241,海运服务贸易网络趋于复杂化稠密化,具有核心边缘层级结构、小世界性和极化特征,而无标度性不明显;度和强度的Pearson相关系数分别在-0.4780~-0.3930及-0.0206~-0.0155之间,海运服务贸易网络是典型异配网络;GCX、F8X、FKX 3种模体在各年出现频次均较高,出口结构和互惠结构是海运服务贸易的重要模式,高度集中化贸易模式则并不突出。②从各国网络地位和承担角色看,美国、德国、日本等核心国家在网络中具有绝对引领作用,南亚为贸易低值集聚区,空间上呈现以欧洲、亚洲、北美为主导的格局;中国、印度的节点度中心性逐渐提高,新兴经济体网络地位明显增强;新加坡是海运服务贸易枢纽中心,德国和美国是海运服务贸易的重要输出国,日本、英国和泰国倾向于承担进口发起国角色,中国作为核心国和中间节点起着重要的传输作用。
李焱 , 梁雪涵 , 黄庆波 . 海运服务贸易网络结构演变与各国角色识别[J]. 经济地理, 2024 , 44(11) : 13 -23 . DOI: 10.15957/j.cnki.jjdl.2024.11.002
Maritime service is the link to realize trade circulation and economic globalization. Distinguishing the actual status of maritime service trade in various countries is of practical significance to promote the virtuous cycle of trade and the stable development of shipping industry,and quantitatively identify the pattern and characteristics of maritime service trade. Therefore,this article uses the social network method to explore the topological characteristics and evolutionary laws of the global maritime service trade network. The results show that: 1) In terms of the evolution of network structure characteristics,the network density increases from 0.143 to 0.241 during the sample period,and the network of maritime trade services tends to be complicated and dense,with the characteristics of core edge hierarchy,small world and polarization,while scale-free is not obvious. The Pearson correlation coefficients of node degree and strength degree are -0.4780~-0.3930 and -0.0206~-0.0155,respectively. The trade network of maritime service is a typical heterogeneous network. The frequency of appearance of GCX,F8X,and FKX motifs is relatively high in each year,export structure and reciprocal structure are the important modes of maritime service trade,while highly centralized trade mode is not prominent. 2) From the perspective of each country's network status and role,core countries such as the United States,Germany and Japan play an absolute leading role in the network,South Asia is a low-value trade agglomeration area,it shows a spatial pattern dominated by Europe,Asia and North America. The node degree centrality of China and India is gradually improved,and the network status of emerging economies is obviously enhanced. Singapore is the hub of maritime service trade,Germany and the United States are major exporters of maritime service trade,Japan,the United Kingdom and Thailand tend to assume the role of import initiator,and China as the core country and intermediate node plays an important role in transmission.
表1 网络测度指标含义及公式Tab.1 Meaning and formula of network measurement indicators |
| 指标 | 公式 | 含义 |
|---|---|---|
| 网络密度 | 衡量网络图的完备性。式中L代表贸易关系数,n代表网络中的国家和地区数量[32] | |
| 平均度 | 量化网络整体的连通性和贸易联系的广度。式中 表示国家i的度数[33] | |
| 平均路径长度 | 反映网络整体的可达性和贸易传输效率。式中 表示任意两个存在贸易关系的经济体之间的最短路径长度[32] | |
| 平均聚类系数 | 衡量贸易网络的集聚程度。式中 表示国家i的 个相邻节点间连边的数量[32] | |
| 出度中心性 | 表示节点发出的贸易关系数[32] | |
| 入度中心性 | 表示节点接收的贸易关系数[32] | |
| 节点强度 | 节点i的强度为与其相连的所有经济体间的边权总量。 是节点出强度, 是节点入强度[32] | |
| 累积强度分布 | 指贸易网络中节点强度不小于S的经济体所占的比例,用 表示网络中节点强度为S的节点个数,则节点强度分布为 。 表示累积节点强度分布不小于某点处的节点强度 的部分, 指节点强度的最大值[34] | |
| 度的Pearson 相关系数 | 反映节点间度相关性。式中E为贸易网络中所有m条边组成的集合, 、 是边 两端点i、j的节点度[35] | |
| 强度的Pearson 相关系数 | 反映节点间强度相关性。式中 、 分别是边 两端点i、j的节点强度[35] |
表2 海运服务贸易联系对前五强(单位:百万美元)Tab.2 Top five maritime service trade linkages (Unit:Million USD) |
| 年份 | 出口国 | 进口国 | 权重 |
|---|---|---|---|
| 2000 | 美国 | 日本 | 2014.9040 |
| 德国 | 土耳其 | 967.5678 | |
| 日本 | 泰国 | 919.5069 | |
| 德国 | 日本 | 731.1854 | |
| 丹麦 | 日本 | 688.2161 | |
| 2007 | 挪威 | 英国 | 2674.7920 |
| 日本 | 泰国 | 2454.4510 | |
| 中国 | 日本 | 2057.2740 | |
| 挪威 | 日本 | 1653.1450 | |
| 日本 | 新加坡 | 1607.2490 | |
| 2014 | 日本 | 新加坡 | 3986.4610 |
| 中国 | 新加坡 | 2212.8550 | |
| 美国 | 日本 | 1832.0280 | |
| 美国 | 新加坡 | 1713.5760 | |
| 日本 | 泰国 | 1609.9100 | |
| 2020 | 新加坡 | 泰国 | 5212.2120 |
| 中国 | 新加坡 | 2617.1170 | |
| 日本 | 新加坡 | 2435.3650 | |
| 美国 | 日本 | 2358.4720 | |
| 日本 | 泰国 | 2347.2150 |
表3 海运服务贸易网络整体性拓扑特征Tab.3 Overall topological characteristics of maritime service trade network |
| 年份 | 边数 | 密度 | 平均度 | 平均 路径 长度 | 平均 聚类 系数 | 平均 路径长度 (随机网络) | 平均 聚类系数 (随机网络) |
|---|---|---|---|---|---|---|---|
| 2000 | 380 | 0.143 | 14.615 | 2.321 | 0.375 | 2.178 | 0.135 |
| 2007 | 522 | 0.182 | 19.333 | 2.050 | 0.398 | 1.950 | 0.176 |
| 2008 | 566 | 0.184 | 20.214 | 2.213 | 0.415 | 1.941 | 0.181 |
| 2009 | 533 | 0.167 | 18.702 | 2.193 | 0.398 | 2.020 | 0.159 |
| 2010 | 563 | 0.183 | 20.107 | 2.069 | 0.407 | 1.935 | 0.180 |
| 2011 | 582 | 0.182 | 20.421 | 2.036 | 0.425 | 1.946 | 0.185 |
| 2012 | 569 | 0.185 | 20.321 | 2.065 | 0.419 | 1.945 | 0.183 |
| 2013 | 551 | 0.173 | 19.333 | 2.072 | 0.408 | 1.979 | 0.166 |
| 2014 | 549 | 0.172 | 19.263 | 2.058 | 0.410 | 1.998 | 0.169 |
| 2015 | 525 | 0.159 | 18.103 | 2.083 | 0.389 | 2.054 | 0.166 |
| 2016 | 522 | 0.158 | 18.000 | 2.056 | 0.386 | 2.036 | 0.158 |
| 2017 | 550 | 0.166 | 18.966 | 2.023 | 0.393 | 2.001 | 0.159 |
| 2018 | 743 | 0.260 | 27.519 | 1.776 | 0.486 | 1.760 | 0.257 |
| 2019 | 849 | 0.276 | 30.321 | 1.814 | 0.505 | 1.734 | 0.270 |
| 2020 | 768 | 0.241 | 26.947 | 1.825 | 0.490 | 1.793 | 0.241 |
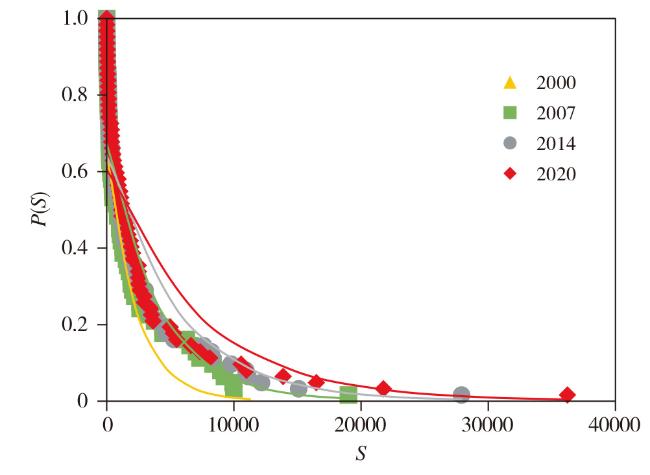
图3 海运服务贸易网络累积强度分布Fig.3 Cumulative strength distribution of maritime service trade network |
表4 海运服务贸易网络累积强度分布的拟合函数Tab.4 Fitting function of cumulative strength distribution of maritime service trade network |
| 年份 | 拟合函数 | |||
|---|---|---|---|---|
| 幂函数 | 指数函数 | |||
| 2000 | y=2.1526x-0.321 | R²=0.7226 | y=0.6443e-4E-04x | R²=0.9038 |
| 2007 | y=2.1192x-0.279 | R²=0.6140 | y=0.6716e-2E-04x | R²=0.9202 |
| 2014 | y=2.4052x-0.286 | R²=0.6106 | y=0.6408e-2E-04x | R²=0.8828 |
| 2020 | y=3.4398x-0.332 | R²=0.6737 | y=0.6046e-1E-04x | R²=0.8304 |
表5 海运服务贸易网络模体类型及说明Tab.5 Types and explanation of maritime service trade network motif |
| 代码 | 模体 | 含义说明 |
|---|---|---|
| F8R |  | A国仅作为海运服务贸易的中转站,将从B国进口的海运服务出口至C国 |
| F8X |  | A国从B国进口海运服务,同时海运服务可由A国出口至B、C两国 |
| GOX |  | A、B、C三国均为海运服务贸易中转站 |
| IMF |  | A、B两国之间存在双边海运服务贸易,C国作为中转站将从A国进口的海运服务出口至B国 |
| GCR |  | A国仅作为海运服务贸易进口国 |
| GCX |  | 海运服务由A国出口至B国,同时A国可从B、C两国进口海运服务 |
| GDF |  | A国与B国、A国与C国之间分别存在双边海运服务贸易 |
| FKX |  | 海运服务可由A国出口至B、C两国,B国作为中转站将从A国进口的海运服务出口至C国 |
| JQF |  | A、B两国之间存在双边海运服务贸易,同时海运服务可由C国出口至A、B两国 |
| GQX |  | A国与B国、A国与C国之间存在双边海运服务贸易,同时B国可将海运服务出口至C国 |
| K4F |  | A、B、C三国中,任意两国之间均存在双边海运服务贸易 |
| FMF |  | A、B两国之间存在双边海运服务贸易,同时海运服务可由A、B两国出口至C国 |
| F7F |  | A国仅作为海运服务贸易出口国 |
表6 海运服务贸易网络模体演化Tab.6 Evolution of maritime service trade network motif |
| 代码 | 2000年 | 2007年 | 2014年 | 2020年 | |||||||
|---|---|---|---|---|---|---|---|---|---|---|---|
| 频次 | Z得分 | 频次 | Z得分 | 频次 | Z得分 | 频次 | Z得分 | ||||
| F8R | 4242 | -2.219 | 7221 | -3.824 | 8215 | -4.516 | 14984 | -6.844 | |||
| F8X | 2409*** | 1.743 | 4571*** | 3.306 | 5271*** | 4.142 | 10116*** | 6.066 | |||
| GOX | 524 | 1.065 | 938*** | 1.867 | 1130*** | 1.723 | 2378 | 0.357 | |||
| IMF | 1109*** | 2.067 | 2105*** | 3.591 | 2575*** | 3.48 | 5906*** | 4.214 | |||
| GCR | 3239 | 0 | 4640 | 0 | 5055 | 0 | 9493 | 0 | |||
| GCX | 2461*** | 1.895 | 4196*** | 3.509 | 4933*** | 3.494 | 11045*** | 5.164 | |||
| GDF | 650*** | 1.623 | 1269*** | 3.432 | 1515*** | 3.957 | 3635*** | 5.484 | |||
| FKX | 2335*** | 2.214 | 4032*** | 3.772 | 4578*** | 4.263 | 9396*** | 7.862 | |||
| JQF | 671*** | 2.311 | 1196*** | 4.32 | 1435*** | 3.471 | 3478*** | 5.051 | |||
| GQX | 761*** | 2.251 | 1527*** | 3.833 | 1921*** | 3.514 | 4794*** | 5.263 | |||
| K4F | 88*** | 2.211 | 178*** | 3.372 | 237*** | 3.001 | 633*** | 4.856 | |||
| FMF | 670*** | 2.405 | 1317*** | 3.606 | 1524*** | 3.605 | 3322*** | 7.552 | |||
| F7F | 2664 | 0 | 4765 | 0 | 5157 | 0 | 8038 | 0 | |||
注:***表示p=0。 |
| [1] |
郭建科, 郭姝, 秦娅风, 等. 中非集装箱航运网络演化及其对经贸联系的支撑能力[J]. 资源科学, 2020, 42(11):2145-2157.
|
| [2] |
王有鑫, 孙可昕. 中国关键产品进口依赖度与潜在化解能力评估[J]. 国际贸易, 2023(1):40-48.
|
| [3] |
邱志萍, 秦淑悦. 全球海运连通性的贸易效应及作用机制研究——来自联合国LSBCI数据的经验证据[J]. 国际经贸探索, 2022, 38(3):4-17.
|
| [4] |
王婧祎. WTO国际海运服务贸易与我国海运业开放[J]. 上海经济研究, 2008(11):107-113.
|
| [5] |
李晨, 迟萍, 邵桂兰. 基于动态面板GMM的海运服务贸易开放度与竞争力关系的实证研究[J]. 国际商务研究, 2015, 36(4):88-96.
|
| [6] |
李晨, 张琦. 我国海运服务贸易国际竞争力研究[J]. 中国海洋大学学报(社会科学版), 2013(4):26-30.
|
| [7] |
佟家栋, 李胜旗. 海运企业、船队结构与发展我国海运服务贸易[J]. 经济问题探索, 2014(5):177-183.
|
| [8] |
彭徽. 中国海运服务贸易竞争力国际比较及其影响因素[J]. 商业经济研究, 2015(13):22-23.
|
| [9] |
邱志萍, 廖秋敏. 海运连通性与中国国际贸易增长——基于联合国LSBCI数据的分析[J]. 地域研究与开发, 2022, 41(1):1-5,12.
|
| [10] |
|
| [11] |
王永进, 杨璐. 港口拥堵、内生贸易成本与中国对外贸易利益[J]. 世界经济, 2023, 46(9):52-81.
|
| [12] |
|
| [13] |
|
| [14] |
|
| [15] |
|
| [16] |
张广海, 袁洪英. 中国城市旅游信息流空间网络格局及其复杂性[J]. 经济地理, 2023, 43(1):197-205.
|
| [17] |
王志如, 张满银. 北京地铁网络时空演化特征评估及演化机制[J]. 经济地理, 2021, 41(4):48-56.
|
| [18] |
袁红林, 辛娜. 中国高端制造业的全球贸易网络格局及其影响因素分析[J]. 经济地理, 2019, 39(6):108-117.
|
| [19] |
王玲, 刘维林, 陈华倩, 等. 交通强国战略下我国运输服务贸易的网络地位评估与提升策略——基于全球价值链视角[J]. 软科学, 2021, 35(3):15-21.
|
| [20] |
|
| [21] |
|
| [22] |
|
| [23] |
|
| [24] |
|
| [25] |
|
| [26] |
梅强, 胡勤友, 刘希亮, 等. 全球LNG海上运输网络演化及中国贸易现状分析[J]. 地球信息科学学报, 2022, 24(9):1701-1716.
|
| [27] |
李振福, 李亚军, 孙建平. 北极航道海运网络的国家权益格局复杂特征研究[J]. 极地研究, 2011, 23(2):122-127.
|
| [28] |
彭澎, 程诗奋, 陈闪闪, 等. 全球液化石油气运输网络贸易社区特征及其演化分析[J]. 自然资源学报, 2020, 35(11):2687-2695.
|
| [29] |
丁浩, 杨洁, 王家明. “一带一路”视角下进口中东石油海上运输脆性风险研究[J]. 统计与信息论坛, 2018, 33(7):107-115.
|
| [30] |
王诺, 闫冰, 吴迪, 等. 北极通航背景下中欧海运航线的时空格局[J]. 经济地理, 2017, 37(12):9-16.
|
| [31] |
姚星, 梅鹤轩, 蒲岳. 国际服务贸易网络的结构特征及演化研究——基于全球价值链视角[J]. 国际贸易问题, 2019(4): 109-124.
|
| [32] |
汪小帆, 李翔, 陈关荣. 网络科学导论[M]. 北京: 高等教育出版社, 2012.
|
| [33] |
任忠宝, 陈甲斌, 邢万里. 基于复杂网络视角的全球铀矿产品贸易特征分析[J]. 中国矿业, 2020, 29(9):9-15.
|
| [34] |
王祥, 牛叔文, 强文丽, 等. 实物量与价值量加权的全球农产品贸易网络分析[J]. 经济地理, 2019, 39(4):164-173.
|
| [35] |
郑军, 张永庆, 黄霞. 2000—2014年海上丝绸之路贸易网络结构特征演化[J]. 国际贸易问题, 2017(3):154-165.
|
| [36] |
缪莉莉, 韩传峰, 刘亮, 等. 基于模体的科学家合作网络基元特征分析[J]. 科学学研究, 2012, 30(10):1468-1475.
|
| [37] |
丛海彬, 邹德玲, 高博, 等. “一带一路”沿线国家新能源汽车贸易网络格局及其影响因素[J]. 经济地理, 2021, 41(7):109-118.
|
| [38] |
侯纯光, 杜德斌, 刘承良, 等. 全球人才流动网络复杂性的时空演化——基于全球高校留学生流动数据[J]. 地理研究, 2019, 38(8):1862-1876.
|
/
| 〈 |
|
〉 |
