
基于绿通大数据的中国鲜活农产品运输流格局及其演变机制
|
宋京妮(1990—),女,博士研究生,讲师,研究方向为交通运输大数据分析。E-mail:sjn@chd.edu.cn |
收稿日期: 2024-04-11
修回日期: 2024-09-04
网络出版日期: 2024-11-29
基金资助
国家自然科学基金项目(71871027)
陕西省社会科学基金项目(2020D028)
中央高校基础研究基金项目(300102341104)
陕西省自然科学基金项目(2022JM-426)
Pattern and Evolution Mechanism of Fresh Agricultural Products Transportation Flows in China Based on the Green Traffic Big Data
Received date: 2024-04-11
Revised date: 2024-09-04
Online published: 2024-11-29
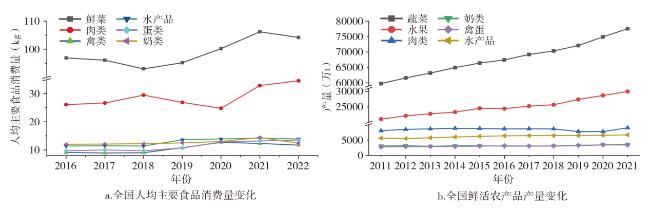
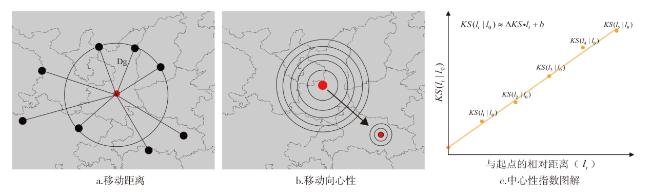
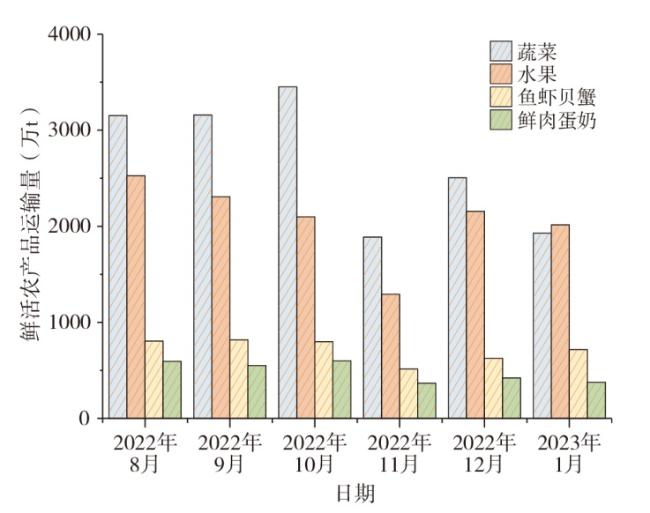
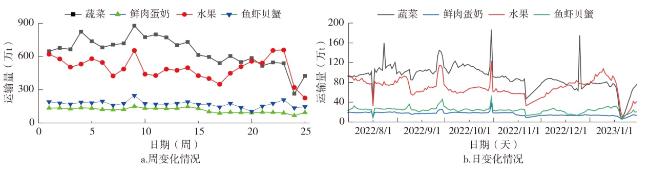
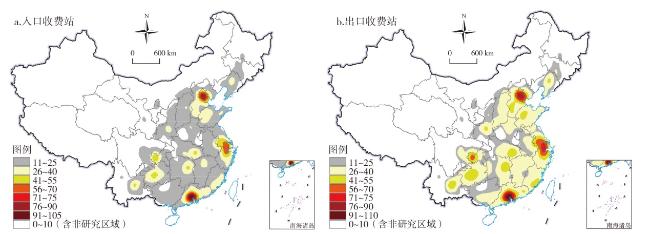
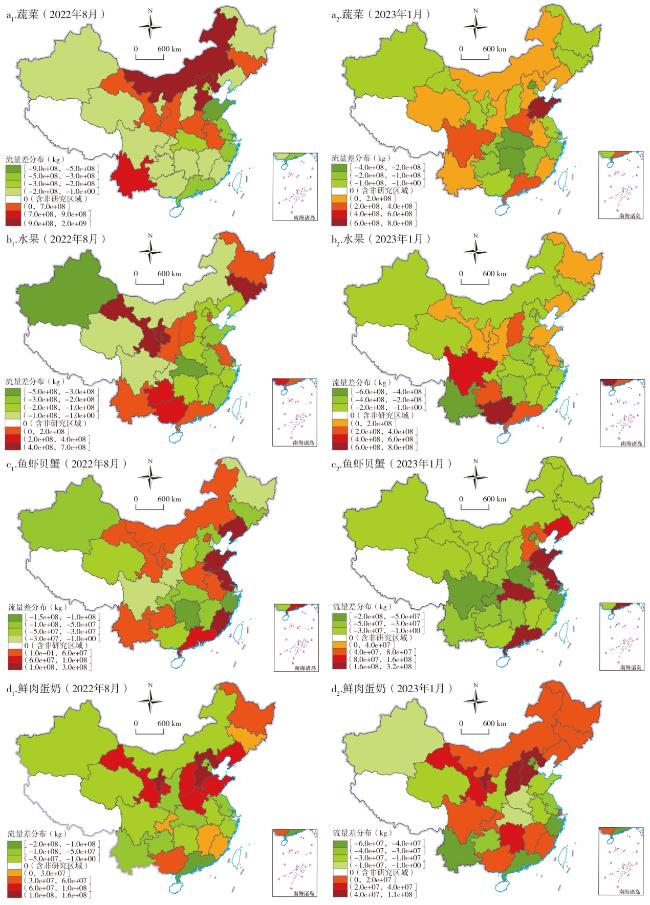
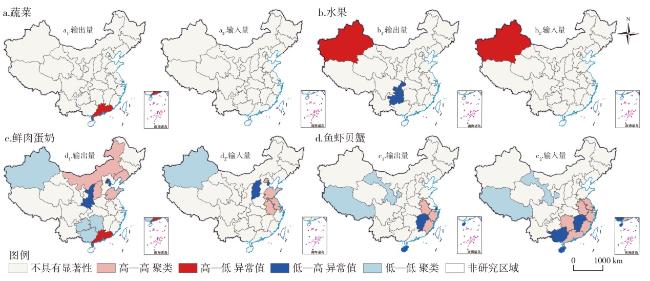
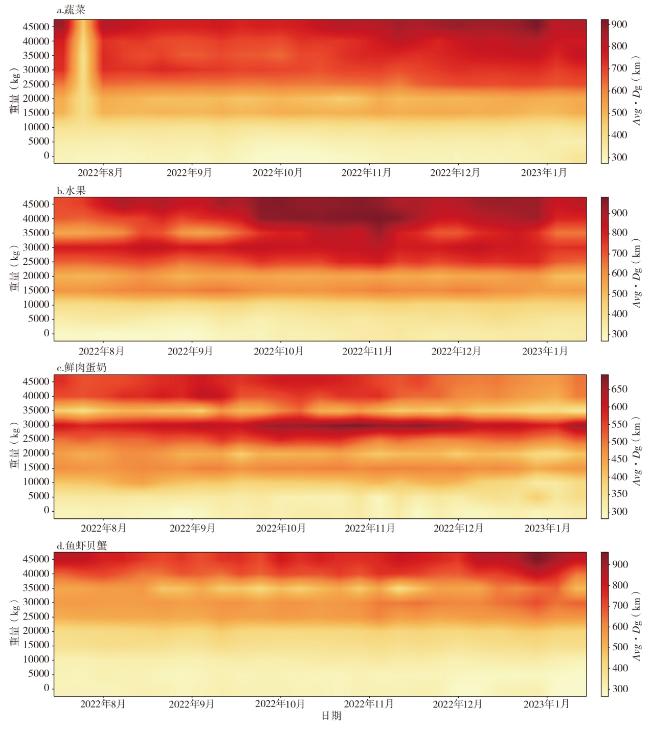
文章利用2022年8月—2023年1月全国绿通车数据,分析了鲜活农产品的时空运输模式;同时,通过GIS技术和统计分析,揭示了运输量的区域差异、集聚现象及其成因,并探讨了运输距离与载重、货物类型与运输向心性的关系。研究发现:①8—10月的蔬菜及水果运输量较高,11月—次年1月减少,鲜肉蛋奶运输量保持稳定,鱼虾贝蟹在1月运输量略低。②蔬菜、水果、鲜肉蛋奶未呈现聚集模式,而鱼虾贝蟹则表现出显著的空间相关性。③运输重量与平均运输距离呈正相关关系,运输流的演变主要受季节更替、产销区域扩张及城市群集聚效应的共同作用。研究结论为优化农产品运输路径、提升运输效率与质量提供了科学依据,同时也为政府制定针对性政策以促进农产品流通、保障生产与消费平衡提供了重要参考。
宋京妮 , 侯文婷 , 李友良 , 颜飞 , 陈丹 , 杜凯 . 基于绿通大数据的中国鲜活农产品运输流格局及其演变机制[J]. 经济地理, 2024 , 44(10) : 126 -135 . DOI: 10.15957/j.cnki.jjdl.2024.10.013
Based on the green traffic data from August 2022 to January 2023,this study analyzes the spatiotemporal transportation patterns of fresh agricultural products. Through GIS technology and statistical analysis,it reveals regional differences in transportation volumes, patterns of aggregation, and their causes. Additionally,it discusses the relationships between transportation distance and load,as well as cargo types and transportation centrality. It's found that: 1) The transportation volume of vegetables and fruits was higher from August to October in 2022, and decreased from November 2022 to January 2023. Meanwhile,the transportation volume of fresh meat,eggs,and dairy remains stable. The transportation volume of fish,shellfish,and crustaceans is slightly lower in January 2023. 2) The transportation of vegetables,fruits,and fresh meat, eggs, and dairy do not show an aggregation pattern. However,the transportation of fish,shellfish,and crustaceans exhibit significant spatial correlation. 3) There is a positive correlation between transportation weight and average transportation distance. The evolution of transportation flows is mainly influenced by seasonal changes,the expansion of production and marketing areas,and the agglomeration effects of urban agglomerations. This study provides a scientific basis for optimizing the transportation paths of agricultural products and improving transportation efficiency and quality. It also provides an important reference for the government to formulate targeted policies to promote the circulation of agricultural products and ensure the balance of production and consumption.
表1 绿通车数据示例Tab.1 Example of green vehicle data |
| 数据字段 | 示例 |
|---|---|
| 车牌(全) | 京AV2298_01 |
| 查验时间 | 2022/08/18 0:00 |
| 重量 | 14744 |
| 入口站ID | 1102040102 |
| 出口站ID | 1102040203 |
| 绿通品种 | 新鲜的家禽肉和家畜肉 |
| 入口收费站 | 北京上清站 |
| 出口收费站 | 北京回龙观站 |
| 免收费用 | 800 |
表2 全国四类鲜活农产品总输出量与总输入量的全局莫兰指数Tab.2 Global Moran's index for total output and total input of four categories of fresh agricultural products in China |
| 品类 | Moran's I | Z值 | E(I) | P值 | |
|---|---|---|---|---|---|
| 蔬菜 | 输出量 | -0.0923 | -0.6791 | -0.0333 | 0.4971 |
| 输入量 | -0.0829 | -0.5861 | -0.0333 | 0.5578 | |
| 水果 | 输出量 | -0.1134 | -0.8919 | -0.0333 | 0.3724 |
| 输入量 | -0.2090 | -1.9893 | -0.0333 | 0.0467 | |
| 鲜肉蛋奶 | 输出量 | 0.0800 | 1.6066 | -0.0333 | 0.1081 |
| 输入量 | 0.0804 | 1.2839 | -0.0333 | 0.1992 | |
| 鱼虾贝蟹 | 输出量 | 0.1072 | 3.6687 | -0.0333 | 0.0053 |
| 输入量 | 0.1925 | 2.6625 | -0.0333 | 0.0078 |
| [1] |
|
| [2] |
|
| [3] |
|
| [4] |
|
| [5] |
|
| [6] |
|
| [7] |
王庆晔. 吉林省农产品物流企业时空演变及其影响因素分析[D]. 长春: 吉林农业大学, 2023.
|
| [8] |
|
| [9] |
|
| [10] |
丁晓青. 基于货运GPS数据的产业园区货运特征分析——以厦门为例[J]. 交通与港航, 2020, 7(1):62-68.
|
| [11] |
|
| [12] |
|
| [13] |
|
| [14] |
姚源果, 贺盛瑜. 基于交通大数据的农产品冷链物流配送路径优化研究[J]. 管理评论, 2019, 31(4):240-253.
|
| [15] |
|
| [16] |
任腾, 罗天羽, 李姝萱, 等. 面向冷链物流配送路径优化的知识型蚁群算法[J]. 控制与决策, 2022, 37(3):545-554.
|
| [17] |
高浩然, 张玉林, 张顺顺. 考虑时效性和品质性满意度约束的易腐品冷链物流配送[J]. 控制与决策, 2024, 39(4):1342-1350.
|
| [18] |
|
| [19] |
|
| [20] |
|
| [21] |
|
/
| 〈 |
|
〉 |