
中国市域老年失能照护机构发展及其供需适配性
|
周榕(1992—),女,博士,讲师,研究方向为人口地理学和老年社会保障。E-mail:zhourong9269@hotmail.com |
收稿日期: 2023-08-07
修回日期: 2024-04-26
网络出版日期: 2024-11-29
基金资助
教育部人文社会科学基金青年项目(23YJCZH331)
Development and Supply-demand Adaptation of Elderly Disability Care Institutions in Chinese Cities
Received date: 2023-08-07
Revised date: 2024-04-26
Online published: 2024-11-29
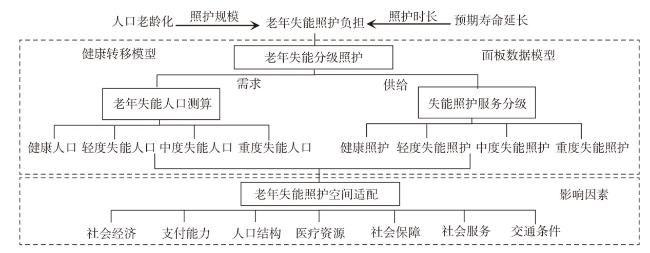
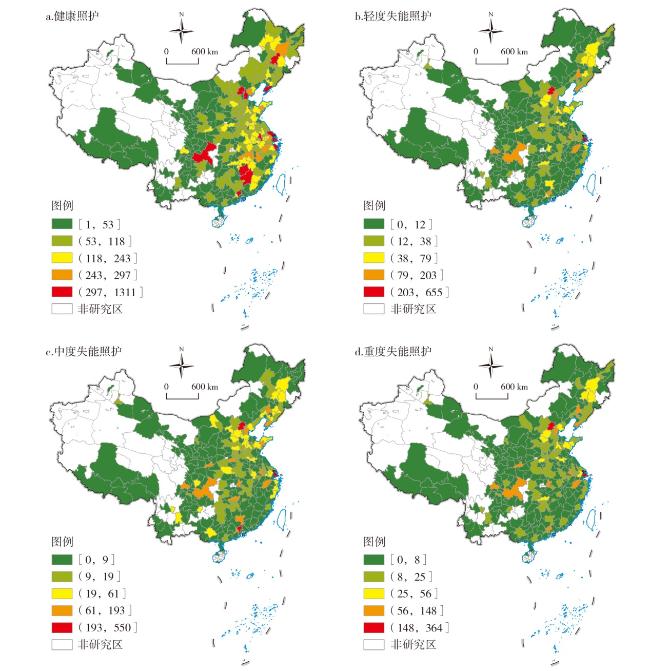
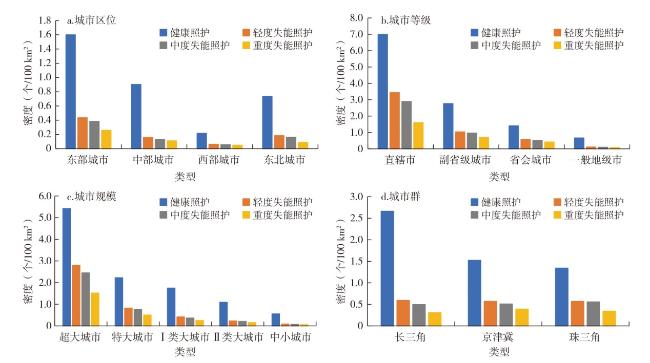
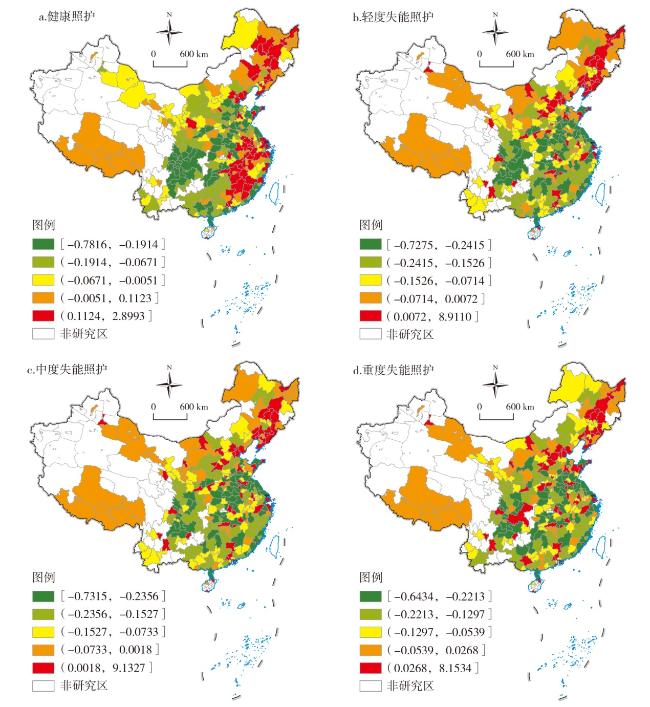
老年失能照护是人口负增长时代的巨大挑战。文章结合多学科研究方法,刻画了老年失能分级照护机构的空间格局及密度差异,并揭示了其供需适配性的形成机制。研究发现:①中国老年失能照护机构数量总体呈现以北京、上海、广州为高值中心的分布格局,且高值区随照护分级的提升而逐渐收缩。②老年失能照护机构密度在不同区位、等级和规模的城市类型中有所差异,东部城市、直辖市和超大城市在所有失能分级下的发展优势均十分突出。③中国老年失能照护机构供需适配水平的空间分化迹象明显,总体表现为“东部繁荣、西部发展、中部塌陷”,且随着照护分级的提高,适配区向东部地区与省会城市集中。④供需适配格局受多种因素的共同影响,社会经济、支付能力和人口结构为空间分异的主导因子,其中人口结构与社会服务、医疗资源与交通条件的因子交互解释力最强。⑤各因素的影响效力存在区域差异,未来中国老年失能照护建设应充分考虑地区失能人口规模及结构特点,提供差别化的资源增补以弥合发展差异、实现社会公平。
周榕 , 石磊 . 中国市域老年失能照护机构发展及其供需适配性[J]. 经济地理, 2024 , 44(10) : 34 -45 . DOI: 10.15957/j.cnki.jjdl.2024.10.004
Elderly disability care represents a significant challenge in the era of negative population growth. This article employs an interdisciplinary research approach to delineate the spatial patterns and density differences of elderly care institutions with different levels of disability,and reveals the mechanisms behind the formation of supply-demand compatibility. It's found that: 1) The number of elderly disability care institutions in China shows the distribution characteristics with Beijing,Shanghai and Guangzhou as the high-value centers,and the high-value areas gradually shrink with the increase of care levels. 2) There are differences in the density of elderly disability care institutions across different locations,grades,and sizes of cities. Eastern cities,municipalities and mega-cities demonstrate prominent development advantages across all disability care levels. 3) The spatial differentiation in the supply-demand adaptation of elderly disability care institutions in China is evident,generally manifesting as "prosperity in the east of China,development in the west of China,and collapse in the middle of China",with higher adaptation zones concentrating in eastern regions and provincial capitals as care levels increase. 4) The supply-demand adaptation pattern is influenced by multiple factors,with socioeconomic status, payment ability,and population structure being the leading factors in spatial differentiation. Among these,the interactions between population structure and social services,medical resources and transportation conditions have the strongest explanatory power. 5) The impact of various factors varies by region. Future development of elderly disability care in China should take into account regional characteristics of the disabled population's scale and structure, providing differentiated resource supplements to bridge development gaps and achieve social equity.
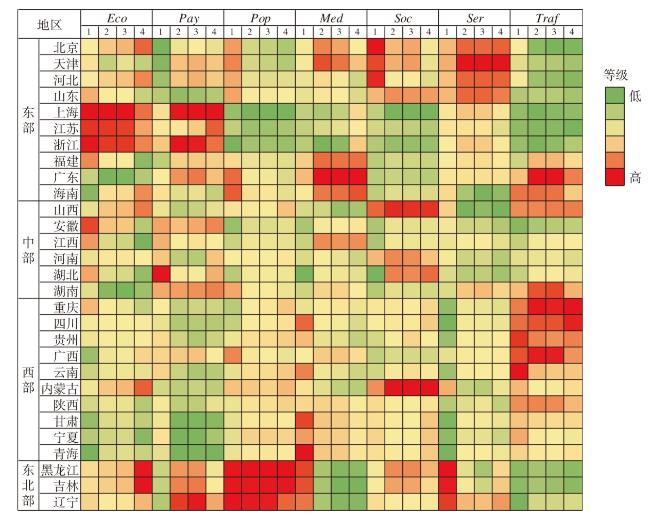
表1 影响因素指标选取及权重Tab.1 Selection and weight of influencing factor index |
| 变量类型 | 具体名称 | 单位 | 权重 |
|---|---|---|---|
| 社会经济 (Eco) | x1人均GDP | 元/人 | 0.351 |
| x2人均地方财政支出 | 元/人 | 0.649 | |
| 支付能力 (Pay) | x3职工平均工资 | 元 | 0.108 |
| x4家庭可支配收入 | 元 | 0.153 | |
| x5人均金融机构存款余额 | 元/人 | 0.492 | |
| x6城乡居民人均储蓄额 | 元/人 | 0.248 | |
| 人口结构 (Pop) | x7人口规模 | 万人 | 0.484 |
| x8城镇化率 | % | 0.301 | |
| x9少儿抚养比 | % | 0.215 | |
| 医疗资源 (Med) | x10每万人执业医生数/助理数 | 人/万人 | 0.289 |
| x11每万人医院、卫生院数 | 家/万人 | 0.434 | |
| x12每万人医院、卫生院床位数 | 张/万人 | 0.277 | |
| 社会保障 (Soc) | x13城镇基本医疗保险参保率 | % | 0.383 |
| x14城镇职工基本养老保险参保率 | % | 0.282 | |
| x15失业保险参保率 | % | 0.335 | |
| 社会服务 (Ser) | x16第三产业从业人员比重 | % | 0.027 |
| x17每万人公共管理和社会组织从业人员数 | 人/万人 | 0.079 | |
| x18每万人卫生、社会保险和社会福利业从业人员数 | 人/万人 | 0.085 | |
| x19每万人居民服务和其他服务业从业人员数 | 人/万人 | 0.447 | |
| x20每万人住宿餐饮业从业人员数 | 人/万人 | 0.362 | |
| 交通条件 (Traf) | x21国道密度 | km/km2 | 0.273 |
| x22铁路网密度 | km/km2 | 0.332 | |
| x23高速公路密度 | km/km2 | 0.395 |
表2 地理探测器与OLS回归结果Tab.2 Results of geographical detector model and OLS |
| 变量 | 模型1(地理探测器) | 模型2(OLS) | |||||||
|---|---|---|---|---|---|---|---|---|---|
| (1) | (2) | (3) | (4) | (5) | (6) | (7) | (8) | ||
| Eco | 0.486*** | 0.854*** | 0.836*** | 0.697*** | 1.514***(0.395) | 5.818***(0.826) | 5.497***(0.817) | 3.741***(0.637) | |
| Pay | 0.297*** | 0.487*** | 0.495*** | 0.516*** | 2.048***(0.525) | 3.037***(1.100) | 3.368***(1.087) | 2.328***(0.849) | |
| Pop | 0.315*** | 0.591*** | 0.588*** | 0.572*** | -0.702**(0.356) | -2.975***(0.745) | -3.125***(0.736) | -2.396***(0.575) | |
| Med | 0.147*** | 0.283*** | 0.294*** | 0.352*** | -0.421(0.298) | 0.935(0.623) | 1.192*(0.616) | 2.034***(0.481) | |
| Soc | 0.193*** | 0.311*** | 0.311*** | 0.251*** | -1.286***(0.377) | -3.545***(0.789) | -3.634***(0.780) | -3.030***(0.609) | |
| Ser | 0.274*** | 0.395*** | 0.385*** | 0.346*** | 0.278(0.280) | 1.670***(0.587) | 1.560***(0.580) | 1.319***(0.453) | |
| Tra | 0.242*** | 0.416*** | 0.415*** | 0.370*** | -0.399(0.386) | -0.020(0.807) | 0.140(0.798) | 0.395(0.623) | |
| R2 | 0.416 | 0.614 | 0.623 | 0.639 | |||||
| Adj.R2 | 0.397 | 0.602 | 0.611 | 0.627 | |||||
注:*、**、***分别表示在10%、5%、1%水平上显著,括号内数值为标准误。 |
表3 影响因子的交互探测结果Tab.3 Interactive detection results of impact factors |
| 分级 | 交互指标 | 交互作用 |
|---|---|---|
| 健康照护 | Pop∩Ser=0.574 | 双因子增强 |
| Pay∩Traf=0.574 | 非线性增强 | |
| Pay∩Pop=0.557 | 双因子增强 | |
| Eco∩Ser=0.547 | 双因子增强 | |
| Eco∩Pay=0.538 | 双因子增强 | |
| 轻度失能照护 | Pop∩Ser=0.917 | 双因子增强 |
| Pop∩Soc=0.911 | 非线性增强 | |
| Med∩Traf=0.90 | 非线性增强 | |
| Eco∩Soc=0.903 | 双因子增强 | |
| Pop∩Traf=0.897 | 双因子增强 | |
| 中度失能照护 | Pop∩Ser=0.901 | 双因子增强 |
| Med∩Traf=0.899 | 非线性增强 | |
| Pop∩Soc=0.897 | 双因子增强 | |
| Eco∩Soc=0.891 | 双因子增强 | |
| Pop∩Traf=0.884 | 双因子增强 | |
| 重度失能照护 | Med∩Traf=0.768 | 非线性增强 |
| Eco∩Med=0.755 | 双因子增强 | |
| Eco∩Traf=0.734 | 双因子增强 | |
| Eco∩Ser=0.730 | 双因子增强 | |
| Ser∩Traf=0.711 | 双因子增强 |
| [1] |
总报告起草组, 李志宏. 国家应对人口老龄化战略研究总报告[J]. 老龄科学研究, 2015, 3(3):4-38.
|
| [2] |
|
| [3] |
|
| [4] |
丁秋贤, 朱丽霞, 罗静. 武汉市养老设施空间可达性分析[J]. 人文地理, 2016, 31(2):36-42.
|
| [5] |
王兰, 周楷宸, 汪子涵. 健康公平理念下社区养老设施的空间分布研究:以上海市中心城区为例[J]. 人文地理, 2021, 36(1):48-55.
|
| [6] |
高向东, 何骏. 上海市养老机构空间可达性研究[J]. 中国人口科学, 2018(2):116-125,128.
|
| [7] |
|
| [8] |
|
| [9] |
刘昊, 李强, 薛兴利. 城乡居民长期照护服务质量评价研究[J]. 江西财经大学学报, 2021(6):61-74.
|
| [10] |
|
| [11] |
|
| [12] |
|
| [13] |
罗艳, 丁建定. 福利社会化背景下的机构养老利用差异[J]. 中国人口科学, 2020(5):79-90,127-128.
|
| [14] |
孙鹃娟, 沈定. 中国老年人口的养老意愿及其城乡差异:基于中国老年社会追踪调查数据的分析[J]. 人口与经济, 2017(2):11-20.
|
| [15] |
毕向阳, 李沫. 在公平与效率之间:对北京市养老资源的空间分析[J]. 社会, 2020, 40(3):117-147.
|
| [16] |
|
| [17] |
|
| [18] |
冯周卓, 孙颖. 论城市空间公平及其基本维度[J]. 湖南大学学报:社会科学版, 2018, 32(2):155-160.
|
| [19] |
曾毅, 陈华帅, 王正联. 21世纪上半叶老年家庭照料需求成本变动趋势分析[J]. 经济研究, 2012, 47(10):134-149.
|
| [20] |
张园, 王伟. 失能老年人口规模及其照护时间需求预测[J]. 人口研究, 2021, 45(6):110-125.
|
| [21] |
黄枫, 吴纯杰. 中国老年人长期护理发生规律和保障制度模拟研究[J]. 数理统计与管理, 2018(4):587-602.
|
| [22] |
崔晓东. 中国老年人口长期护理需求预测:基于多状态分段常数Markov分析[J]. 中国人口科学, 2017(6):82-93,128.
|
| [23] |
胡宏伟, 李延宇. 中国农村失能老年人照护需求与成本压力研究[J]. 中国人口科学, 2021(3):98-111.
|
| [24] |
曾通刚, 赵媛. 中国老龄事业发展水平时空演化及其与经济发展水平的空间匹配[J]. 地理研究, 2019, 38(6):1497-1511.
|
| [25] |
刘彦随, 杨忍. 中国县域城镇化的空间特征与形成机理[J]. 地理学报, 2012, 67(8):1011-1020.
|
| [26] |
张荣天, 张小林, 陆建飞, 等. 我国乡村转型发展时空分异格局与影响机制分析[J]. 人文地理, 2021, 36(3):138-147.
|
| [27] |
李俏, 陈健. 农村自我养老的研究进路与类型诠释:一个文献综述[J]. 华中农业大学学报:社会科学版, 2017(1):98-104,144.
|
| [28] |
刘欣, 顾源. 收敛还是发散:社会经济地位影响老年人口健康的年龄:世代轨迹[J]. 社会科学, 2023(3):148-159.
|
| [29] |
丁丽曼, 傅利平, 谢宇. 医养结合运行的影响因素及其机制:基于多案例的比较分析[J]. 中国行政管理, 2022(2):83-93.
|
| [30] |
|
| [31] |
|
| [32] |
范方志, 王晓彦. 中国农村基本公共服务供给效率的评价研究[J]. 宁夏社会科学, 2020(5):83-91.
|
| [33] |
雷霆, 郭娟, 向川. 中国人口老龄化风险分布的梯次结构及其动态演进[J]. 人口与经济, 2023(1):87-105.
|
| [34] |
张川川, 陈斌开. “社会养老”能否替代“家庭养老”?来自中国新型农村社会养老保险的证据[J]. 经济研究, 2014, 49(11):102-115.
|
| [35] |
冯华, 邱雨如, 黄宇, 等. 养老服务补贴研究:补需方比补供方更好吗?[J]. 中国管理科学, 2023, 31(9):266-277.
|
/
| 〈 |
|
〉 |