
中国城市供应网络结构演化特征与影响机制
|
陈刚(1988—),男,博士,助理研究员,研究方向为城市网络与区域发展。E-mail:chengang0082006@163.com |
收稿日期: 2022-12-06
修回日期: 2024-04-07
网络出版日期: 2024-11-29
基金资助
国家自然科学基金项目(72163010)
国家社会科学基金项目(23BJL114)
广东省高校创新团队(2023WCXTD021)
广东省普通高校重点领域专项(2022ZDZX4057)
Evolutionary Characteristics and Influencing Factors of China's Urban Supply Network Structure
Received date: 2022-12-06
Revised date: 2024-04-07
Online published: 2024-11-29
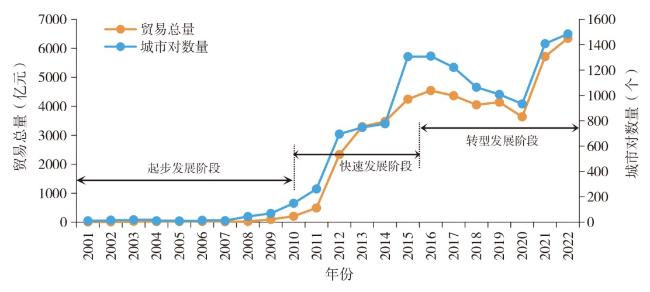
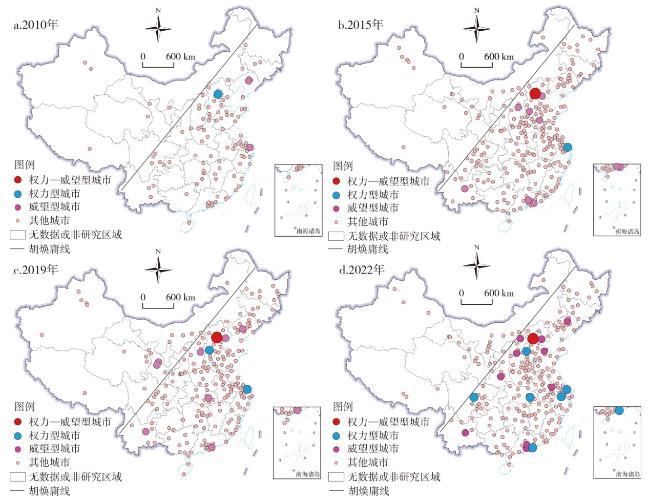
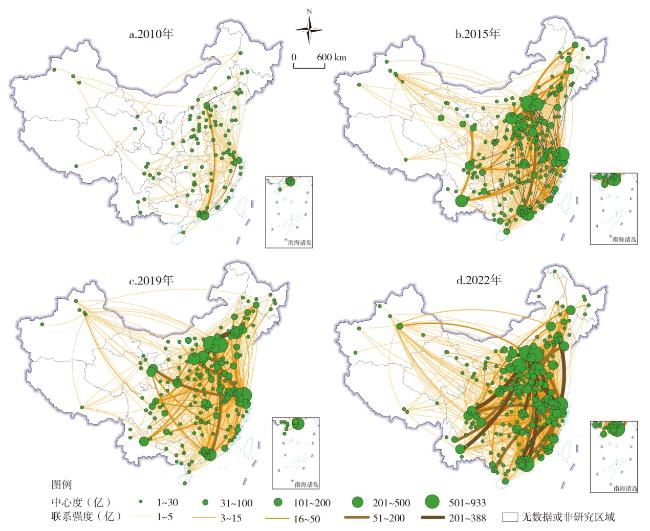
融合生产网络和价值链理论构建城市供应网络理论分析框架,基于2001—2022年上市公司与供应商交易数据构建中国城市供应网络,采用复杂网络和面板模型等方法,分析了其时空演化特征与影响机制。研究发现:①中国城市供应网络密度总体位于0.010~0.018之间,呈现波动增长的变化特征,网络呈现明显的小世界特征,且网络的可达性在增强;②网络联系集中在少数核心城市,北京是唯一的权力—威望型城市,权力型和威望型城市数量在增加并具有明显的集聚指向,权力型城市以上海、杭州、武汉、成都、深圳等中心城市为主,威望型城市以唐山、太原、芜湖、中山、大同等资源型和传统制造业城市为主;③城市供应网络空间联系呈现由沿海点轴结构向多轴线空间结构转变的特征,整体上呈现尚未闭合的“菱形”空间结构;④影响机制上,经济发展水平、政府干预强度、产业结构、资源禀赋、人力资本等是影响城市供应网络的主要因素,不同发展阶段和不同区域的影响机制具有差异性。
陈刚 , 王启松 , 王光辉 , 吴清 , 胡骁宇 . 中国城市供应网络结构演化特征与影响机制[J]. 经济地理, 2024 , 44(10) : 24 -33 . DOI: 10.15957/j.cnki.jjdl.2024.10.003
This article constructs a theoretical analysis framework for urban supply networks based on the theories of production network and value chain. Based on the transaction data between listed companies and suppliers from 2001 to 2022, it constructs a urban supply network of China, and uses the complex network and panel model to analyze the spatiotemporal evolution characteristics and influencing mechanisms of urban supply networks. It's found that: 1) The overall density of China's urban supply network is between 0.010 and 0.018, showing a fluctuating growth trend. The network exhibits obvious small world characteristics, the accessibility of urban supply network is increasing. 2) The supply network connections in Chinese cities are concentrated in a few core cities, Beijing is the only power-prestige city. The number of power-oriented and prestige-oriented cities is increasing and has an obvious clustering direction. Power-oriented cities mainly include central cities such as Shanghai, Hangzhou, Wuhan, Chengdu, and Shenzhen. Prestige-oriented cities are mainly resource-based cities such as Tangshan, Taiyuan, Wuhu, Zhongshan, and Datong. 3) The spatial connections of urban supply networks exhibit a transformation from a coastal point axis structure to a multi axis spatial structure. Overall, it presents an unclosed "diamond shaped" spatial structure. 4) In terms of influencing mechanisms, economic development level, government intervention intensity, industrial structure, resource endowment, human capital are the main factors affecting urban supply networks. The impact mechanisms vary among different development stages and regions.
表1 中国城市供应网络复杂性特征量统计Tab.1 Statistics of complexity characteristics of urban supply network in China |
| 年份 | 平均度 | 网络密度 | 平均聚类系数 | 平均路径长度 |
|---|---|---|---|---|
| 2010 | 1.321 | 0.010 | 0.031 | 3.867 |
| 2011 | 1.627 | 0.010 | 0.063 | 3.613 |
| 2012 | 2.700 | 0.011 | 0.080 | 3.443 |
| 2013 | 2.851 | 0.011 | 0.099 | 3.353 |
| 2014 | 2.988 | 0.012 | 0.087 | 3.356 |
| 2015 | 4.169 | 0.015 | 0.143 | 3.029 |
| 2016 | 4.050 | 0.014 | 0.138 | 3.072 |
| 2017 | 4.167 | 0.014 | 0.142 | 3.050 |
| 2018 | 3.720 | 0.013 | 0.150 | 3.028 |
| 2019 | 3.810 | 0.013 | 0.179 | 3.038 |
| 2020 | 3.508 | 0.013 | 0.168 | 3.040 |
| 2021 | 4.675 | 0.016 | 0.179 | 2.896 |
| 2022 | 4.866 | 0.018 | 0.186 | 2.973 |
表2 中国城市供应网络节点中心性的影响机制回归分析Tab.2 Regression analysis of influencing factors on node centrality of China's urban supply network |
| 变量 | lnpointin | lnpointout | lncenter |
|---|---|---|---|
| lngdp | 1.304***(5.41) | -0.119(-0.50) | 1.497***(6.12) 36.892***(11.41) |
| lngov | 31.676***(9.92) | 30.531***(9.79) | |
| stru | 0.094***(8.63) | 0.052***(4.93) | 0.072***(6.51) |
| lnloan | 1.454***(7.23) | 1.329***(6.77) | 1.697***(8.33) |
| lnlabor | 0.173(0.85) | 0.840**(4.23) | 0.493**(2.39) |
| mineral | -0.011(-0.22) | 0.008***(5.35) | 0.045***(6.80) |
| lndata | 0.006(0.05) | 0.394**(2.17) | 0.076(0.61) |
| 常数项 | -47.943***(-22.97) | -21.830***(-6.55) | -57.647***(-27.23) |
表3 中国城市供应网络影响机制的时段异质性回归分析Tab.3 Regression analysis of time heterogeneity of influencing factors of China's urban supply network |
| 变量 | 起步发展阶段 | 快速发展阶段 | 转型发展阶段 | ||||||||
|---|---|---|---|---|---|---|---|---|---|---|---|
| lnindegree | lntoutdegree | lndegree | lnindegree | lntoutdegree | lndegree | lnindegree | lntoutdegree | lndegree | |||
| lngdp | 0.413 | -0.444 | 0.232 | 0.963 | 1.060 | 0.411 | 1.176** | 1.887*** | 1.692*** | ||
| (1.06) | (-1.47) | (0.52) | (0.72) | (0.80) | (0.30) | (2.27) | (3.38) | (3.35) | |||
| lngov | 1.935 | 5.552 | 6.343 | 5.904 | 8.413 | 8.927 | 316.779** | 23.043*** | 17.808** | ||
| (0.52) | (1.62) | (1.42) | (0.72) | (0.91) | (1.14) | (2.21) | (2.83) | (2.41) | |||
| stru | 1.637 | 0.941 | 1.412 | 0.785** | 0.109** | 0.748** | -0.032 | 0.065*** | -0.006 | ||
| (0.94) | (0.81) | (0.95) | (2.05) | (2.42) | (1.99) | (-1.39) | (2.59) | (-0.25) | |||
| lnloan | 0.477 | 0.437* | 0.744* | 0.563* | 1.213** | 0.648** | 0.909** | 0.691 | 0.445 | ||
| (1.35) | (1.70) | (1.86) | (1.79) | (2.36) | (2.36) | (2.18) | (1.54) | (1.10) | |||
| lnlabor | 0.266 | 0.539** | 0.364* | 1.178** | 1.143** | 3.513*** | 0.770*** | 0.331 | 0.894*** | ||
| (1.10) | (2.28) | (1.85) | (2.13) | (2.27) | (2.79) | (3.42) | (1.36 | (4.07) | |||
| mineral | 0.016** | -0.018*** | 0.020** | 6.445 | 0.233 | 14.205** | 8.281*** | 6.056*** | 9.072** | ||
| (2.38) | (-2.94) | (2.48) | (0.87) | (0.03) | (2.00) | (4.06) | (2.76) | (4.57) | |||
| lndata | 0.110 | 0.086 | 0.209 | 0.198 | 1.215 | 1.031 | 0.106 | 0.172* | 0.172** | ||
| (0.77) | (0.68) | (1.23) | (0.26) | (1.17) | (1.45) | (1.21) | (1.82) | (2.02) | |||
| 常数项 | -17.859*** | -7.344 | -20.354*** | 11.898 | -11.993 | 4.949 | -38.225*** | -47.974*** | -40.94*** | ||
| (-3.24) | (-1.60) | (-3.09) | (0.42) | (-0.45) | (0.18) | (-10.50) | (-12.25) | (-11.55) | |||
表4 中国城市供应网络影响机制的区域异质性回归分析Tab.4 Regression analysis of regional heterogeneity of influencing factors of China's urban supply network |
| 变量 | 东部地区 | 中部地区 | 西部地区 | ||||||||
|---|---|---|---|---|---|---|---|---|---|---|---|
| lnindegree | lntoutdegree | lndegree | lnindegree | lntoutdegree | lndegree | lnindegree | lntoutdegree | lndegree | |||
| lngdp | 1.544*** | 0.590 | 2.251*** | 0.605 | -0.413 | 0.627 | 1.846*** | 1.846*** | 1.614*** | ||
| (3.30) | (1.23) | (4.91) | (1.43) | (-0.98) | (1.44) | (5.05) | (5.05) | (4.23) | |||
| lngov | 39.095*** | 32.288*** | 39.143*** | 21.756*** | 38.292*** | 39.508** | 25.916*** | 25.916*** | 24.737*** | ||
| (6.94) | (5.60) | (7.08) | (3.81) | (6.69) | (6.72) | (4.98) | (4.98) | (4.56) | |||
| stru | 0.138*** | 0.069*** | 0.109*** | -0.022 | 0.002 | -0.039 | 0.120*** | 0.120*** | 0.103*** | ||
| (6.73) | (3.29) | (5.44) | (-1.18) | (0.10) | (-0.70) | (6.82) | (6.82) | (5.58) | |||
| lnloan | 1.848*** | 1.921*** | 1.979*** | 2.954*** | 1.396*** | 3.005*** | 0.162 | 0.162 | 0.742 | ||
| (4.98) | (5.06) | (5.43) | (8.15) | (3.84) | (8.05) | (0.53) | (0.53) | (0.35) | |||
| lnlabor | -0.716** | -0.541 | -0.738** | -1.215*** | 1.036*** | -0.768** | 1.260*** | 1.260*** | 1.762*** | ||
| (-2.08) | (-1.54) | (-2.19) | (-3.30) | (2.82) | (2.03) | (3.14) | (3.14) | (4.21) | |||
| mineral | -0.003 | -0.003 | -0.005 | 0.968 | 0.913*** | 5.300 | 7.209 | 16.971*** | 15.373*** | ||
| (-0.06) | (-0.06) | (-0.10) | (0.30) | (4.29) | (1.62) | (1.33) | (3.20) | (2.95) | |||
| lndata | 0.069 | 0.161 | -0.965 | -0.004 | 0.596*** | 0.245 | -0.161 | -0.161 | -0.164 | ||
| (-0.28) | (0.64) | (-0.40) | (-0.02) | (2.98) | (1.19) | (-0.79) | (-0.79) | (-0.77) | |||
| [1] |
葛顺奇, 关乾伟, 罗伟. 供应链配置与企业绩效表现:效率与稳定[J]. 世界经济研究, 2022(4):32-46,135-136.
|
| [2] |
|
| [3] |
胡国建, 陆玉麒. 基于企业视角的城市网络研究进展、思考和展望[J]. 地理科学进展, 2020, 39(9):1587-1596.
|
| [4] |
|
| [5] |
|
| [6] |
赵新正, 李秋平, 芮旸, 等. 基于财富500强中国企业网络的城市网络空间联系特征[J]. 地理学报, 2019, 74(4):694-709.
|
| [7] |
叶秀玲, 张莉, 胡国建, 等. 基于企业并购联系视角的中国城市网络演变研究[J]. 地域研究与开发, 2022, 41(3):61-67.
|
| [8] |
焦敬娟, 张齐林, 吴宇勇, 等. 中国异地投资网络结构演化及影响因素研究[J]. 地理科学进展, 2021, 40(8):1257-1268.
|
| [9] |
陈肖飞, 杨洁辉, 王恩儒, 等. 基于汽车产业供应链体系的中国城市网络特征研究[J]. 地理研究, 2020, 39(2):370-383.
|
| [10] |
盛科荣, 杨雨, 孙威. 中国城市网络中心性的影响因素及形成机理——基于上市公司500强企业网络视角[J]. 地理科学进展, 2019, 38(2):248-258.
|
| [11] |
韩明珑, 何丹, 高鹏. 长江经济带城际生产性服务业网络联系的边界效应及多维机制[J]. 经济地理, 2021, 41(3):126-135.
|
| [12] |
包群, 廖赛男. 国内生产网络与间接出口外溢:基于客户——供应商关系的证据[J]. 管理世界, 2023, 39(8):20-45.
|
| [13] |
|
| [14] |
赵梓渝, 王士君, 陈肖飞, 等. “全球—地方”视角下中国汽车生产网络的跨域关联与影响因素——一汽—大众案例[J]. 地理科学进展, 2022, 41(5):741-754.
|
| [15] |
王长建, 卢敏仪, 陈静, 等. 城市网络视角下华为手机全球价值链的建构与重构[J]. 地理科学进展, 2022, 41(9):1606-1621.
|
| [16] |
刘清, 杨永春, 蒋小荣, 等. 基于全球价值链的全球化城市网络分析——以苹果手机供应商为例[J]. 地理学报, 2021, 76(4):870-887.
|
| [17] |
徐海英, 周潮. 全球生产网络(GPNs)与区域发展的动态战略耦合——苏南与苏北韩资汽车行业企业价值捕获轨迹的比较[J]. 人文地理, 2019, 34(4):89-96.
|
| [18] |
张旭, 余方正, 徐良佳. 基于文化产业企业网络视角的中国城市网络空间结构研究[J]. 地理科学进展, 2020, 39(1):78-90.
|
| [19] |
盛科荣, 张红霞, 赵超越. 中国城市网络关联格局的影响因素分析——基于电子信息企业网络的视角[J]. 地理研究, 2019, 38(5):1030-1044.
|
| [20] |
|
| [21] |
陈旭, 邱斌, 刘修岩, 等. 多中心结构与全球价值链地位攀升:来自中国企业的证据[J]. 世界经济, 2019, 42(8):72-96.
|
| [22] |
黄守坤, 李文彬. 产业网络及其演变模式分析[J]. 中国工业经济, 2005(4):53-60.
|
| [23] |
何瑶, 杨永春, 王绍博. 价值链视角下中国新能源汽车产业网络及其机制[J]. 地理学报, 2023, 78(12):3018-3036.
|
| [24] |
周韬. 价值链视角下的城市空间演化研究[M]. 北京: 中国社会科学出版社, 2021.
|
| [25] |
|
| [26] |
|
| [27] |
|
| [28] |
刘军. 社会网络分析导论[M]. 北京: 社会科学文献出版社, 2004.
|
| [29] |
周媛媛, 董平, 陆玉麒, 等. 基于上市高新技术企业的中国城市创新网络及其影响因素[J]. 经济地理, 2023, 43(6):145-155.
|
| [30] |
朱兰, 王勇. 要素禀赋如何影响企业转型升级模式?——基于制造业与服务业企业的差异分析[J]. 当代经济科学, 2022, 44(1):55-66.
|
| [31] |
潘峰华, 夏亚博, 刘作丽. 区域视角下中国上市企业总部的迁址研究[J]. 地理学报, 2013, 68(4):449-463.
|
| [32] |
张洪辉. 社会资本、政府干预和上市公司过度投资[J]. 山西财经大学学报, 2014, 36(10):67-75.
|
| [33] |
叶雅玲, 林文盛, 李振发, 等. 中国城市间投融资网络结构及其影响因素[J]. 世界地理研究, 2020, 29(2):307-316.
|
| [34] |
陈琳, 陈敏. 金融抑制是否促进了中国的加工贸易[J]. 财贸研究, 2017, 28(6):28-36,100.
|
| [35] |
王世平, 赵春燕. 城市集聚影响城市出口贸易的机制与效应[J]. 山西财经大学学报, 2017, 39(12):59-71.
|
| [36] |
郝寿义. 区域经济学原理[M]. 上海: 上海三联出版社, 2015.
|
| [37] |
李宏兵, 赵丁然, 赵春明. 数字经济发展对我国省际贸易的影响:理论逻辑与实证检验[J]. 北京师范大学学报:社会科学版, 2022(5):102-113.
|
| [38] |
胡国建, 陆玉麒, 吴小影, 等. 基于企业间联系视角的长江经济带城市网络结构及其变化特征研究[J]. 人文地理, 2021, 36(2):146-154.
|
| [39] |
陈刚, 王光辉, 郑满茵. 上市公司与客户联系视角下的中国城际网络结构时空演化研究[J]. 地球信息科学学报, 2023, 25(1):223-238.
|
| [40] |
戴靓, 曹湛, 马海涛, 等. 中国城市知识合作网络结构演化的影响机制[J]. 地理学报, 2023, 78(2):334-350.
|
/
| 〈 |
|
〉 |