
中国粮食作物种业企业空间格局及其影响因素
|
任世鑫(1991—),男,博士,讲师,研究方向为农业环境与农区发展。E-mail:rsxhenu@163.com |
收稿日期: 2023-10-26
修回日期: 2024-05-16
网络出版日期: 2024-09-14
基金资助
国家自然科学基金项目(41971222)
国家自然科学基金项目(42171182)
河南省重点研发与推广专项(科技攻关)项目(222102110420)
河南省自然科学优秀青年基金项目(222300420021)
河南省哲学社会科学规划年度项目(2023CJJ125)
Spatial Pattern and Influential Factors of Enterprises of Grain Crop Seed Industry in China
Received date: 2023-10-26
Revised date: 2024-05-16
Online published: 2024-09-14
任世鑫 , 李二玲 , 邓晴晴 , 赵金彩 . 中国粮食作物种业企业空间格局及其影响因素[J]. 经济地理, 2024 , 44(6) : 124 -133 . DOI: 10.15957/j.cnki.jjdl.2024.06.013
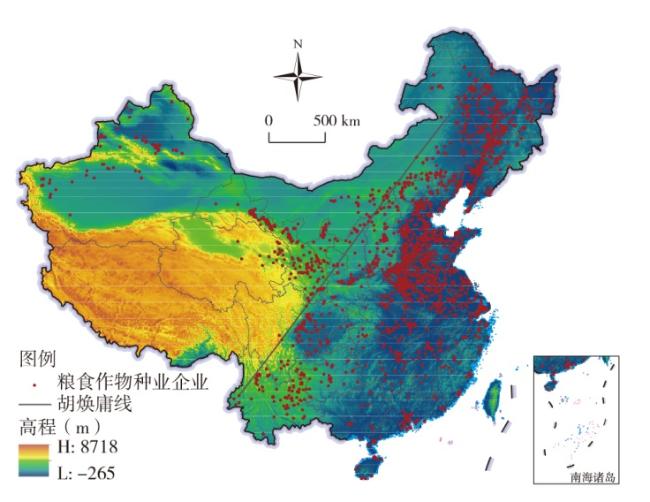
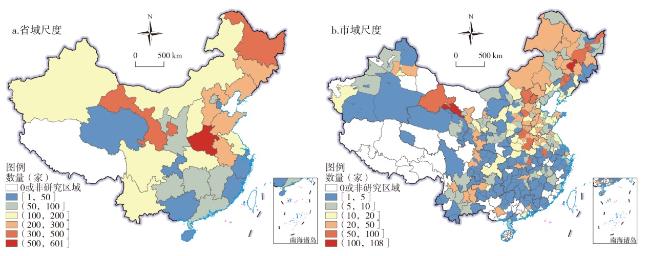
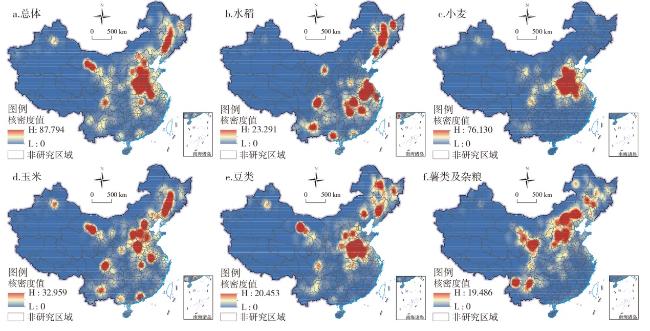
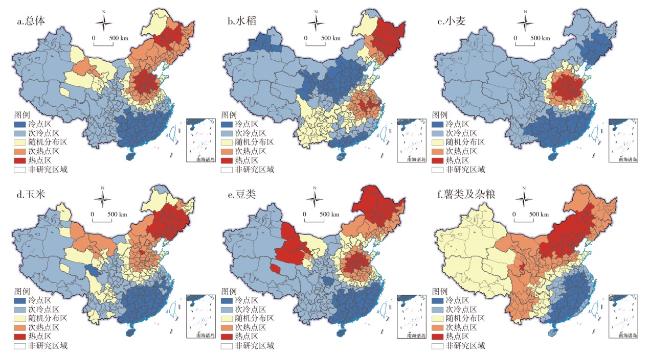
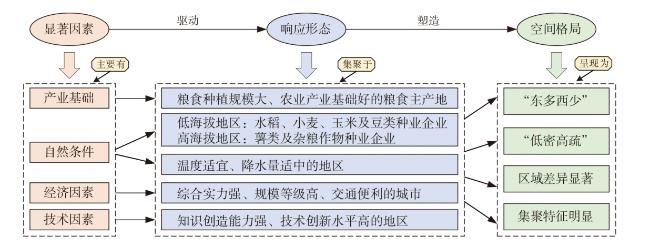
Based on the data of 4119 enterprises of grain crop seed industry in China in 2022,this paper analyzes the spatial distribution pattern and the influencing factors of enterprises of grain crop seed industry using the methods of nearest neighbor analysis,kernel density estimation,spatial hotspot analysis and Tobit regression analysis. The results show that: 1) Enterprises of China's grain crop seed industry in general presents a spatial distribution pattern,which is more in the east of China than that in the west of China,the density is higher in low altitude areas than that in high altitude areas,it's significant in terms of regional differences and agglomeration characteristics. 2) The density spaces of total sample enterprises and classified enterprises of grain crop seed industry both show "heterogeneity-multi-core" characteristics,cold and hot spots are concentrated and stratified. 3) The spatial distribution of grain crop seed enterprises in China is mainly influenced by the industrial base,comprehensive strength of cities and technical factors,and is deeply dependent on natural conditions such as topography,temperature and precipitation. 4) Under the joint action of many factors,enterprises of China's grain crop seed industry are mainly distributed in main grain producing areas with rich agricultural resources,obvious advantages in agricultural industry and suitable natural conditions,municipalities and provincial capitals with strong comprehensive strength and high scale rating,and areas with outstanding gathering effect of innovation factors,obvious advantages in the scale of innovation outputs and convenient transport conditions.
表1 中国粮食作物种业企业基础信息Tab.1 Basic information of enterprises of China's grain crop seed industry |
| 类型 | 数量/家(比例/%) | 类型 | 数量/家(比例/%) | |||
|---|---|---|---|---|---|---|
| 成立时间 | 1979—2000年 | 296(7.19) | 粮食作物企业种类 | 水稻 | 957 | |
| 2001—2010年 | 1725(41.88) | 小麦 | 1627 | |||
| 2011—2022年 | 2098(50.94) | 玉米 | 1751 | |||
| 企业类型 | 有限责任公司 | 3861(93.74) | 豆类 | 1099 | ||
| 股份有限公司 | 124(3.01) | 薯类及杂粮 | 909 | |||
| 其他 | 134(3.25) | 种子生产经营许可证颁发机构 | 国家农业农村部 | 100(2.43) | ||
| 注册资本(元) | <100万 | 107(2.60) | 省(区)农业农村厅 | 1276(30.98) | ||
| 100~1000万 | 1904(46.22) | 市级农业农村局 | 608(14.76) | |||
| 1000~5000万 | 1771(43.00) | 县级农业农村局 | 2135(51.83) | |||
| >5000万 | 337(8.18) |
注:由于多家种业企业的生产经营范围包含多种作物,在统计企业数量时依据粮食作物种类分别进行归类统计(如A企业的种子生产经营范围为小麦、玉米,则将其同时归类于小麦种业企业和玉米种业企业分别进行统计)。 |
表2 粮食作物种业企业最邻近指数分析结果Tab.2 Results of the NNI analysis of enterprises of grain crop seed industry |
| 企业类型 | NNI | Z得分 | P值 | 空间分布模式 | 平均观测距离(km) | 预期平均距离(km) |
|---|---|---|---|---|---|---|
| 总体 | 0.24 | -92.98 | 0.00 | 集聚 | 7.56 | 31.16 |
| 水稻 | 0.26 | -44.11 | 0.00 | 集聚 | 15.51 | 60.74 |
| 小麦 | 0.23 | -59.32 | 0.00 | 集聚 | 10.76 | 46.52 |
| 玉米 | 0.27 | -58.69 | 0.00 | 集聚 | 12.50 | 46.67 |
| 豆类 | 0.28 | -45.41 | 0.00 | 集聚 | 16.69 | 58.68 |
| 薯类及杂粮 | 0.32 | -39.23 | 0.00 | 集聚 | 19.45 | 60.75 |
表3 变量选取与描述Tab.3 Variable selection and description |
| 变量性质 | 变量名称 | 变量符号 | 变量描述 | |
|---|---|---|---|---|
| 因变量 | - | 种业企业数量 | N | 城市拥有粮食作物种业企业数量 |
| 解释变量 | 产业基础 | 粮食种植规模 | sow | 粮食作物播种面积 |
| 产业结构 | indus | 第一产业产值比重 | ||
| 经济因素 | 城市等级 | hier | 是否为直辖市或省会城市 | |
| 经济规模 | gdp | 地区生产总值 | ||
| 劳动力成本 | wage | 在岗职工平均工资 | ||
| 交通条件 | tfc | 路网密度 | ||
| 经济外向度 | tra | 进出口总额占GDP比重 | ||
| 自然条件 | 地形 | elev | 海拔 | |
| 气温 | temp | 平均气温 | ||
| 降水 | prcp | 年降水量 | ||
| 技术因素 | 知识创造能力 | edu | 农业类高校及其他设有农学专业高校数量 | |
| 技术创新水平 | pat | 专利授权数 | ||
| 财政科技投入 | sci | 科学技术支出占地方财政支出比重 | ||
| 政策因素 | 支持性政策 | pol | 是否有国家现代农业产业园 | |
表4 Tobit模型回归结果Tab.4 Regression results of Tobit model |
| 变量名称 | 模型Ⅰ | 模型Ⅱ | 模型Ⅲ | 模型Ⅳ | 模型Ⅴ | 模型Ⅵ |
|---|---|---|---|---|---|---|
| sow | 0.121*** | 0.139*** | 0.058 | 0.146*** | 0.151*** | 0.129*** |
| indus | 0.357*** | 0.694*** | 0.114 | 0.331*** | 0.411*** | 0.403*** |
| hier | 0.884*** | 0.883** | -0.463 | 1.099*** | 0.669** | 0.360 |
| gdp | 0.441*** | 0.212 | 1.035*** | 0.311** | 0.531*** | 0.811*** |
| wage | -0.312 | 1.994*** | -0.265 | 0.041 | -0.143 | 0.191 |
| tfc | 0.303*** | -0.290 | 1.443*** | 0.223* | 0.173 | 0.391** |
| tra | -0.134** | -0.097 | -0.347*** | -0.022 | -0.178** | -0.115 |
| elev | -0.144*** | -0.252*** | -0.233** | 0.013 | -0.144** | 0.123* |
| temp | -0.953*** | -0.481* | -1.360*** | -0.209 | -1.096*** | -1.086*** |
| prcp | -0.880*** | 0.705*** | -1.518*** | -1.002*** | -0.817*** | -1.200*** |
| edu | 0.035* | 0.047* | 0.051 | 0.030 | 0.031 | 0.011 |
| pat | 0.202** | 0.206 | 0.177 | 0.285*** | 0.236** | 0.081 |
| sci | 0.103 | 0.215** | 0.130 | -0.084 | 0.108 | -0.201** |
| pol | 0.129 | 0.221 | -0.159 | 0.038 | -0.233 | 0.122 |
| Log likelihood | -373.849 | -335.616 | -353.880 | -355.764 | -330.447 | -293.805 |
| Pseudo R2 | 0.225 | 0.145 | 0.155 | 0.202 | 0.197 | 0.230 |
| LRchi2 | 217.616 | 113.608 | 129.466 | 180.212 | 162.577 | 175.850 |
| Prob>chi2 | 0.000 | 0.000 | 0.000 | 0.000 | 0.000 | 0.000 |
注:***、**、*分别表示在1%、5%和10%水平上显著。 |
| [1] |
全国政协农业和农村委员会课题组. 推进种业振兴筑牢粮食安全屏障[N]. 人民政协报,2022-04-01(1).
|
| [2] |
求是网. 习近平:下决心把民族种业搞上去[EB/OL]. http://www.qstheory.cn/zhuanqu/2022-06/19/c_1128755705.htm.
|
| [3] |
肖翠萍, 李晓云. 农作物育种产学研合作网络特征及其对种子企业技术创新绩效的影响——基于植物新品种权申请的合作网络分析[J]. 中国农村经济, 2023(5):42-60.
|
| [4] |
陈肖飞, 韩腾腾, 栾俊婉, 等. 新创企业的时空分异与区位选择——基于中国汽车制造业的实证研究[J]. 地理研究, 2021, 40(6):1749-1767.
|
| [5] |
钟业喜, 傅钰, 郭卫东, 等. 中国上市公司总部空间格局演变及其驱动因素研究[J]. 地理科学, 2018, 38(4):485-494.
|
| [6] |
刘颖, 郭琪, 贺灿飞. 城市区位条件与企业区位动态研究[J]. 地理研究, 2016, 35(7):1301-1313.
|
| [7] |
陈建军, 崔春梅, 陈菁菁. 集聚经济、空间连续性与企业区位选择——基于中国265个设区城市数据的实证研究[J]. 管理世界, 2011(6):63-75.
|
| [8] |
|
| [9] |
|
| [10] |
李小建, 胡雪瑶. 中国公司地理研究进展及特色凝练[J]. 经济地理, 2021, 41(10):33-41.
|
| [11] |
李二玲. 中国农业产业集群演化过程及创新发展机制——以“寿光模式”蔬菜产业集群为例[J]. 地理科学, 2020, 40(4):617-627.
|
| [12] |
|
| [13] |
|
| [14] |
王浩然, 王玉华, 刘笑含, 等. 中国有机农业企业基地的空间依赖性与影响因素分析——以四川省为例[J]. 中国农业资源与区划, 2023, 44(12):67-76.
|
| [15] |
杨明洪, 孙继琼. 农业产业化发展的空间分布与影响因素分析——以农业产业化国家重点龙头企业为例[J]. 财经科学, 2008(7):103-110.
|
| [16] |
熊友云, 张明军, 刘园园, 等. 中国农业产业化龙头企业空间分布特征——以国家级重点龙头企业为例[J]. 地理科学进展, 2009, 28(6):991-997.
|
| [17] |
马仁锋, 刘丽东, 伍灵芝, 等. 青藏地区农牧企业区位特征变化及影响因素[J]. 经济地理, 2022, 42(12):133-141.
|
| [18] |
|
| [19] |
|
| [20] |
|
| [21] |
|
| [22] |
|
| [23] |
李万君, 胡春红, 李艳军. 规模化还是多元化,抑或二者并举?——种子企业技术创新能力提升路径的实证分析[J]. 中国农村经济, 2021(5):102-123.
|
| [24] |
李万君, 李艳军, 李婷婷, 等. 政府支持如何影响种子企业技术创新绩效?——基于政策、组织和市场异质性的分析[J]. 中国农村经济, 2019(9):104-123.
|
| [25] |
侯军岐. 我国种业企业核心竞争力及其培育[J]. 西北农林科技大学学报:社会科学版, 2016, 16(4):116-122.
|
| [26] |
胡国建, 陆玉麒, 胡舒云. 顾及企业注册地址的区位理论研究[J]. 地理研究, 2022, 41(2):580-595.
|
| [27] |
蒋辉, 刘兆阳. 中国农业产业化龙头企业空间分布特征及其影响因素[J]. 吉首大学学报:社会科学版, 2020, 41(6):94-101.
|
| [28] |
吕大国, 耿强, 简泽, 等. 市场规模、劳动力成本与异质性企业区位选择——中国地区经济差距与生产率差距之谜的一个解释[J]. 经济研究, 2019, 54(2):36-53.
|
| [29] |
张婧, 李诚固, 周国磊, 等. 长春市公共服务设施用地演变格局与机制[J]. 地理学报, 2015, 70(12):1939-1952.
|
| [30] |
崔之珍, 李二玲, 刘晨光. 黄河流域绿色农业专业村的时空演变及机制[J]. 经济地理, 2021, 41(12):158-166.
|
| [31] |
蒋正云, 刘庆芳, 宋金平. 中国区域经济韧性的格局特征及演化机制[J]. 经济地理, 2023, 43(6):1-12.
|
| [32] |
赵静平, 卢明华, 刘汉初. 北京上市公司总部空间分布特征及影响因素[J]. 经济地理, 2020, 40(1):12-20.
|
| [33] |
肖凡, 王姣娥, 黄宇金, 等. 中国高新技术企业分布影响因素的空间异质性与尺度效应[J]. 地理研究, 2022, 41(5):1338-1351.
|
| [34] |
梁琦, 陈强远, 王如玉. 异质性企业区位选择研究评述[J]. 经济学动态, 2016 (4):126-139.
|
| [35] |
杨晓, 刘爱民, 薛莉, 等. 主要国家大豆压榨企业布局特征及其成因——以美国、巴西、中国为例[J]. 资源科学, 2018, 40(10):1931-1942.
|
/
| 〈 |
|
〉 |