
数字产业集群发展水平评价及其时空演变
|
卢福财(1963—),男,博士,教授,博士生导师,研究方向为数字经济与产业创新发展。E-mail:lu-fucai@263.net |
收稿日期: 2023-11-14
修回日期: 2024-06-26
网络出版日期: 2024-09-14
基金资助
国家社会科学基金重大招标项目(23&ZD073)
国家自然科学基金项目(72373056)
国家自然科学基金青年项目(72201114)
江西省社会科学基金重点项目(23ZXQH08)
江西省2022年度研究生创新专项资金项目(YC2022-B169)
江西省2023年度研究生创新专项资金项目(YC2023-B198)
Evaluation of the Development Level of Digital Industry Clusters and Its Spatiotemporal Evolution
Received date: 2023-11-14
Revised date: 2024-06-26
Online published: 2024-09-14
卢福财 , 钟诗韵 . 数字产业集群发展水平评价及其时空演变[J]. 经济地理, 2024 , 44(6) : 113 -123 . DOI: 10.15957/j.cnki.jjdl.2024.06.012
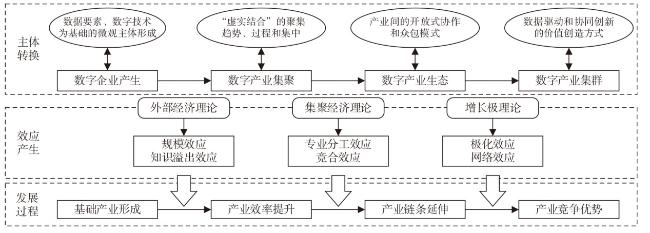
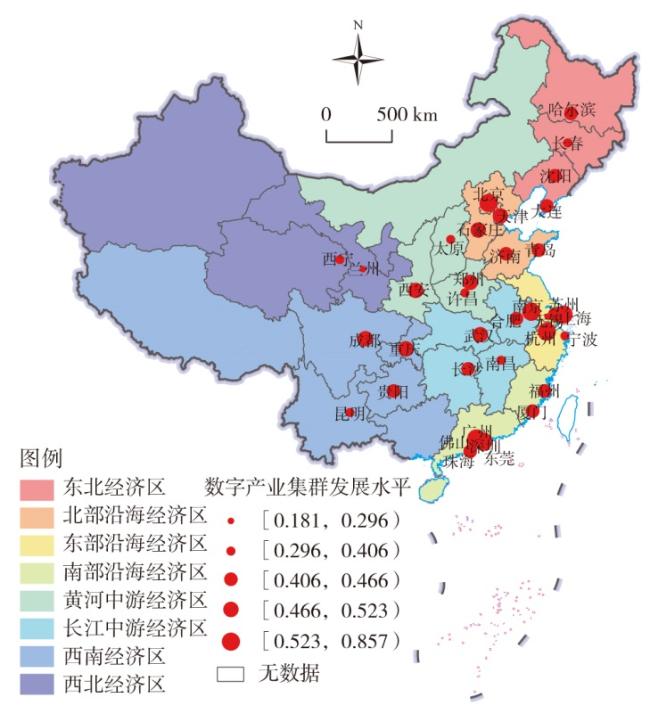
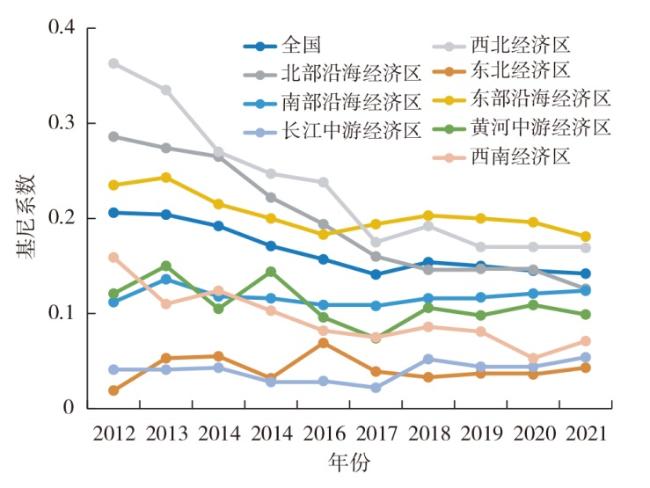
From the perspective of digital industry cluster evolution,this study identifies 36 digital industry clusters from 302 Chinese cities using the methods of the locational quotient and the social network analysis. It employs the dynamic improved TOPSIS to measure the development level of digital industry clusters,and explores their regional differences,sources,and distribution dynamics through overall and dimensional analysis. The research shows that: 1) The development level of China's digital industry clusters has been increasing year by year. 2) The support degree and its growth rate are the highest,serving as the "ballast" for the development of digital industry clusters,while the correlation degree has the lowest growth rate,representing the most potential development point. 3) Regional differences show a slight narrowing trend,mainly originating from regional disparities and super-variable density. 4) The development of digital industry clusters demonstrates stability and club convergence characteristics. From the trend forecasts,China's digital industry clusters are gradually improving over time,but the higher the neighboring level,the more it affects the trend of local development level concentrating towards higher values. Therefore,it is necessary to innovate cooperation models for digital industry clusters,explore coordinated development paths that balance heterogeneity and long-term effectiveness,and improve inter-regional interaction mechanisms,thereby creating digital industry clusters with international competitiveness.
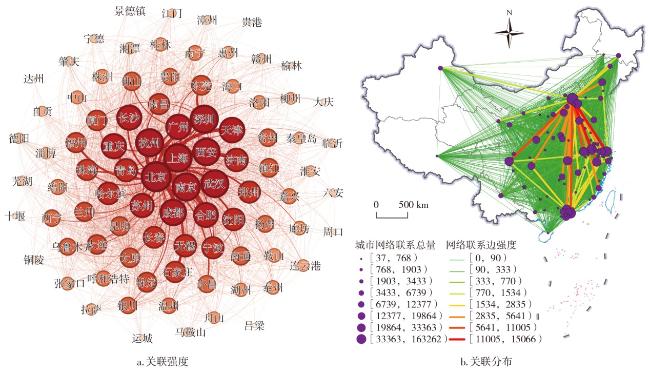
图2 中国潜在数字产业集群关联网络注:该图基于自然资源部标准地图服务网站审图号为GS(2023)2763号的标准地图制作,底图无修改。图3同。 Fig.2 Association network of potential digital industrial clusters in China |
表1 中国36个数字产业集群区域分布Tab.1 Regional distribution of 36 digital industry clusters in China |
| 序号 | 区域类型 | 数字产业集群 | 个数(个) |
|---|---|---|---|
| 1 | 东北经济区 | 沈阳*、长春*、哈尔滨*、大连 | 4 |
| 2 | 北部沿海经济区 | 北京**、天津**、青岛、济南*、石家庄* | 5 |
| 3 | 东部沿海经济区 | 上海**、南京*、杭州*、苏州、宁波、无锡 | 6 |
| 4 | 南部沿海经济区 | 深圳、广州*、佛山、福州*、珠海、东莞、厦门 | 7 |
| 5 | 黄河中游经济区 | 西安*、太原*、许昌、郑州* | 4 |
| 6 | 长江中游经济区 | 武汉*、合肥*、长沙*、南昌* | 4 |
| 7 | 西南经济区 | 成都*、重庆**、昆明*、贵阳* | 4 |
| 8 | 西北经济区 | 兰州*、西宁* | 2 |
注:以集群的中心城市命名数字产业集群,*代表省会城市,**代表直辖市;本文采用八大经济区划分方法分类[20]。 |
表2 数字产业集群发展水平的指标体系Tab.2 Index system of the development level of digital industry cluster |
| 一级指标 | 二级指标 | 三级指标 | 指标属性 | 数据来源 |
|---|---|---|---|---|
| 集中度 | 企业密度 | 数字企业数量/地理面积 | 正向 | 企查查数据库、《中国城市统计年鉴》 |
| 人力集聚 | 区位商 | 正向 | EPS数据库、《中国城市统计年鉴》 | |
| 关联度 | 产业链分工 | 数字产业上市公司供应商公司集中度 | 负向 | CSMAR数据库 |
| 数字产业上市公司客户公司集中度 | 负向 | |||
| 创新链协同 | 集群内联合发明专利申请强度 | 正向 | Incopat专利数据库 | |
| 集群间联合发明专利申请强度 | 正向 | |||
| 贡献度 | 经济效益 | 邮电业务贡献比 | 正向 | CNRDS数据库 |
| 数字产业上市公司纳税额 | 正向 | |||
| 创新成果 | 数字经济发明专利授权量/总发明专利授权量 | 正向 | ||
| 社会影响 | 就业贡献量(信息传输、计算机服务和软件业从业人员)[25] | 正向 | 《中国城市统计年鉴》 | |
| 支持度 | 基础网络 | 政府数字化注意力 | 正向 | 北大法宝以及各地方政府门户网站 |
| 交易网络 | 市场化程度[26] | 正向 | 各省份统计年鉴以及地级市统计公报 | |
| 资本网络 | 金融网点数量 | 正向 | 国家金融监督管理总局 | |
| 数字普惠金融指数[27] | 正向 | 北京大学普惠金融指数 |
表3 中国数字产业集群发展水平的测度结果Tab.3 Measurement results of the development level of China's digital industry cluster |
| 区域 | 2012 | 2013 | 2014 | 2015 | 2016 | 2017 | 2018 | 2019 | 2020 | 2021 | 综合水平 | 排名 |
|---|---|---|---|---|---|---|---|---|---|---|---|---|
| 全国 | 0.2856 | 0.3204 | 0.3411 | 0.3736 | 0.3915 | 0.4160 | 0.4300 | 0.4532 | 0.4540 | 0.4712 | 0.4636 | |
| 大连 | 0.2964 | 0.3012 | 0.2652 | 0.3947 | 0.4378 | 0.4352 | 0.4114 | 0.4318 | 0.4403 | 0.4796 | 0.4619 | 16 |
| 哈尔滨 | 0.2779 | 0.3686 | 0.3512 | 0.3386 | 0.3470 | 0.3925 | 0.4050 | 0.4239 | 0.4450 | 0.4620 | 0.4528 | 19 |
| 沈阳 | 0.2760 | 0.2949 | 0.3192 | 0.3636 | 0.4078 | 0.4135 | 0.4086 | 0.4075 | 0.4102 | 0.4411 | 0.4276 | 22 |
| 长春 | 0.2685 | 0.2827 | 0.3041 | 0.3471 | 0.3188 | 0.3589 | 0.3433 | 0.3571 | 0.3752 | 0.3860 | 0.3798 | 29 |
| 东北 | 0.2797 | 0.3118 | 0.3099 | 0.3610 | 0.3778 | 0.4000 | 0.3921 | 0.4051 | 0.4177 | 0.4422 | 0.4305 | |
| 北京 | 0.7469 | 0.7976 | 0.8403 | 0.8524 | 0.8441 | 0.8139 | 0.8330 | 0.8551 | 0.8514 | 0.8595 | 0.8562 | 1 |
| 天津 | 0.2534 | 0.2785 | 0.3324 | 0.3263 | 0.3838 | 0.4080 | 0.4511 | 0.5007 | 0.4861 | 0.5011 | 0.4955 | 12 |
| 石家庄 | 0.1686 | 0.2036 | 0.2252 | 0.3522 | 0.3577 | 0.4042 | 0.4576 | 0.4716 | 0.4817 | 0.4960 | 0.4889 | 13 |
| 济南 | 0.2355 | 0.2973 | 0.3769 | 0.4079 | 0.4220 | 0.4345 | 0.4448 | 0.4140 | 0.4415 | 0.4742 | 0.4581 | 17 |
| 青岛 | 0.2383 | 0.2392 | 0.2590 | 0.2776 | 0.3145 | 0.3484 | 0.3717 | 0.4103 | 0.3897 | 0.4362 | 0.4177 | 25 |
| 北部沿海 | 0.3285 | 0.3632 | 0.4068 | 0.4433 | 0.4644 | 0.4818 | 0.5116 | 0.5304 | 0.5301 | 0.5534 | 0.5433 | |
| 上海 | 0.4705 | 0.6005 | 0.6018 | 0.6273 | 0.6176 | 0.6333 | 0.6667 | 0.6940 | 0.7040 | 0.7035 | 0.7027 | 2 |
| 杭州 | 0.3748 | 0.4345 | 0.4477 | 0.4655 | 0.4816 | 0.5250 | 0.5532 | 0.5937 | 0.5943 | 0.6209 | 0.6092 | 5 |
| 南京 | 0.3342 | 0.4640 | 0.5078 | 0.5193 | 0.5455 | 0.5569 | 0.6018 | 0.6029 | 0.5916 | 0.6058 | 0.6006 | 6 |
| 苏州 | 0.2367 | 0.2637 | 0.2817 | 0.3135 | 0.3300 | 0.3611 | 0.3707 | 0.4078 | 0.4159 | 0.4340 | 0.4253 | 23 |
| 宁波 | 0.2482 | 0.2841 | 0.3247 | 0.3248 | 0.3445 | 0.2540 | 0.2438 | 0.2727 | 0.2885 | 0.3044 | 0.2961 | 34 |
| 无锡 | 0.0781 | 0.1198 | 0.1628 | 0.1931 | 0.2178 | 0.2483 | 0.2703 | 0.2531 | 0.2540 | 0.2873 | 0.2730 | 35 |
| 东部沿海 | 0.2904 | 0.3611 | 0.3878 | 0.4073 | 0.4228 | 0.4298 | 0.4511 | 0.4707 | 0.4747 | 0.4927 | 0.4845 | |
| 深圳 | 0.4566 | 0.5246 | 0.5082 | 0.5351 | 0.5708 | 0.6003 | 0.6415 | 0.6799 | 0.6662 | 0.7031 | 0.6881 | 3 |
| 广州 | 0.3410 | 0.3980 | 0.4151 | 0.4634 | 0.5004 | 0.5330 | 0.5852 | 0.5991 | 0.6184 | 0.6414 | 0.6298 | 4 |
| 厦门 | 0.3070 | 0.3302 | 0.3480 | 0.3763 | 0.3924 | 0.4089 | 0.4266 | 0.5134 | 0.4715 | 0.4525 | 0.4636 | 15 |
| 福州 | 0.3176 | 0.3632 | 0.3939 | 0.4545 | 0.4232 | 0.4488 | 0.4629 | 0.4593 | 0.4372 | 0.4625 | 0.4535 | 18 |
| 珠海 | 0.2801 | 0.2977 | 0.3177 | 0.3787 | 0.3636 | 0.3868 | 0.3940 | 0.4557 | 0.4360 | 0.4385 | 0.4387 | 21 |
| 东莞 | 0.2411 | 0.2607 | 0.2765 | 0.2871 | 0.3337 | 0.3540 | 0.3683 | 0.3738 | 0.3727 | 0.3983 | 0.3873 | 28 |
| 佛山 | 0.2527 | 0.2517 | 0.2757 | 0.3072 | 0.3315 | 0.3525 | 0.3691 | 0.3794 | 0.3657 | 0.3722 | 0.3705 | 30 |
| 南部沿海 | 0.3137 | 0.3466 | 0.3621 | 0.4003 | 0.4165 | 0.4406 | 0.4639 | 0.4944 | 0.4811 | 0.4955 | 0.4902 | |
| 郑州 | 0.2447 | 0.2943 | 0.3250 | 0.3530 | 0.3698 | 0.3934 | 0.4078 | 0.4975 | 0.5074 | 0.5143 | 0.5099 | 9 |
| 西安 | 0.3355 | 0.4036 | 0.3488 | 0.3903 | 0.4053 | 0.4333 | 0.4714 | 0.4732 | 0.4807 | 0.5120 | 0.4979 | 11 |
| 太原 | 0.1922 | 0.2005 | 0.2122 | 0.1686 | 0.2672 | 0.3526 | 0.2981 | 0.3515 | 0.3355 | 0.3670 | 0.3545 | 32 |
| 许昌 | 0.2027 | 0.2274 | 0.2543 | 0.3141 | 0.2759 | 0.3007 | 0.3017 | 0.3230 | 0.3176 | 0.3340 | 0.3272 | 33 |
| 黄河中游 | 0.2438 | 0.2815 | 0.2851 | 0.3065 | 0.3295 | 0.3700 | 0.3697 | 0.4113 | 0.4103 | 0.4318 | 0.4224 | |
| 武汉 | 0.2996 | 0.3179 | 0.3358 | 0.3556 | 0.3961 | 0.4194 | 0.4695 | 0.4885 | 0.5046 | 0.5323 | 0.5189 | 8 |
| 合肥 | 0.2671 | 0.2808 | 0.3263 | 0.3810 | 0.3754 | 0.3935 | 0.4187 | 0.4224 | 0.4521 | 0.4810 | 0.4661 | 14 |
| 长沙 | 0.2415 | 0.2634 | 0.2820 | 0.3311 | 0.3416 | 0.3884 | 0.3905 | 0.4152 | 0.4297 | 0.4535 | 0.4419 | 20 |
| 南昌 | 0.2713 | 0.3123 | 0.3530 | 0.3637 | 0.3678 | 0.3740 | 0.3659 | 0.3906 | 0.4070 | 0.4074 | 0.4057 | 26 |
| 长江中游 | 0.2699 | 0.2936 | 0.3243 | 0.3578 | 0.3702 | 0.3938 | 0.4112 | 0.4291 | 0.4484 | 0.4686 | 0.4581 | |
| 成都 | 0.4168 | 0.3706 | 0.3970 | 0.4209 | 0.4859 | 0.5234 | 0.5461 | 0.5525 | 0.5071 | 0.5288 | 0.5232 | 7 |
| 重庆 | 0.4431 | 0.4152 | 0.4694 | 0.4764 | 0.4311 | 0.4530 | 0.4717 | 0.4931 | 0.4921 | 0.5141 | 0.5046 | 10 |
| 贵阳 | 0.2214 | 0.2684 | 0.2705 | 0.3210 | 0.3657 | 0.4276 | 0.3915 | 0.4456 | 0.4063 | 0.4336 | 0.4248 | 24 |
| 昆明 | 0.2401 | 0.2563 | 0.2880 | 0.3003 | 0.3314 | 0.3562 | 0.3694 | 0.3671 | 0.4075 | 0.3805 | 0.3887 | 27 |
| 西南 | 0.3304 | 0.3276 | 0.3562 | 0.3796 | 0.4035 | 0.4400 | 0.4447 | 0.4646 | 0.4533 | 0.4642 | 0.4603 | |
| 西宁 | 0.1767 | 0.2219 | 0.2161 | 0.2758 | 0.2905 | 0.3302 | 0.3444 | 0.3604 | 0.3749 | 0.3636 | 0.3671 | 31 |
| 兰州 | 0.0281 | 0.0439 | 0.0646 | 0.0934 | 0.1031 | 0.1590 | 0.1536 | 0.1777 | 0.1844 | 0.1796 | 0.1809 | 36 |
| 西北 | 0.1024 | 0.1329 | 0.1404 | 0.1846 | 0.1968 | 0.2446 | 0.2490 | 0.2690 | 0.2797 | 0.2716 | 0.2740 |
表4 分指标层的中国数字产业集群发展水平测度结果Tab.4 The measurement results of the development level of China's digital industry cluster by index level |
| 年份 | 集聚度 | 关联度 | 贡献度 | 支持度 |
|---|---|---|---|---|
| 2012 | 0.2581 | 0.3796 | 0.2494 | 0.1559 |
| 2013 | 0.2901 | 0.3965 | 0.2742 | 0.2197 |
| 2014 | 0.3105 | 0.3962 | 0.2823 | 0.2782 |
| 2015 | 0.3229 | 0.3993 | 0.3036 | 0.3710 |
| 2016 | 0.3274 | 0.4011 | 0.3206 | 0.4230 |
| 2017 | 0.3470 | 0.3992 | 0.3789 | 0.4759 |
| 2018 | 0.3456 | 0.4103 | 0.3984 | 0.5006 |
| 2019 | 0.3672 | 0.4241 | 0.4100 | 0.5372 |
| 2020 | 0.3711 | 0.3991 | 0.4212 | 0.5592 |
| 2021 | 0.3964 | 0.4109 | 0.4244 | 0.5881 |
| 总体水平 | 0.3850 | 0.4078 | 0.4220 | 0.5736 |
| 增长率(%) | 4.38 | 0.80 | 5.46 | 14.20 |
表5 中国数字产业集群发展水平的区域差异来源分解Tab.5 Source decomposition of regional differences in the development level of China's digital industry clusters |
| 年份 | 组内 贡献 | 贡献率 (%) | 组间 贡献 | 贡献率 (%) | 超变密度 贡献 | 贡献率 (%) |
|---|---|---|---|---|---|---|
| 2012 | 0.0223 | 10.83 | 0.0850 | 41.26 | 0.0989 | 47.91 |
| 2013 | 0.0237 | 11.65 | 0.0779 | 38.24 | 0.1021 | 50.11 |
| 2014 | 0.0217 | 11.36 | 0.0900 | 46.95 | 0.0800 | 41.70 |
| 2015 | 0.0197 | 11.46 | 0.0791 | 46.10 | 0.0728 | 42.44 |
| 2016 | 0.0179 | 11.41 | 0.0762 | 48.64 | 0.0626 | 39.96 |
| 2017 | 0.0163 | 11.53 | 0.0620 | 43.91 | 0.0629 | 44.56 |
| 2018 | 0.0175 | 11.40 | 0.0730 | 47.44 | 0.0633 | 41.16 |
| 2019 | 0.0173 | 11.52 | 0.0686 | 45.81 | 0.0639 | 42.66 |
| 2020 | 0.0169 | 11.72 | 0.0613 | 42.34 | 0.0665 | 45.94 |
| 2021 | 0.0165 | 11.56 | 0.0613 | 43.05 | 0.0646 | 45.39 |
| 均值 | 0.0190 | 11.44 | 0.0734 | 44.37 | 0.0738 | 44.18 |
表6 中国数字产业集群发展水平的马尔科夫转移概率矩阵Tab.6 Markov transition probability matrix of the development level of China's digital industry clusters |
| 邻近 类型 | 时间跨度 (年) | 数量 (个) | 本地所属类型 | ||||
|---|---|---|---|---|---|---|---|
| 低 | 中等 | 较高 | 高 | ||||
| 传统 | 1 | 88 | 0.7045 | 0.2841 | 0.0114 | 0.0000 | |
| 2 | 85 | 0.0353 | 0.6471 | 0.3059 | 0.0118 | ||
| 3 | 79 | 0.0000 | 0.0506 | 0.7215 | 0.2278 | ||
| 4 | 72 | 0.0000 | 0.0000 | 0.0417 | 0.9583 | ||
| 空间 | 低 | 1 | 24 | 0.8333 | 0.1667 | 0.0000 | 0.0000 |
| 2 | 6 | 0.0000 | 0.3333 | 0.5000 | 0.1667 | ||
| 3 | 4 | 0.0000 | 0.5000 | 0.2500 | 0.2500 | ||
| 4 | 5 | 0.0000 | 0.0000 | 0.0000 | 1.0000 | ||
| 中等 | 1 | 39 | 0.6154 | 0.3590 | 0.0256 | 0.0000 | |
| 2 | 28 | 0.0357 | 0.7143 | 0.2500 | 0.0000 | ||
| 3 | 12 | 0.0000 | 0.0000 | 0.6667 | 0.3333 | ||
| 4 | 17 | 0.0000 | 0.0000 | 0.0588 | 0.9412 | ||
| 较高 | 1 | 20 | 0.7000 | 0.3000 | 0.0000 | 0.0000 | |
| 2 | 41 | 0.0488 | 0.6098 | 0.3415 | 0.0000 | ||
| 3 | 47 | 0.0000 | 0.0213 | 0.7872 | 0.1915 | ||
| 4 | 44 | 0.0000 | 0.0000 | 0.0227 | 0.9773 | ||
| 高 | 1 | 5 | 0.8000 | 0.2000 | 0.0000 | 0.0000 | |
| 2 | 10 | 0.0000 | 0.8000 | 0.2000 | 0.0000 | ||
| 3 | 16 | 0.0000 | 0.0625 | 0.6875 | 0.2500 | ||
| 4 | 6 | 0.0000 | 0.0000 | 0.1667 | 0.8333 | ||
表7 中国数字产业集群发展水平的演变趋势预测Tab.7 Prediction of the evolution trend of the development level of China's digital industry cluster |
| 状态类型 | 邻近 类型 | 本地所属类型 | ||||
|---|---|---|---|---|---|---|
| 低 | 中等 | 较高 | 高 | |||
| 不考虑 空间滞后 | 初始状态 | 0.6944 | 0.1667 | 0.0833 | 0.0556 | |
| 终极状态 | 0.0028 | 0.0237 | 0.1495 | 0.8240 | ||
| 考虑 空间滞后 | 终极状态 | 低 | 0.0000 | 0.0000 | 0.0000 | 1.0000 |
| 中等 | 0.0000 | 0.0000 | 0.1500 | 0.8500 | ||
| 较高 | 0.0011 | 0.0066 | 0.1053 | 0.8871 | ||
| 高 | 0.0000 | 0.1111 | 0.3556 | 0.5333 | ||
| [1] |
习近平. 高举中国特色社会主义伟大旗帜为全面建设社会主义现代化国家而团结奋斗——在中国共产党第二十次全国代表大会上的报告[M]. 北京: 人民出版社, 2022.
|
| [2] |
中国信息通信研究院. 中国数字经济发展报告(2022年)[R/OL]. http://www.caict.ac.cn,2022-07-08.
|
| [3] |
陈梦根, 张鑫. 数字经济的统计挑战与核算思路探讨[J]. 改革, 2020(9):52-67.
|
| [4] |
潘为华, 贺正楚, 潘红玉. 中国数字经济发展的时空演化和分布动态[J]. 中国软科学, 2021(10):137-147.
|
| [5] |
赵涛, 张智, 梁上坤. 数字经济、创业活跃度与高质量发展——来自中国城市的经验证据[J]. 管理世界, 2020, 36(10):65-76.
|
| [6] |
许宪春, 张美慧. 中国数字经济规模测算研究——基于国际比较的视角[J]. 中国工业经济, 2020(5):23-41.
|
| [7] |
宋旭光, 何佳佳, 左马华青. 数字产业化赋能实体经济发展:机制与路径[J]. 改革, 2022(6):76-90.
|
| [8] |
周璇, 陶长琪. 要素空间集聚、制度质量对全要素生产率的影响研究[J]. 系统工程理论与实践, 2019, 39(4):1051-1066.
|
| [9] |
范剑勇, 刘念, 刘莹莹. 地理距离、投入产出关系与产业集聚[J]. 经济研究, 2021, 56(10):138-154.
|
| [10] |
王如玉, 梁琦, 李广乾. 虚拟集聚:新一代信息技术与实体经济深度融合的空间组织新形态[J]. 管理世界, 2018, 34(2):13-21.
|
| [11] |
刘烨, 王琦, 班元浩. 虚拟集聚、知识结构与中国城市创新[J]. 财贸经济, 2023, 44(4):89-105.
|
| [12] |
周海川, 刘帅, 孟山月. 打造具有国际竞争力的数字产业集群[J]. 宏观经济管理, 2023(7):27-32,48.
|
| [13] |
|
| [14] |
|
| [15] |
姚朝成. 打造数字产业集群的三个着力点[N]. 中国社会科学报,2023-03-15(003).
|
| [16] |
中国统计局. 数字经济及其核心产业统计分类(2021)[R/OL]. https://www.stats.gov.cn/sj/tjbz/gjtjbz/202302/t20230213_1902784.html,2021-05-27.
|
| [17] |
|
| [18] |
周灿, 曾刚, 曹贤忠. 中国城市创新网络结构与创新能力研究[J]. 地理研究, 2017, 36(7):1297-1308.
|
| [19] |
中国知识专利局. 数字经济核心产业分类与国际专利分类参照关系表(2023)[R/OL]. https://www.gov.cn/zhengce/zhengceku/2023-04/11/content_5750914.html,2023-03-20.
|
| [20] |
李彦龙, 毕钰. 城市创业活跃度:区域差异、动态演变与影响因素[J]. 中国软科学, 2023(5):99-106.
|
| [21] |
新华三集团. 城市数字化发展指数(2022)[R/OL]. http://deindex.h3c.com,2022-06-24.
|
| [22] |
吴磊, 张可云, 李贵才. 多样化联系空间与集群发展:基于“中观轨迹”的演化分析[J]. 中国软科学, 2021(4):71-81.
|
| [23] |
欧光军, 杨青, 雷霖. 国家高新区产业集群创新生态能力评价研究[J]. 科研管理, 2018, 39(8):63-71.
|
| [24] |
钟诗韵, 徐晔, 谭利. 双轮创新驱动对我国产业结构升级的影响[J]. 管理学刊, 2022, 35(1):70-85.
|
| [25] |
李宇, 唐蕾. “众乐乐”还是“独乐乐”?“有核”集群的双向技术溢出与集群创新绩效[J]. 南开管理评论, 2020, 23(2):39-50.
|
| [26] |
樊纲, 王小鲁, 马光荣. 中国市场化进程对经济增长的贡献[J]. 经济研究, 2011, 46(9):4-16.
|
| [27] |
郭峰, 王靖一, 王芳, 等. 测度中国数字普惠金融发展:指数编制与空间特征[J]. 经济学(季刊), 2020, 19(4):1401-1418.
|
| [28] |
邓宗兵, 何若帆, 陈钲, 等. 中国八大综合经济区生态文明发展的区域差异及收敛性研究[J]. 数量经济技术经济研究, 2020, 37(6):3-25.
|
| [29] |
李美娟, 刘佳鸿, 杨隆浩, 等. 基于相对熵距离的动态改进理想解法及其应用研究[J]. 系统科学与数学, 2023, 43(1):174-185.
|
| [30] |
易平涛, 周义, 郭亚军, 等. 一种体现发展趋势的动态综合评价方法[J]. 运筹与管理, 2016, 25(6):175-180.
|
| [31] |
李健旋. 制造业与数字经济产业关联融合测度及异质性研究[J/OL]. 中国管理科学:1-14[2024-01-24]. https://doi.org/10.16381/j.cnki.issn1003-207x.2022.2202.
|
| [32] |
徐晔, 赵金凤. 中国创新要素配置与经济高质量耦合发展的测度[J]. 数量经济技术经济研究, 2021, 38(10):46-64.
|
| [33] |
|
| [34] |
|
| [35] |
焦音学, 黄群慧. 中国数字经济均衡发展与亲贫性研究[J]. 财贸经济, 2023, 44(8):91-109.
|
| [36] |
|
| [37] |
丁煜, 陶长琪. 创新要素配置与数字经济耦合协调发展的时空特征及动态演进[J]. 统计与信息论坛, 2023, 38(11):47-61.
|
/
| 〈 |
|
〉 |