
省域生产性服务业嵌入制造业的空间网络特征及其影响因素
|
张军涛(1963—),男,教授,博士生导师,研究方向为城市与区域经济。E-mail:jtzhang001@163.com |
收稿日期: 2023-09-20
修回日期: 2024-04-09
网络出版日期: 2024-09-14
基金资助
教育部人文社会科学研究规划基金项目(22YJA790086)
国家自然科学基金项目(41571121)
Spatial Network Characteristics and Influencing Factors of Producer Services Industry Embedding in Manufacturing Industry at the Provincial Level
Received date: 2023-09-20
Revised date: 2024-04-09
Online published: 2024-09-14
张军涛 , 闫昱睿 . 省域生产性服务业嵌入制造业的空间网络特征及其影响因素[J]. 经济地理, 2024 , 44(5) : 134 -143 . DOI: 10.15957/j.cnki.jjdl.2024.05.014
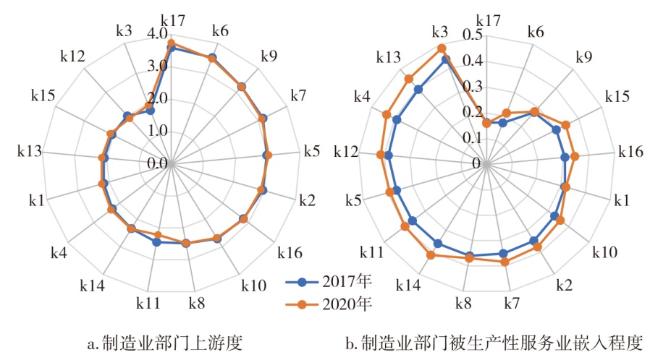
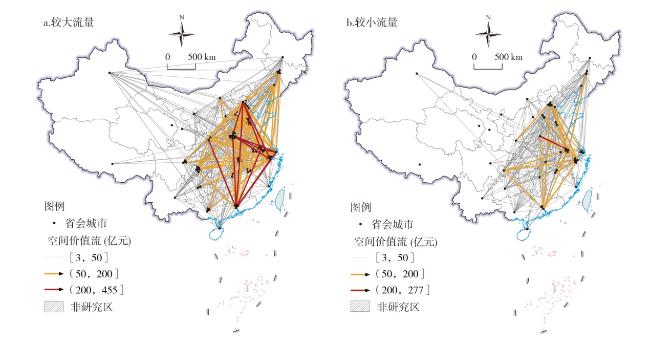
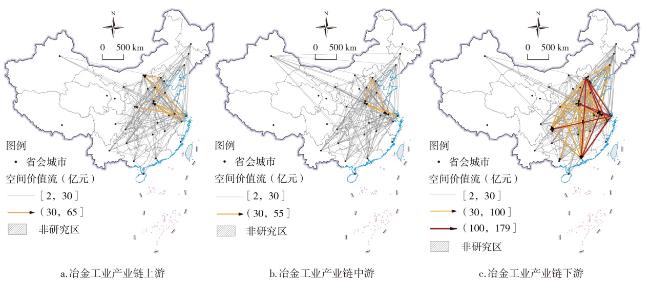
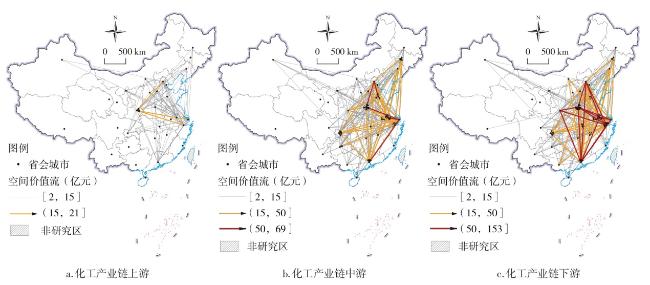
This paper uses the input-output method to measure the spatial value flow of producer services industry embedding in manufacturing industry of 31 provincial-level regions in China. According to the above, it constructs the spatial correlation network of producer services industry embedding in manufacturing industry and analyzes its network characteristics and influencing factors. The results indicate that: 1) Compared with 2017, the upstream index of each manufacturing sector remained basically stable in 2020,while the embeddedness of producer services industry in these manufacturing sectors increased significantly overall. 2) In 2017,the density of spatial correlation network showed a decreasing distribution pattern from the east of China to the west of China in sequence, larger spatial value flows mainly occurred between Beijing, Henan, Jiangsu, Zhejiang, Shanghai and Guangdong. The spatial correlation network of producer services industry embedding in the upstream,midstream,and downstream production links of metallurgical industry chain and chemical industry chain, which both presents a similar spatial pattern. 3) The geographical proximity between provincial-level regions can have a positive impact on the formation of spatial correlation networks. However,differences in the development level of digital economy, the technological innovation level and the transportation infrastructure level, the degree of marketization are not conducive to the formation of the spatial correlation network of producer services industry embedding in manufacturing industry.
表1 投入产出表的一般形式Tab.1 General form of input-output table |
| 投入/产出 | 中间使用 | 最终 使用 | 总产出 | ||||||
|---|---|---|---|---|---|---|---|---|---|
| 部门1 | 部门2 | … | 部门j | … | 部门n | ||||
| 中间投入 | 部门1 | x11 | x12 | … | x1j | … | x1n | F1 | Y1 |
| 部门2 | x21 | x22 | … | x2j | … | x2n | F2 | Y2 | |
| … | … | … | … | … | … | … | … | … | |
| 部门i | xi1 | xi2 | … | xij | … | xin | Fi | Yi | |
| … | … | … | … | … | … | … | … | … | |
| 部门n | xn1 | xn2 | … | xnj | … | xnn | Fn | Yn | |
| 初始投入 | A1 | A2 | … | Aj | … | An | |||
| 总投入 | Y1 | Y2 | … | Yj | … | Yn | |||
表2 制造业核心产业链Tab.2 Core industry chains of manufacturing industry |
| 产业链 | 生产环节 | 产业部门 |
|---|---|---|
| 冶金工业 产业链 | 上游 | 煤炭采选产品、金属矿采选产品、电力、热力的生产和供应 |
| 中游 | 金属冶炼和压延加工品 | |
| 下游 | 金属制品、通用设备、专用设备、交通运输设备、电气机械和器材、通信设备、计算机和其他电子设备、仪器仪表 | |
| 化工产业链 | 上游 | 石油和天然气开采产品、石油、炼焦产品和核燃料加工品 |
| 中游 | 化学产品 | |
| 下游 | 纺织品、纺织服装鞋帽皮革羽绒及其制品、木材加工品和家具、造纸印刷和文教体育用品、非金属矿物制品 |
图3 2017年生产性服务业嵌入冶金工业产业链的空间价值流网络格局Fig.3 Network pattern of the spatial value flow of producer services industry embedding in metallurgical industry chain in 2017 |
表3 生产性服务业嵌入制造业空间关联网络影响因素Tab.3 Influencing factors of the spatial correlation network of producer services industry embedding in manufacturing industry |
| 变量名称 | 变量含义 | 计算方法 | 数据来源 |
|---|---|---|---|
| Bor | 地理邻近性 | 省份间的地理邻接矩阵 | GeoDa软件获取 |
| Dig | 数字经济发展水平差异 | 省份间数字经济创新创业指数差值关系矩阵 | 北大企业大数据研究中心 |
| Tec | 技术创新水平差异 | 省份间人均三大专利授权量差值关系矩阵 | 中国统计年鉴 |
| Tra | 交通基础设施水平差异 | 省份间每平方公里高速公路运营里程的差值关系矩阵 | 中国统计年鉴 |
| Mar | 市场化程度差异 | 省份间市场化总指数的差值关系矩阵 | 中国分省份市场化指数数据库 |
| Ope | 对外开放程度差异 | 省份间外商直接投资占GDP比重的差值关系矩阵 | 中国统计年鉴 |
| Agg | 经济集聚程度差异 | 省份间每平方公里劳动力人数的差值关系矩阵 | 中国统计年鉴 |
表4 生产性服务业嵌入制造业空间关联网络影响因素的QAP回归结果Tab.4 QAP regression results of the influencing factors of the spatial correlation network of producer services industry embedding in manufacturing industry |
| 变量 | 2012年 | 2017年 | |||||
|---|---|---|---|---|---|---|---|
| 非标准化回归系数 | 标准化回归系数 | 显著性概率 | 非标准化回归系数 | 标准化回归系数 | 显著性概率 | ||
| Bor | 0.182 | 0.118 | 0.003 | 0.185 | 0.119 | 0.006 | |
| Dig | -0.339 | -0.108 | 0.016 | -0.396 | -0.125 | 0.009 | |
| Tec | -0.150 | -0.237 | 0.015 | -0.119 | -0.181 | 0.009 | |
| Tra | -0.114 | -0.176 | 0.021 | -0.077 | -0.116 | 0.066 | |
| Mar | -0.583 | -0.372 | 0.010 | -0.676 | -0.219 | 0.007 | |
| Ope | -0.880 | -0.052 | 0.430 | -0.955 | -0.056 | 0.387 | |
| Agg | -0.202 | -0.119 | 0.513 | 0.107 | 0.205 | 0.759 | |
| 调整R2 | 0.287 | 0.302 | |||||
| 观察值 | 930 | 930 | |||||
| [1] |
刘志彪. 全国统一大市场[J]. 经济研究, 2022(5):13-22.
|
| [2] |
|
| [3] |
|
| [4] |
|
| [5] |
|
| [6] |
郝大江, 初天天. 投入服务化的双重效应与中国制造业价值链攀升[J]. 社会科学研究, 2023(5):63-73.
|
| [7] |
刘奕, 夏杰长, 李垚. 生产性服务业集聚与制造业升级[J]. 中国工业经济, 2017(7):24-42.
|
| [8] |
|
| [9] |
韩峰, 阳立高. 生产性服务业集聚如何影响制造业结构升级?——一个集聚经济与熊彼特内生增长理论的综合框架[J]. 管理世界, 2020 (2):72-94,219.
|
| [10] |
刘明宇, 芮明杰, 姚凯. 生产性服务价值链嵌入与制造业升级的协同演进关系研究[J]. 中国工业经济, 2010(8):66-75.
|
| [11] |
孙正, 杨素, 刘瑾瑜. 我国生产性服务业与制造业协同融合程度测算及其决定因素研究[J]. 中国软科学, 2021(7):31-39.
|
| [12] |
|
| [13] |
|
| [14] |
唐晓华, 张欣钰, 李阳. 制造业与生产性服务业协同发展对制造效率影响的差异性研究[J]. 数量经济技术经济研究, 2018, 35(3):59-77.
|
| [15] |
|
| [16] |
张虎, 韩爱华, 杨青龙. 中国制造业与生产性服务业协同集聚的空间效应分析[J]. 数量经济技术经济研究, 2017, 34(2):3-20.
|
| [17] |
崔书会, 李光勤, 豆建民. 产业协同集聚的资源错配效应研究[J]. 统计研究, 2019, 36(2):76-87.
|
| [18] |
乌云图, 陶克涛, 彭俊超. 产业协同集聚、数字技术支持与资源错配[J]. 科研管理, 2023, 44(1):125-135.
|
| [19] |
汤长安, 邱佳炜, 张丽家, 等. 要素流动、产业协同集聚对区域经济增长影响的空间计量分析——以制造业与生产性服务业为例[J]. 经济地理, 2021, 41(7):146-154.
|
| [20] |
于明远, 范爱军. 生产性服务嵌入与中国制造业国际竞争力提升[J]. 当代经济科学, 2019, 41(2):88-96.
|
| [21] |
刘慧, 陈晓华, 蒋墨冰. 生产性服务资源嵌入制造业生产环节的最优选择——基于中间投入品出口技术复杂度升级视角[J]. 财经研究, 2020, 46(7):154-168.
|
| [22] |
唐晓华, 张欣珏, 李阳. 中国制造业与生产性服务业动态协调发展实证研究[J]. 经济研究, 2018 (3):79-93.
|
| [23] |
张虎, 韩爱华. 制造业与生产性服务业耦合能否促进空间协调——基于285个城市数据的检验[J]. 统计研究, 2019, 36(1):39-50.
|
| [24] |
|
| [25] |
黄莉芳. 中国生产性服务业嵌入制造业关系研究——基于投入产出表的实证分析[J]. 中国经济问题, 2011(1):28-37.
|
| [26] |
|
| [27] |
李冠霖. 第三产业投入产出分析——从投入产出的角度看第三产业的产业关联与产业波及特性[M]. 北京: 中国物价出版社, 2002.
|
| [28] |
|
| [29] |
|
| [30] |
石敏俊, 孙艺文, 王琛, 等. 基于产业链空间网络的京津冀城市群功能协同分析[J]. 地理研究, 2022, 41(12):3143-3163.
|
| [31] |
席强敏, 陈曦, 李国平. 中国城市生产性服务业模式选择研究——以工业效率提升为导向[J]. 中国工业经济, 2015(2):18-30.
|
| [32] |
|
| [33] |
陈仕华, 马超. 企业间高管联结与慈善行为一致性——基于汶川地震后中国上市公司捐款的实证研究[J]. 管理世界, 2011(12):87-95.
|
/
| 〈 |
|
〉 |