
市域尺度上市企业数字化转型演变及对碳排放影响
|
张悦(1997—),女,博士研究生,研究方向为经济地理与区域可持续发展。E-mail:zhangyuesdnu@foxmail.com |
收稿日期: 2023-09-20
修回日期: 2024-03-10
网络出版日期: 2024-09-14
基金资助
国家自然科学基金项目(42371194)
Evolution of Digital Transformation of Listed Companies at the Prefecture Level and Its Impact on Carbon Emissions
Received date: 2023-09-20
Revised date: 2024-03-10
Online published: 2024-09-14
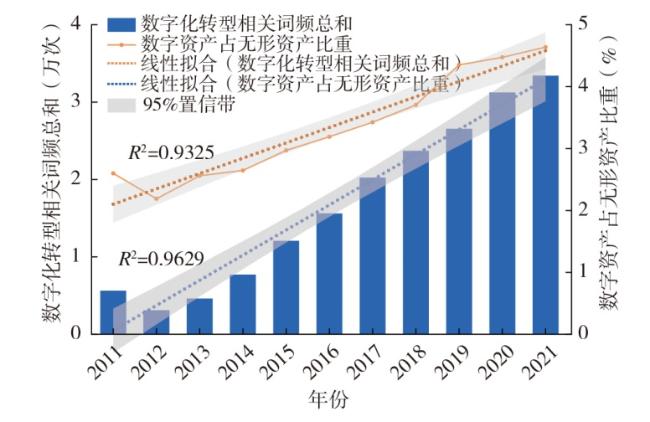
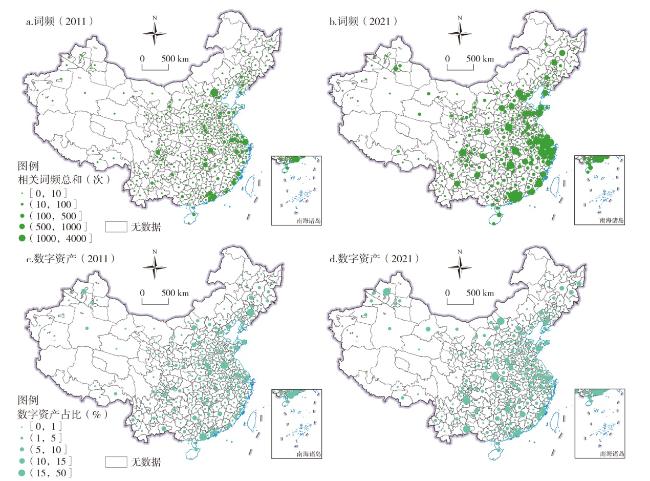
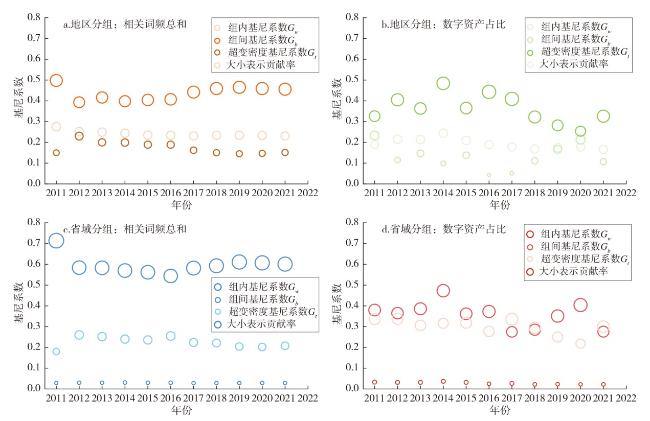
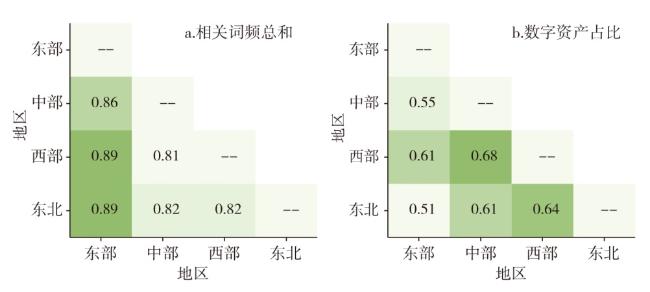
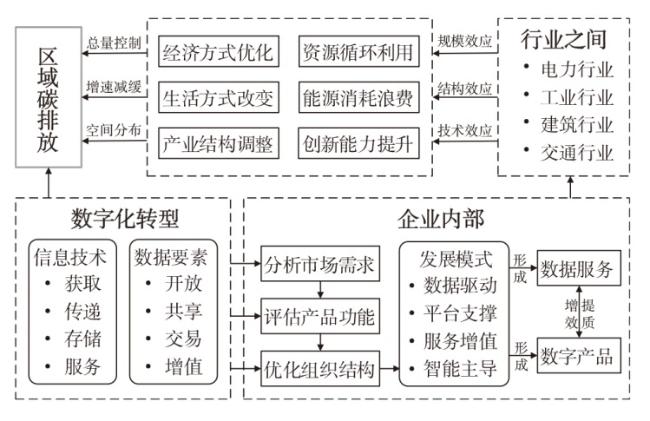
文章借助中国A股上市公司数据,利用数字化转型相关词频总和、数字资产占无形资产比重衡量企业数字化转型,运用Dagum基尼系数和空间杜宾模型等揭示了其时空特征及对城市碳排放量的作用机理。研究发现:①城市企业数字化转型整体稳步发展,数字化转型相关词频总和从2011年的0.563万次增加至2021年的3.342万次,数字资产占无形资产比重相应从2.60%提升至4.64%。②胡焕庸线东部地区数字化转型水平高于西部地区,区域之间差距明显大于区域内部差距,其中西部地区内部差异最大。总体差异呈现减小趋势,空间集聚效应较弱但不断提升,加速向京津冀、长三角、珠三角等城市群集聚。③企业数字化转型对城市碳排放量存在显著抑制作用和空间溢出效应,主要通过企业内部与产业融合两个方面实现结构优化、资源整合、效率提升、效益增加和碳排减少,不同地区、不同经济聚集区域的碳减排效应具有异质性。文章从数字技术应用、适宜转型方式、长效激励机制、区域协调发展等方面提出对策建议,对促进数字化转型及降碳效应具有一定的借鉴参考意义。
张悦 , 来逢波 , 程钰 . 市域尺度上市企业数字化转型演变及对碳排放影响[J]. 经济地理, 2024 , 44(5) : 106 -116 . DOI: 10.15957/j.cnki.jjdl.2024.05.011
Based on the data of Chinese A-share listed companies,this paper measures enterprise digital transformation by using the total number of digital transformation-related word frequencies of enterprise and the proportion of digital assets in intangible assets,and analyzes its spatiotemporal characteristics as well as its impact on carbon emissions applying the Dagum's Gini coefficient and the spatial Durbin model. The study finds that: 1) The digital transformation of urban enterprises has been developing steadily,with the total number of digital transformation-related word frequencies increasing from 5630 times in 2011 to 33420 times in 2021,and the proportion of digital assets increasing from 2.60% to 4.64%. 2) Digital transformation level is higher in the eastern region of the Hu Line than that in the western region of the Hu Line,and the gap between regions is significantly larger than the gap within regions,of which the difference within the western region is the largest,and the overall difference shows a decreasing trend. The spatial agglomeration effect is weak but rising,accelerating the spatial agglomeration phenomenon in Beijing-Tianjin-Hebei,Yangtze River Delta and Pearl River Delta and other urban agglomerations. 3) Digital transformation of enterprises has significant inhibition and spatial spillover effects on urban carbon emissions,mainly through the two aspects of enterprise internal and industrial integration,to achieve structural optimization,resource integration,efficiency enhancement,benefit increase and carbon emission reduction. The carbon emission reduction effect in different regions and different economic agglomeration areas is characterized by heterogeneity. This paper puts forward countermeasures and suggestions in terms of application of digital technology,appropriate transformation methods,long-term incentive mechanism,and coordinated regional development,which are useful references for promoting enterprise digital transformation and its carbon emission reduction effect.
Key words: listed companies; digital transformation; text data; carbon emission
表1 基准回归结果Tab.1 Benchmark regression results |
| (1) RE | (2) IND | (3) TIME | (4) BOTH | (5) RE | (6) IND | (7) TIME | (8) BOTH | |
|---|---|---|---|---|---|---|---|---|
| DT | -0.2630*** | -0.2790*** | -0.1791** | -0.1865** | 0.3076 | 0.4857 | -4.9137** | -4.6612* |
| (-3.20) | (-3.36) | (-2.19) | (-2.24) | (0.12) | (0.19) | (-1.97) | (-1.87) | |
| EC | 0.0439*** | 0.0471*** | 0.0231** | 0.0249*** | 0.0220*** | 0.0227*** | 0.0132*** | 0.0138*** |
| (4.90) | (5.14) | (2.46) | (2.58) | (7.75) | (7.98) | (4.55) | (4.72) | |
| MAR | -0.2042 | -0.1783 | -0.2391 | -0.2213 | -0.5127*** | -0.5081*** | -0.4884*** | -0.4838*** |
| (-0.64) | (-0.56) | (-0.76) | (-0.71) | (-3.70) | (-3.68) | (-3.65) | (-3.62) | |
| INT | -0.0633 | -0.0715 | -0.2189*** | -0.2197*** | -0.0848** | -0.0886*** | -0.2121*** | -0.2130*** |
| (-0.85) | (-0.95) | (-2.74) | (-2.75) | (-2.48) | (-2.59) | (-5.88) | (-5.91) | |
| POP | -0.0008 | -0.0005 | 0.0036 | 0.0039 | -0.0003 | -0.0006 | 0.0020 | 0.0018 |
| (-0.12) | (-0.07) | (0.54) | (0.59) | (-0.09) | (-0.17) | (0.65) | (0.57) | |
| _cons | 730.4897*** | 728.2829*** | 692.8794*** | 565.1563*** | 669.8518*** | 651.5588*** | 644.2383*** | 699.5558*** |
| (7.05) | (23.53) | (6.59) | (3.02) | (10.78) | (49.76) | (10.31) | (9.26) | |
| 个体控制 | NO | YES | NO | YES | NO | YES | NO | YES |
| 时间控制 | NO | NO | YES | YES | NO | NO | YES | YES |
| R2 | 0.0149 | 0.0150 | 0.0597 | 0.9743 | 0.0362 | 0.0362 | 0.1152 | 0.9855 |
| sigma | 277.3193 | 277.3193 | 271.6007 | 271.6007 | 126.6785 | 126.6785 | 121.6925 | 121.6925 |
表2 稳健性检验结果Tab.2 Robustness test results |
| (1) | (2) | (3) | (4) | (5) | (6) | (7) | (8) | |
|---|---|---|---|---|---|---|---|---|
| DT1 | 1.8054*** | -101.2*** | -87.4640*** | -7.0031* | ||||
| (6.38) | (-3.11) | (-4.03) | (-1.85) | |||||
| DT2 | 38.1054** | -15.80* | -11.3243** | -4.3701* | ||||
| (2.23) | (-1.92) | (-2.11) | (-1.74) | |||||
| Controls | YES | YES | YES | YES | YES | YES | YES | YES |
| 个体控制 | YES | YES | NO | NO | NO | NO | YES | YES |
| 时间控制 | YES | YES | NO | NO | NO | NO | YES | YES |
| R2 | 0.9096 | 0.9080 | 0.8238 | 0.5967 | 0.0360 | 0.0557 | 0.9858 | 0.9856 |
| sigma | 1390.8601 | 1472.068 | - | - | - | - | 119.0211 | 121.6121 |
表3 空间杜宾面板模型回归结果Tab.3 Regression results of the spatial Durbin panel model |
| DT1 | DT2 | EC | MAR | INT | POP | |
|---|---|---|---|---|---|---|
| Main | -0.3596***(-13.81) | 0.2661***(3.91) | -0.0807***(-4.35) | -0.1094***(-4.92) | 0.0808**(2.37) | |
| Wx | -0.0893***(-3.21) | 0.2594***(3.57) | -0.0701***(-3.99) | 0.1223***(4.08) | -0.0468(-1.01) | |
| Direct | -0.3615***(-13.54) | 0.2698***(4.03) | -0.0807***(-4.54) | -0.1068***(-5.04) | 0.0797**(2.38) | |
| Indirect | -0.1098***(-3.94) | 0.2798***(3.62) | -0.0772***(-4.55) | 0.1223***(3.98) | -0.0462(-0.98) | |
| Total | -0.4713***(-11.74) | 0.5495***(5.29) | -0.1579***(-6.58) | 0.0155(0.40) | 0.0334(0.57) | |
| Main | -0.0072**(-2.20) | -0.1677***(-2.69) | -0.0926***(-4.84) | -0.1147***(-5.00) | 0.1289***(3.69) | |
| Wx | -0.0071**(-2.13) | 0.1107*(1.66) | -0.0623***(-3.42) | 0.1532***(4.96) | -0.0840*(-1.77) | |
| Direct | -0.0074**(-2.18) | -0.1665***(-2.77) | -0.0932***(-5.08) | -0.1097***(-5.00) | 0.1259***(3.69) | |
| Indirect | -0.0078**(-2.24) | 0.1031(1.43) | -0.0729***(-4.05) | 0.1532***(4.75) | -0.0802(-1.63) | |
| Total | -0.0152***(-2.89) | -0.0634(-0.66) | -0.1661***(-6.54) | 0.0434(1.05) | 0.0458(0.75) |
| [1] |
刘文俊, 彭慧. 区域制造企业数字化转型影响绿色全要素生产率的空间效应[J]. 经济地理, 2023, 43(6):33-44.
|
| [2] |
|
| [3] |
裴璇, 刘宇, 王稳华. 企业数字化转型:驱动因素、经济效应与策略选择[J]. 改革, 2023, 36(5):124-137.
|
| [4] |
姚小涛, 亓晖, 刘琳琳, 等. 企业数字化转型:再认识与再出发[J]. 西安交通大学学报:社会科学版, 2022, 42(3):1-9.
|
| [5] |
吴非, 胡慧芷, 林慧妍, 等. 企业数字化转型与资本市场表现——来自股票流动性的经验证据[J]. 管理世界, 2021, 37(7):130-144,10.
|
| [6] |
张永珅, 李小波, 邢铭强. 企业数字化转型与审计定价[J]. 审计研究, 2021, 37(3):62-71.
|
| [7] |
|
| [8] |
|
| [9] |
张永姣, 丁少斌, 方创琳. 中国数字经济产业发展的时空分异及空间收敛性分析——基于企业大数据的考察[J]. 经济地理, 2023, 43(3):120-130.
|
| [10] |
沈丽珍, 强靖淇, 汪侠, 等. 浙江省数字技术应用业空间集聚演化特征——基于微观企业数据[J]. 经济地理, 2023, 43(7):151-160.
|
| [11] |
孙勇, 樊杰, 刘汉初, 等. 长三角地区数字技术创新时空格局及其影响因素[J]. 经济地理, 2022, 42(2):124-133.
|
| [12] |
金春枝, 李伦. 我国互联网数字鸿沟空间分异格局研究[J]. 经济地理, 2016, 36(8):106-112.
|
| [13] |
徐宁, 白英杰, 张迪. 股权激励如何助力企业数字化转型?——基于上市公司年报的文本挖掘分析[J]. 财经论丛, 2023, 39(7):89-101.
|
| [14] |
秦喜亮, 田虹. 期望业绩差距、管理者决策与企业数字化转型[J]. 科学决策, 2023, 30(7):82-98.
|
| [15] |
李成明, 周迪, 董志勇. 资本市场开放推动企业数字化转型了吗?——基于准自然实验和文本分析方法[J]. 统计研究, 2023, 40(8):96-109.
|
| [16] |
王超, 余典范, 龙睿. 经济政策不确定性与企业数字化——垫脚石还是绊脚石 ?[J]. 经济管理, 2023, 45(6):79-100.
|
| [17] |
唐健雄, 李春艳, 孙桥, 等. 基于扎根理论的酒店数字化转型影响因素研究[J]. 人文地理, 2022, 37(3):151-162.
|
| [18] |
|
| [19] |
|
| [20] |
杨白冰, 杨子明, 郭迎锋. 企业数字化转型中的就业结构效应——基于制造业上市企业年报文本挖掘的实证分析[J]. 中国软科学, 2023, 38(4):141-150.
|
| [21] |
尤碧莹, 郑明贵, 胡志亮, 等. 数字化转型对资源型企业全要素生产率的影响[J]. 资源科学, 2023, 45(3):536-548.
|
| [22] |
刘强, 马彦瑞, 徐生霞. 数字经济发展是否提高了中国绿色经济效率?[J]. 中国人口·资源与环境, 2022, 32(3):72-85.
|
| [23] |
|
| [24] |
张建伟, 王艳华, 翟蕴芝, 等. 豫赣湘皖承接产业转移与创新产出的空间变系数计量分析[J]. 湖南师范大学自然科学学报, 2023, 46(5):100-107.
|
| [25] |
邬晓燕. 数字化赋能生态文明转型的难题与路径[J]. 人民论坛, 2022, 31(6):60-62.
|
| [26] |
徐维祥, 周建平, 刘程军. 数字经济发展对城市碳排放影响的空间效应[J]. 地理研究, 2022, 41(1):111-129.
|
| [27] |
王元彬, 张尧, 李计广. 数字金融与碳排放:基于微观数据和机器学习模型的研究[J]. 中国人口·资源与环境, 2022, 32(6):1-11.
|
| [28] |
张亚豪, 金殿臣, 曾昭睿. 工业数字化的减碳效应检验[J]. 统计与决策, 2022, 38(24):49-52.
|
| [29] |
刘长生, 陈昀, 简玉峰, 等. 中国旅游产业发展间接就业带动能力测算及其时空差异[J]. 地理学报, 2022, 77(4):918-935.
|
| [30] |
李正昕, 徐维祥, 刘程军. 长三角县域三次产业协调发展的空间特征及动力机制[J]. 经济地理, 2021, 41(3):136-143.
|
| [31] |
邓祥征, 蒋思坚, 李星, 等. 区域土地利用影响地表CO2浓度异质性特征的动力学机制[J]. 地理学报, 2022, 77(4):936-946.
|
| [32] |
何帆, 刘红霞. 数字经济视角下实体企业数字化变革的业绩提升效应评估[J]. 改革, 2019, 32(4):137-148.
|
| [33] |
肖土盛, 孙瑞琦, 袁淳, 等. 企业数字化转型、人力资本结构调整与劳动收入份额[J]. 管理世界, 2022, 38(12):220-237.
|
/
| 〈 |
|
〉 |