
中国地理标志产品的区域差异分解及空间收敛性
|
李春艳(1995—),女,博士研究生,研究方向为地理标志。E-mail:tjlcy0101@163.com |
收稿日期: 2023-12-10
修回日期: 2024-03-25
网络出版日期: 2024-09-13
基金资助
国家社会科学基金重大项目(16ZDA236)
上海市浦江人才计划项目(22PJC113)
上海市科技创新行动计划软科学研究项目(23692116300)
Regional Difference Decomposition and Spatial Convergence of Geographical Indication Products in China
Received date: 2023-12-10
Revised date: 2024-03-25
Online published: 2024-09-13
李春艳 , 廖凯诚 , 姜磊 . 中国地理标志产品的区域差异分解及空间收敛性[J]. 经济地理, 2024 , 44(7) : 186 -196 . DOI: 10.15957/j.cnki.jjdl.2024.07.019
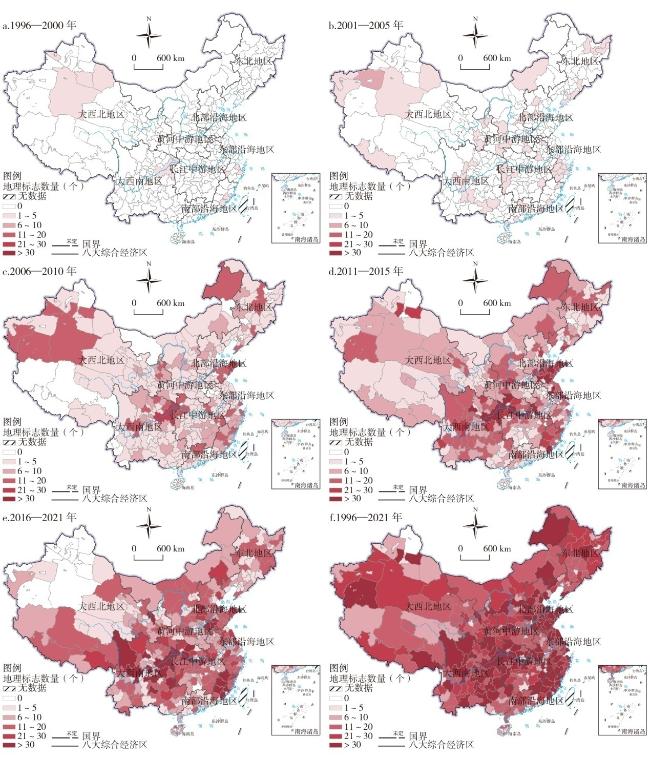
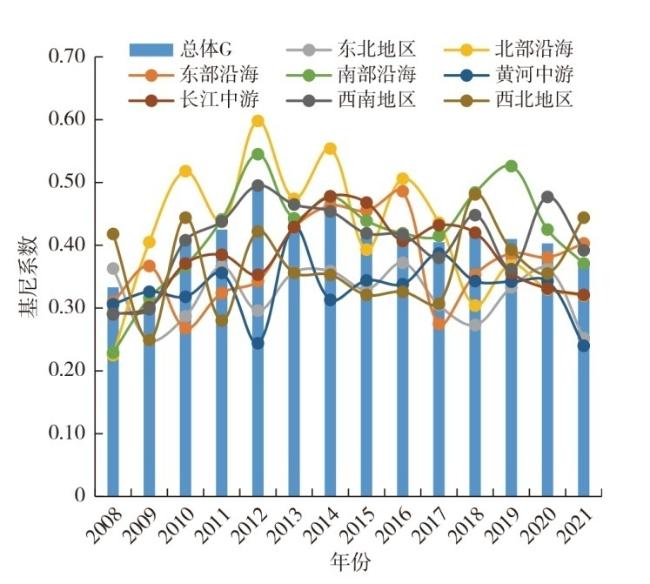
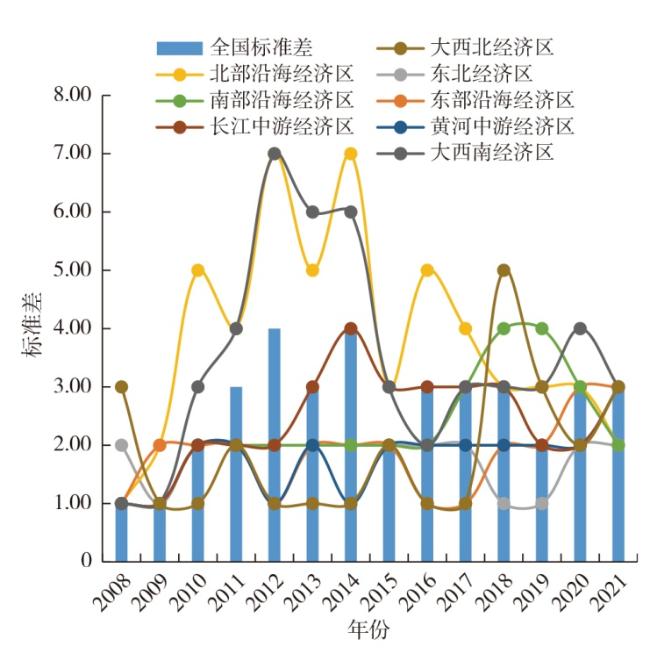
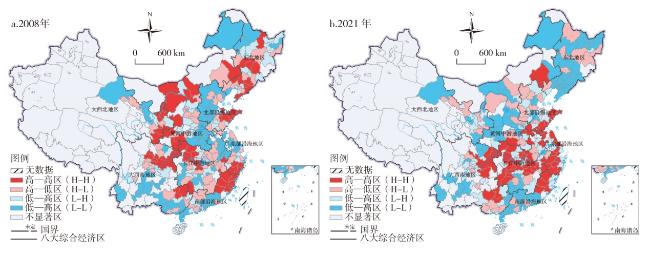
Based on the panel data of geographical indication (GI) products in 1996-2021 at the prefecture level,this article analyzes the spatiotemporal distribution characteristics of the GI products,uses the Dagum Gini coefficient decomposition method to characterize the regional differences and evolutionary trends of GI products,tests its σ-convergence and β-convergence by the means of the standard deviation and the spatial panel model. The results indicate that: 1) The core areas of GI products in Chinese cities has completed the dynamic transfer from the northwest of China to the southeast of China,and has formed a dense gathering zone. 2) The overall differences among cities show a fluctuating trend of "upward and subsequent downward movement." Inter-group differences represent a significant source of overall variation. 3) Among the eight major economic zones,only the northwestern economic zone shows σ-convergence. There is significant absolute β-convergence and conditional β-convergence in China and eight economic regions. It is different in terms of resource endowment,economic development level,and other conditions in different city. The impact of exogenous factors on the development of GI products is also different.
表1 八大经济区城市地理标志产品数量的组间差异Tab.1 Inter-group difference of geographical product quantity in eight economic zones |
| 组间 | 2008 | 2009 | 2010 | 2011 | 2012 | 2013 | 2014 | 2015 | 2016 | 2017 | 2018 | 2019 | 2020 | 2021 | 均值 | 年均增长率(%) |
|---|---|---|---|---|---|---|---|---|---|---|---|---|---|---|---|---|
| 1和2 | 0.315 | 0.339 | 0.472 | 0.436 | 0.550 | 0.447 | 0.526 | 0.403 | 0.467 | 0.417 | 0.336 | 0.405 | 0.371 | 0.320 | 0.415 | 0.13 |
| 1和3 | 0.346 | 0.325 | 0.285 | 0.364 | 0.317 | 0.395 | 0.436 | 0.410 | 0.432 | 0.305 | 0.306 | 0.391 | 0.399 | 0.360 | 0.362 | 0.30 |
| 1和4 | 0.318 | 0.284 | 0.334 | 0.408 | 0.498 | 0.400 | 0.423 | 0.402 | 0.405 | 0.387 | 0.437 | 0.481 | 0.407 | 0.336 | 0.394 | 0.44 |
| 1和5 | 0.334 | 0.309 | 0.311 | 0.364 | 0.282 | 0.402 | 0.341 | 0.342 | 0.353 | 0.372 | 0.318 | 0.344 | 0.350 | 0.248 | 0.334 | -2.27 |
| 1和6 | 0.326 | 0.281 | 0.345 | 0.380 | 0.332 | 0.408 | 0.462 | 0.450 | 0.401 | 0.396 | 0.375 | 0.354 | 0.348 | 0.312 | 0.369 | -0.35 |
| 1和7 | 0.336 | 0.280 | 0.377 | 0.420 | 0.458 | 0.436 | 0.434 | 0.406 | 0.410 | 0.377 | 0.416 | 0.393 | 0.457 | 0.375 | 0.398 | 0.87 |
| 1和8 | 0.400 | 0.264 | 0.396 | 0.367 | 0.363 | 0.364 | 0.360 | 0.330 | 0.355 | 0.307 | 0.412 | 0.392 | 0.362 | 0.377 | 0.361 | -0.45 |
| 2和3 | 0.271 | 0.389 | 0.471 | 0.46 | 0.582 | 0.476 | 0.529 | 0.434 | 0.508 | 0.447 | 0.360 | 0.387 | 0.355 | 0.382 | 0.432 | 2.68 |
| 2和4 | 0.241 | 0.371 | 0.498 | 0.456 | 0.586 | 0.484 | 0.547 | 0.426 | 0.471 | 0.431 | 0.409 | 0.464 | 0.393 | 0.352 | 0.438 | 2.96 |
| 2和5 | 0.281 | 0.384 | 0.472 | 0.441 | 0.563 | 0.470 | 0.531 | 0.393 | 0.438 | 0.416 | 0.351 | 0.385 | 0.370 | 0.330 | 0.416 | 1.24 |
| 2和6 | 0.270 | 0.355 | 0.480 | 0.445 | 0.541 | 0.457 | 0.519 | 0.442 | 0.455 | 0.443 | 0.397 | 0.388 | 0.339 | 0.326 | 0.418 | 1.45 |
| 2和7 | 0.290 | 0.349 | 0.474 | 0.463 | 0.560 | 0.483 | 0.515 | 0.416 | 0.457 | 0.405 | 0.403 | 0.367 | 0.433 | 0.368 | 0.427 | 1.84 |
| 2和8 | 0.367 | 0.333 | 0.495 | 0.477 | 0.573 | 0.465 | 0.540 | 0.395 | 0.467 | 0.419 | 0.396 | 0.387 | 0.378 | 0.379 | 0.434 | 0.24 |
| 3和4 | 0.284 | 0.352 | 0.338 | 0.400 | 0.543 | 0.438 | 0.479 | 0.450 | 0.456 | 0.415 | 0.475 | 0.477 | 0.416 | 0.401 | 0.423 | 2.69 |
| 3和5 | 0.308 | 0.356 | 0.308 | 0.350 | 0.288 | 0.431 | 0.436 | 0.398 | 0.401 | 0.389 | 0.351 | 0.373 | 0.386 | 0.354 | 0.366 | 1.08 |
| 3和6 | 0.301 | 0.338 | 0.347 | 0.370 | 0.356 | 0.433 | 0.476 | 0.469 | 0.438 | 0.419 | 0.409 | 0.378 | 0.355 | 0.368 | 0.390 | 1.56 |
| 3和7 | 0.318 | 0.338 | 0.377 | 0.416 | 0.484 | 0.460 | 0.464 | 0.432 | 0.444 | 0.392 | 0.442 | 0.377 | 0.453 | 0.412 | 0.415 | 2.00 |
| 3和8 | 0.390 | 0.316 | 0.395 | 0.310 | 0.397 | 0.394 | 0.450 | 0.397 | 0.421 | 0.307 | 0.461 | 0.392 | 0.406 | 0.429 | 0.390 | 0.72 |
| 4和5 | 0.288 | 0.341 | 0.346 | 0.394 | 0.520 | 0.435 | 0.411 | 0.391 | 0.383 | 0.400 | 0.436 | 0.440 | 0.385 | 0.340 | 0.394 | 1.30 |
| 4和6 | 0.274 | 0.310 | 0.375 | 0.411 | 0.491 | 0.438 | 0.486 | 0.465 | 0.414 | 0.429 | 0.463 | 0.443 | 0.372 | 0.343 | 0.408 | 1.74 |
| 4和7 | 0.271 | 0.306 | 0.402 | 0.442 | 0.528 | 0.464 | 0.463 | 0.428 | 0.420 | 0.393 | 0.466 | 0.434 | 0.462 | 0.389 | 0.419 | 2.82 |
| 4和8 | 0.378 | 0.294 | 0.427 | 0.397 | 0.538 | 0.399 | 0.428 | 0.390 | 0.398 | 0.389 | 0.485 | 0.471 | 0.410 | 0.407 | 0.415 | 0.57 |
| 5和6 | 0.301 | 0.323 | 0.349 | 0.372 | 0.327 | 0.433 | 0.466 | 0.435 | 0.383 | 0.412 | 0.389 | 0.350 | 0.346 | 0.317 | 0.372 | 0.40 |
| 5和7 | 0.315 | 0.328 | 0.381 | 0.409 | 0.467 | 0.454 | 0.432 | 0.398 | 0.396 | 0.385 | 0.419 | 0.386 | 0.433 | 0.382 | 0.399 | 1.49 |
| 5和8 | 0.374 | 0.287 | 0.396 | 0.349 | 0.351 | 0.405 | 0.336 | 0.336 | 0.336 | 0.371 | 0.417 | 0.373 | 0.349 | 0.378 | 0.361 | 0.09 |
| 6和7 | 0.303 | 0.303 | 0.397 | 0.421 | 0.459 | 0.454 | 0.475 | 0.445 | 0.415 | 0.408 | 0.444 | 0.386 | 0.412 | 0.364 | 0.406 | 1.42 |
| 6和8 | 0.370 | 0.282 | 0.414 | 0.372 | 0.387 | 0.416 | 0.473 | 0.44 | 0.395 | 0.399 | 0.451 | 0.379 | 0.350 | 0.367 | 0.392 | -0.06 |
| 7和8 | 0.388 | 0.294 | 0.425 | 0.421 | 0.486 | 0.44 | 0.442 | 0.399 | 0.408 | 0.376 | 0.462 | 0.379 | 0.461 | 0.412 | 0.414 | 0.46 |
注:1、2、3、4、5、6、7、8分别代表东北地区经济区、北部沿海经济区、东部沿海经济区、南部沿海经济区、黄河中游经济区、长江中游经济区、大西南经济区和大西北经济区。 |
表2 地理标志产品区域差异的来源分解及贡献Tab.2 Source decomposition and contribution of regional differences of GI products |
| 年份 | Gw | Grb | Gt | |||||
|---|---|---|---|---|---|---|---|---|
| 贡献值 | 贡献率 (%) | 贡献值 | 贡献率 (%) | 贡献值 | 贡献率 (%) | |||
| 2008 | 0.042 | 12.747 | 0.153 | 45.831 | 0.138 | 41.421 | ||
| 2009 | 0.039 | 11.807 | 0.183 | 55.777 | 0.106 | 32.416 | ||
| 2010 | 0.051 | 12.377 | 0.188 | 45.637 | 0.173 | 41.986 | ||
| 2011 | 0.051 | 11.906 | 0.245 | 57.663 | 0.129 | 30.431 | ||
| 2012 | 0.059 | 11.951 | 0.288 | 57.887 | 0.150 | 30.161 | ||
| 2013 | 0.058 | 12.910 | 0.215 | 48.167 | 0.173 | 38.923 | ||
| 2014 | 0.059 | 12.231 | 0.257 | 53.598 | 0.164 | 34.171 | ||
| 2015 | 0.055 | 12.930 | 0.187 | 44.289 | 0.181 | 42.781 | ||
| 2016 | 0.054 | 12.674 | 0.200 | 47.081 | 0.171 | 40.246 | ||
| 2017 | 0.053 | 12.977 | 0.229 | 56.531 | 0.124 | 30.493 | ||
| 2018 | 0.055 | 13.060 | 0.146 | 34.414 | 0.223 | 52.526 | ||
| 2019 | 0.051 | 12.473 | 0.173 | 42.251 | 0.186 | 45.276 | ||
| 2020 | 0.050 | 12.506 | 0.267 | 66.157 | 0.086 | 21.338 | ||
| 2021 | 0.047 | 12.482 | 0.208 | 55.716 | 0.119 | 31.802 | ||
| 均值 | 0.052 | 12.502 | 0.210 | 50.786 | 0.152 | 36.712 | ||
| 年均增长率 (%) | 0.87 | -0.16 | 2.39 | 1.51 | -1.13 | -2.01 | ||
表3 绝对β收敛检验结果Tab.3 Results of the absolute β convergence test |
| 类别 | 全国 | 东北 经济区 | 长江中游 经济区 | 北部沿海 经济区 | 东部沿海 经济区 | 南部沿海 经济区 | 黄河中游 经济区 | 大西南 经济区 | 大西北 经济区 |
|---|---|---|---|---|---|---|---|---|---|
| β | -0.546*** | -0.466*** | -0.563*** | -0.482*** | -0.527*** | -0.552*** | -0.572*** | -0.616*** | -0.547*** |
| (0.016) | (0.041) | (0.039) | (0.048) | (0.059) | (0.044) | (0.042) | (0.040) | (0.059) | |
| ρ | 0.071*** | -0.044 | 0.107** | -0.012 | 0.175** | 0.091 | 0.143*** | 0.054 | 0.003 |
| (0.024) | (0.072) | (0.053) | (0.066) | (0.073) | (0.060) | (0.052) | (0.052) | (0.085) | |
| v | 0.061 | 0.048 | 0.064 | 0.051 | 0.058 | 0.062 | 0.065 | 0.074 | 0.061 |
| τ(年) | 11.411 | 14.363 | 10.885 | 13.699 | 12.036 | 11.222 | 10.618 | 9.415 | 11.379 |
| R2 | 0.2679 | 0.2407 | 0.2781 | 0.2322 | 0.2349 | 0.3090 | 0.2618 | 0.3106 | 0.3220 |
| logL | -2204.145 | -219.606 | -397.871 | -319.474 | -177.526 | -180.084 | -362.461 | -352.792 | -138.329 |
注:***、**、*分别表示在1%、5%、10%的水平上显著,括号内为标准误。表4同。 |
表4 条件β收敛检验结果Tab.4 Results of the conditional β convergence test |
| 类别 | 全国 | 东北 经济区 | 长江中游 经济区 | 北部沿海 经济区 | 东部沿海 经济区 | 南部沿海 经济区 | 黄河中游 经济区 | 大西南 经济区 | 大西北 经济区 |
|---|---|---|---|---|---|---|---|---|---|
| β | -0.550*** | -0.483*** | -0.578*** | -0.510*** | -0.498*** | -0.487*** | -0.618*** | -0.617*** | -0.598*** |
| (0.016) | (0.041) | (0.039) | (0.049) | (0.058) | (0.048) | (0.041) | (0.041) | (0.059) | |
| Empl | -0.000 | -0.034 | -0.026 | -0.002 | -0.030 | -0.027 | -0.006 | 0.052* | 0.034 |
| (0.012) | (0.057) | (0.032) | (0.075) | (0.045) | (0.036) | (0.024) | (0.028) | (0.049) | |
| Temp | -0.206 | -0.908** | 0.022 | -0.659* | 0.141 | -0.129 | -0.780* | 0.018 | 0.370* |
| (0.272) | (0.451) | (0.196) | (0.372) | (0.313) | (0.094) | (0.401) | (0.271) | (0.214) | |
| Prim | -0.010 | 0.163 | -0.123* | -0.108 | -0.135 | -0.206* | -0.174* | 0.007 | -0.121 |
| (0.010) | (0.120) | (0.071) | (0.131) | (0.157) | (0.115) | (0.099) | (0.023) | (0.107) | |
| Hfv | 0.013 | 0.022 | -0.182*** | -0.021 | -0.097 | -0.020 | -0.035 | 0.063** | -0.002 |
| (0.011) | (0.023) | (0.046) | (0.078) | (0.120) | (0.067) | (0.042) | (0.029) | (0.033) | |
| Mca | -0.015 | 0.052 | -0.028 | 0.013 | -0.053 | 0.018 | -0.070** | -0.014 | 0.059 |
| (0.011) | (0.040) | (0.026) | (0.065) | (0.067) | (0.030) | (0.026) | (0.041) | (0.055) | |
| Infr | 0.004 | -0.043 | 0.056 | -0.019 | -0.063 | 0.054 | 0.100* | -0.098** | 0.046 |
| (0.019) | (0.073) | (0.046) | (0.075) | (0.083) | (0.054) | (0.052) | (0.050) | (0.046) | |
| Pgdp | 0.007 | 0.007 | 0.129* | -0.023 | -0.018 | -0.021 | -0.140 | 0.023 | -0.043 |
| (0.030) | (0.062) | (0.074) | (0.148) | (0.126) | (0.025) | (0.092) | (0.057) | (0.123) | |
| Humi | 0.012 | -0.074** | 0.004 | -0.204** | 0.033 | -0.058 | -0.081* | -0.123** | -0.051 |
| (0.016) | (0.035) | (0.033) | (0.090) | (0.046) | (0.040) | (0.045) | (0.051) | (0.056) | |
| Suns | 0.008 | -0.015 | 0.072** | -0.027 | 0.043 | 0.019 | -0.075 | -0.002 | -0.044 |
| (0.049) | (0.022) | (0.033) | (0.038) | (0.040) | (0.030) | (0.051) | (0.034) | (0.046) | |
| ρ | 0.066** | -0.074 | 0.092* | -0.042 | 0.128* | 0.073 | 0.131** | 0.047 | -0.051 |
| (0.024) | (0.073) | (0.054) | (0.067) | (0.075) | (0.061) | (0.053) | (0.052) | (0.080) | |
| v | 0.061 | 0.051 | 0.066 | 0.055 | 0.053 | 0.051 | 0.074 | 0.074 | 0.070 |
| τ(年) | 11.285 | 13.659 | 10.444 | 12.632 | 13.075 | 13.500 | 9.364 | 9.389 | 9.888 |
| R2 | 0.129 | 0.099 | 0.114 | 0.113 | 0.061 | 0.267 | 0.127 | 0.119 | 0.177 |
| logL | -2191.893 | -206.992 | -374.760 | -305.807 | -160.441 | -176.030 | -339.411 | -340.240 | -119.293 |
| [1] |
蒋玉, 于海龙, 丁玉莲, 等. 电子商务对绿色农产品消费溢价的影响分析——基于产品展示机制和声誉激励机制[J]. 中国农村经济, 2021(10):44-63.
|
| [2] |
|
| [3] |
|
| [4] |
|
| [5] |
王笑冰. 关联性要素与地理标志法的构造[J]. 法学研究, 2015, 37(3):82-101.
|
| [6] |
管育鹰. 我国地理标志保护中的疑难问题探讨[J]. 知识产权, 2022(4):3-17.
|
| [7] |
|
| [8] |
张亚峰, 许可, 刘海波, 等. 意大利地理标志促进乡村振兴的经验与启示[J]. 中国软科学, 2019(12):53-61.
|
| [9] |
|
| [10] |
|
| [11] |
|
| [12] |
|
| [13] |
张米尔, 任腾飞, 包丽春. 知识产权的新形态及相互作用研究——以地理标志与生态标签为例[J]. 科学学研究, 2023, 41(8):1454-1463.
|
| [14] |
刘华军. 地理标志的空间分布特征与品牌溢出效应——基于中国三部门地理标志数据的实证研究[J]. 财经研究, 2011, 37(10):48-57.
|
| [15] |
李耀东. 农产品区域品牌助推乡村振兴的作用机理和实施路径研究[J]. 经济问题, 2021(9):97-103.
|
| [16] |
李大垒. 农地规模经营对地理标志农业发展的影响研究——基于陕西省和山东省6个县的调查[J]. 中国土地科学, 2022, 36(1):78-87.
|
| [17] |
孙亚楠, 胡浩. 地理标志农产品发展对策研究[J]. 经济纵横, 2015(7):81-84.
|
| [18] |
|
| [19] |
吴春雅, 夏紫莹, 罗伟平. 消费者网购地理标志农产品意愿与行为的偏差分析[J]. 农业经济问题, 2019(5):110-120.
|
| [20] |
张米尔, 包丽春, 任腾飞. 地理标志对特色农产品出口的作用研究——基于出口市场的国别面板数据[J]. 中国软科学, 2022(2):56-64.
|
| [21] |
李裕瑞, 卜长利, 王鹏艳. 中国农产品地理标志的地域分异特征[J]. 自然资源学报, 2021, 36(4):827-840.
|
| [22] |
吴汉东. 知识产权国际保护制度的变革与发展[J]. 法学研究, 2005(3):126-140.
|
| [23] |
|
| [24] |
|
| [25] |
张今, 卢结华. 商标法中地域性名称的司法认定:商标、地理标志、特有名称与通用名称之辨析[J]. 法学杂志, 2019, 40(2):94-101.
|
| [26] |
宋昕哲. 地理标志保护中通用名称认定的独立标准[J]. 知识产权, 2021(7):61-70.
|
| [27] |
|
| [28] |
|
| [29] |
彭国华. 中国地区收入差距、全要素生产率及其收敛分析[J]. 经济研究, 2005(9):19-29.
|
| [30] |
廖凯诚, 李晓晔, 谢慧敏. 地方政府经济与社会投资效率的区域差异分解及动态效应评价[J]. 数量经济技术经济研究, 2019, 36(12):42-63.
|
| [31] |
姜磊, 陈星宇, 朱竑. 中国城市养老院的空间分布特征及其分异成因[J]. 地理学报, 2021, 76(8):1951-1964.
|
| [32] |
郭鹏飞, 胡歆韵, 李敬. 中国网络基础设施资本回报率的区域差异与空间收敛性研究[J]. 数量经济技术经济研究, 2022, 39(1):73-93.
|
| [33] |
徐孟志, 李继霞, 刘腾飞, 等. 中国环境治理绩效的区域差异、动态演进及收敛性——基于流域视角的比较分析[J]. 经济地理, 2023, 43(10):1-12.
|
| [34] |
王韧, 匡祎琦, 农通理, 等. 我国农业保险空间格局动态演变及收敛研究[J]. 经济地理, 2021, 41(7):164-172.
|
| [35] |
赵领娣, 孙兆旭. 海岸带城市经济发展质量与生态韧性协同发展演化及空间收敛特征[J]. 经济地理, 2023, 43(7):119-129,240.
|
| [36] |
郑江淮, 陈喆, 冉征. 创新集群的“中心—外围结构”:技术互补与经济增长收敛性研究[J]. 数量经济技术经济研究, 2023, 40(1):66-86.
|
| [37] |
钟顺昌, 邵佳辉. 黄河流域创新发展的分布动态、空间差异及收敛性研究[J]. 数量经济技术经济研究, 2022, 39(5):25-46.
|
/
| 〈 |
|
〉 |