
省域人工智能发展对绿色全要素生产率的空间效应
|
邝劲松(1971—),男,博士,副教授,研究方向为数字经济与高质量发展。E-mail:joinwill@foxmail.com |
收稿日期: 2024-02-23
修回日期: 2024-07-03
网络出版日期: 2024-09-13
基金资助
湖南省社会科学成果评审委员会课题(XSP20YBC051)
国家社会科学基金重大项目(22&ZD051)
Spatial Effect of Provincial Artificial Intelligence Development on Green Total Factor Productivity
Received date: 2024-02-23
Revised date: 2024-07-03
Online published: 2024-09-13
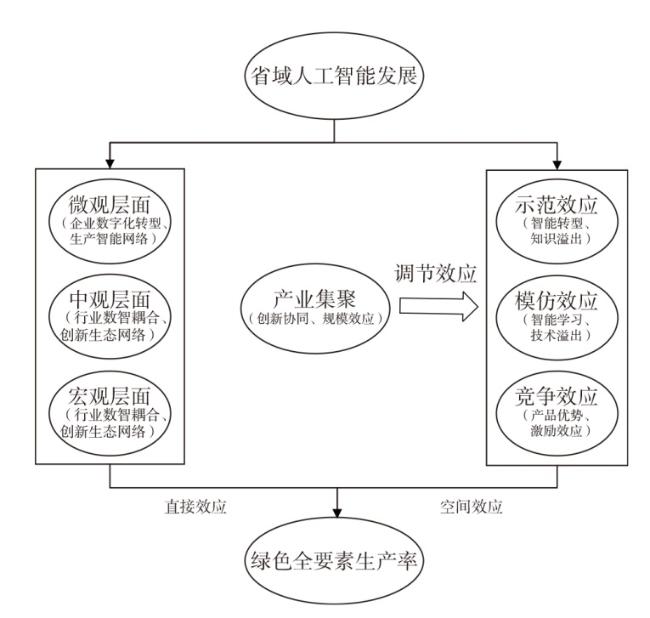
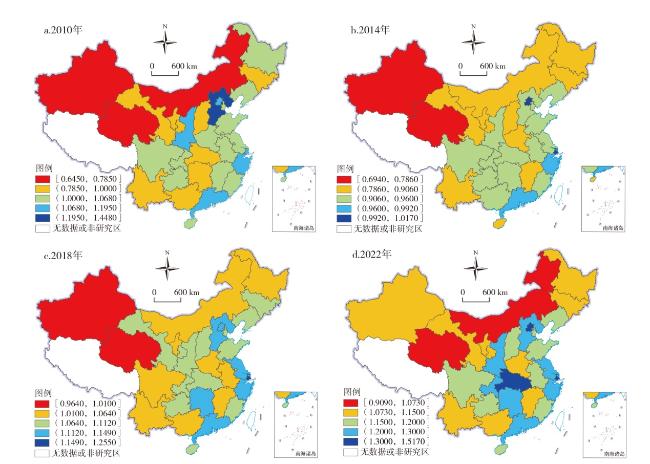
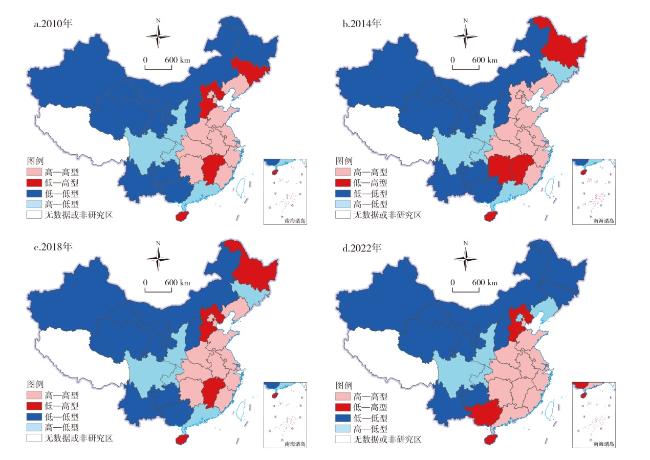
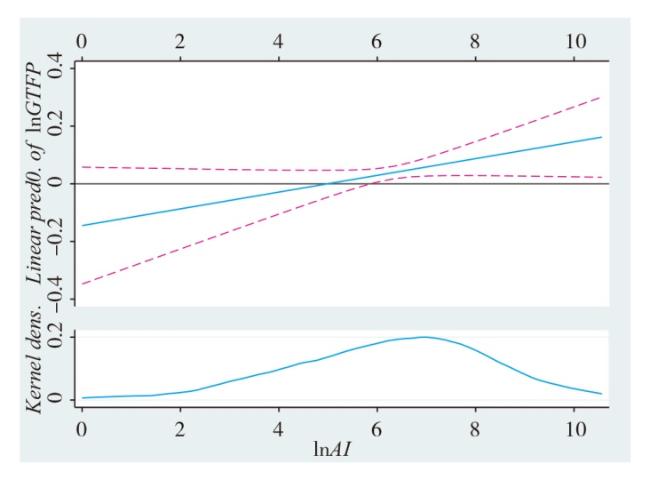
人工智能快速发展已然成为推动经济绿色转型的强大引擎。文章系统阐释了省域人工智能发展影响我国绿色全要素生产率的空间机制。基于2010—2022年省域面板数据,从技术条件、智能应用和创新实践3个维度构建省域人工智能发展水平综合评价指标体系,利用超效率SBM-GML指数模型测度绿色全要素生产率,构建空间杜宾模型实证检验省域人工智能发展对绿色全要素生产率的空间效应。研究发现:①不同省域人工智能发展和绿色全要素生产率的空间集聚现象存在显著差异;②人工智能发展对绿色全要素生产率具有明显空间溢出效应,多种稳健性检验方式验证结论可靠;③异质性检验显示分地区人工智能发展对绿色全要素生产率的空间效应存在差异。④调节机制检验表明,人工智能发展与绿色全要素生产率之间的关系受到产业集聚的调节,较高的产业集聚水平强化了人工智能的作用。研究结论为评估人工智能发展的空间效应提供了全新视角和数据支撑,同时为探寻绿色全要素生产率的提升路径及对应新质生产力形成提供参考。
邝劲松 , 杨坤宇 , 石校菲 , 姚一凡 . 省域人工智能发展对绿色全要素生产率的空间效应[J]. 经济地理, 2024 , 44(7) : 144 -154 . DOI: 10.15957/j.cnki.jjdl.2024.07.015
The rapid development of artificial intelligence has become a powerful engine to promote green economic transformation. This article systematically explains the spatial mechanism of the impact of provincial artificial intelligence development on China's green total factor productivity,and builds a comprehensive evaluation index system of provincial artificial intelligence development level from three dimensions of technical conditions,intelligent application and innovation practice based on the provincial panel data from 2010 to 2022. It uses the superefficiency SBM-GML index model and the spatial Durbin model to measure the green total factor productivity and test the spatial effect of provincial artificial intelligence development on green total factor productivity respectively. The results show that: 1) The spatial agglomeration of artificial intelligence development and green total factor productivity is significantly different in different provincial regions. 2) The development of artificial intelligence has an obvious spatial spillover effect on green total factor productivity,and the results are reliable through various robustness testing methods. 3) Heterogeneity test shows that the spatial effect of artificial intelligence development on green total factor productivity is different in different regions. 4) The adjustment mechanism test shows that the relationship between artificial intelligence development and green total factor productivity is regulated by industrial agglomeration,and the higher level of industrial agglomeration strengthens the role of artificial intelligence. The research conclusions provide data support and a new perspective for evaluating the spatial effects of artificial intelligence development,and provide reference for exploring the improvement path of green total factor productivity and the formation of corresponding new quality productive forces.
表1 省域人工智能发展水平综合评价指标体系Tab.1 Evaluation index system of provincial AI development level |
| 一级指标 | 二级指标 | 三级指标 | 指标确定方法 | 权重 |
|---|---|---|---|---|
| 人工智能 发展水平 | 技术条件 | 人工智能企业贡献度 | 各省域上市人工智能企业当年利润总额/当年GDP | 0.3328 |
| 人工智能产学研基地数 | 各省域人工智能产学研基地数量 | |||
| 人工智能企业数 | 各省域人工智能企业数量 | |||
| 智能应用 | 机器人渗透度 | 不同行业机器人安装量和地区分行业劳动就业份额测算 | 0.3614 | |
| 大数据采集及处理 | 信息传输、软件从业人员比重 | |||
| 数字化转型程度 | 人工智能技术、大数据技术、云计算技术、区块链技术和数字技术应用领域细分指标在报告中频次的省域均值 | |||
| 创新实践 | 人工智能专利数 | G06F40*等共31类归属于人工智能专利分类标准的专利数量 | 0.3058 | |
| 人工智能重点专项立项数 | 智能芯片研发计划数、人工智能软件开发项目数和互联网协同智能工业化制造技术研发项目数之和 |
表2 省域人工智能发展水平综合测度结果Tab.2 Results of comprehensive measurement of provincial AI development level |
| 省域 | 2010 | 2012 | 2014 | 2016 | 2018 | 2020 | 2022 |
|---|---|---|---|---|---|---|---|
| 北京 | 0.0154 | 0.0270 | 0.0492 | 0.0906 | 0.1531 | 0.3074 | 0.3895 |
| 天津 | 0.0039 | 0.0083 | 0.0145 | 0.0269 | 0.0416 | 0.0748 | 0.1077 |
| 河北 | 0.0024 | 0.0050 | 0.0101 | 0.0203 | 0.0317 | 0.0461 | 0.0658 |
| 山西 | 0.0013 | 0.0025 | 0.0042 | 0.0083 | 0.0164 | 0.0282 | 0.0567 |
| 内蒙古 | 0.0005 | 0.0010 | 0.0023 | 0.0046 | 0.0079 | 0.0124 | 0.0233 |
| 辽宁 | 0.0043 | 0.0078 | 0.0136 | 0.0239 | 0.0422 | 0.0711 | 0.1124 |
| 吉林 | 0.0021 | 0.0052 | 0.0124 | 0.0210 | 0.0345 | 0.0489 | 0.0725 |
| 黑龙江 | 0.0017 | 0.0046 | 0.0055 | 0.0089 | 0.0135 | 0.0245 | 0.0354 |
| 上海 | 0.0101 | 0.0197 | 0.0293 | 0.0548 | 0.1020 | 0.1966 | 0.2669 |
| 江苏 | 0.0138 | 0.0246 | 0.0544 | 0.1088 | 0.2017 | 0.3678 | 0.5199 |
| 浙江 | 0.0120 | 0.0211 | 0.0346 | 0.0689 | 0.1343 | 0.2708 | 0.3996 |
| 安徽 | 0.0029 | 0.0065 | 0.0139 | 0.0312 | 0.0649 | 0.0973 | 0.1722 |
| 福建 | 0.0071 | 0.0121 | 0.0190 | 0.0371 | 0.0664 | 0.1128 | 0.1822 |
| 江西 | 0.0017 | 0.0036 | 0.0084 | 0.0185 | 0.0302 | 0.0583 | 0.1017 |
| 山东 | 0.0145 | 0.0243 | 0.0394 | 0.0708 | 0.1154 | 0.1989 | 0.3293 |
| 河南 | 0.0038 | 0.0078 | 0.0184 | 0.0412 | 0.0618 | 0.0962 | 0.1578 |
| 湖北 | 0.0052 | 0.0114 | 0.0224 | 0.0455 | 0.0747 | 0.1224 | 0.1902 |
| 湖南 | 0.0029 | 0.0050 | 0.0096 | 0.0198 | 0.0355 | 0.0687 | 0.1168 |
| 广东 | 0.0266 | 0.0459 | 0.0989 | 0.2207 | 0.4123 | 0.6788 | 0.9182 |
| 广西 | 0.0017 | 0.0038 | 0.0082 | 0.0182 | 0.0235 | 0.0444 | 0.0744 |
| 海南 | 0.0002 | 0.0007 | 0.0015 | 0.0030 | 0.0058 | 0.0231 | 0.0975 |
| 重庆 | 0.0036 | 0.0079 | 0.0146 | 0.0275 | 0.0482 | 0.0795 | 0.1171 |
| 四川 | 0.0048 | 0.0095 | 0.0179 | 0.0363 | 0.0634 | 0.1137 | 0.1824 |
| 贵州 | 0.0009 | 0.0016 | 0.0034 | 0.0066 | 0.0128 | 0.0222 | 0.0372 |
| 云南 | 0.0011 | 0.0020 | 0.0037 | 0.0075 | 0.0150 | 0.0221 | 0.0380 |
| 陕西 | 0.0048 | 0.0093 | 0.0166 | 0.0270 | 0.0519 | 0.0970 | 0.1602 |
| 甘肃 | 0.0008 | 0.0013 | 0.0023 | 0.0049 | 0.0079 | 0.0143 | 0.0263 |
| 青海 | 0.0001 | 0.0002 | 0.0007 | 0.0012 | 0.0019 | 0.0037 | 0.0079 |
| 宁夏 | 0.0001 | 0.0003 | 0.0009 | 0.0018 | 0.0033 | 0.0063 | 0.0128 |
| 新疆 | 0.0006 | 0.0012 | 0.0024 | 0.0046 | 0.0077 | 0.0157 | 0.0307 |
表3 变量定义与描述性统计Tab.3 Variable definition and descriptive statistics |
| 变量类型 | 变量名称 | 变量符号 | 变量说明 | 样本数(个) | 均值 | 标准差 | 最小值 | 最大值 |
|---|---|---|---|---|---|---|---|---|
| 被解释变量 | 绿色全要素生产率 (取自然对数,下同) | lnGTFP | 超效率SBM-GML指数模型测度所得(同时取自然对数,下同) | 390 | 0.0492 | 0.1625 | -0.9163 | 1.1979 |
| 核心解释变量 | 省域人工智能发展水平 | lnAI | 熵值法计算所得 | 390 | -4.0694 | 1.7006 | -9.2103 | -0.0853 |
| 控制变量 | 产业结构 | lnInd | 第三产业产值与第二产业产值比值 | 390 | 0.1037 | 0.4199 | -0.6939 | 1.6671 |
| 经济发展水平 | lnED | 人均GDP平减所得值 | 390 | 9.3261 | 0.4644 | 8.4672 | 10.8077 | |
| 人力资源水平 | lnH | 高等院校在校生人数除以总人口 | 390 | -3.9167 | 0.2865 | -4.8293 | -3.1299 | |
| 金融发展水平 | lnFinance | 年末金融机构存贷款余额占GDP比重 | 390 | 1.1290 | 0.3142 | 0.4171 | 2.0957 | |
| 创新水平 | lnInno | 发明专利申请受理数量 | 390 | 2.2452 | 0.1576 | 1.6606 | 2.5270 | |
| 环境规制 | lnRegu | 省级政府工作报告中与环境规制相关的关键词词频数 | 390 | 3.9854 | 0.3640 | 1.7918 | 4.8203 |
表4 基准回归及空间杜宾模型回归结果Tab.4 Results of baseline regression and spatial Durbin regression |
| 模型设定 | 普通最小二乘(1) | 双向固定效应(2) | 空间杜宾模型(3) |
|---|---|---|---|
| 空间矩阵 | / | 地理反距离矩阵 | |
| ρ | -0.2184**(0.0980) | ||
| W·lnAI | 0.3221** (0.1352) | ||
| W·lnInd | -0.4651**(0.1862) | ||
| W·lnED | 0.0059 (0.3175) | ||
| W·lnH | 0.8498***(0.2601) | ||
| W·lnFinance | 0.3633 (0.2929) | ||
| W·lnInno | -3.0111***(0.7771) | ||
| W·lnRegu | -0.0918 (0.0824) | ||
| lnAI | 0.0331** (0.0135) | 0.1093***(0.0233) | 0.0335* (0.0186) |
| lnInd | -0.0497 (0.0375) | -0.0941 (0.0655) | -0.2848***(0.0715) |
| lnED | 0.0430 (0.0271) | -0.6043***(0.1597) | -0.5981***(0.1515) |
| lnH | -0.0177 (0.0438) | 0.0847 (0.0887) | 0.0321 (0.1015) |
| lnFinance | 0.0090 (0.0483) | -0.4162***(0.1187) | -0.2938**(0.1293) |
| lnInno | -0.5580***(0.1366) | -1.2332***(0.2233) | -0.9762***(0.2853) |
| lnRegu | 0.0428* (0.0250) | 0.0938***(0.0273) | 0.0848***(0.0269) |
| Constant | 0.7909* (0.4201) | 9.3355***(1.7783) | |
| 地区&时间 | No | Control | Control |
| N | 390 | 390 | 390 |
| Sigma2 | - | 0.0157*** | |
| R2 | 0.0903 | 0.1412 | 0.0500 |
表5 SDM模型下各变量对GTFP的直接效应与空间溢出效应Tab.5 Direct effect and spatial spillover effect of each variable on GTFP under SDM model |
| 效应类别 | 变量 | 系数 | Z值 | 标准误 |
|---|---|---|---|---|
| 直接效应 | lnAI | 0.0229* | 1.7123 | 0.0134 |
| lnInd | -0.2781*** | -4.5756 | 0.0608 | |
| lnED | -0.5942*** | -3.5859 | 0.1657 | |
| lnH | 0.0102 | 0.0878 | 0.1161 | |
| lnFinance | -0.3159** | -2.0854 | 0.1515 | |
| lnInno | -0.8769*** | -3.2996 | 0.2658 | |
| lnRegu | 0.0890*** | 3.2962 | 0.0270 | |
| 间接效应 (空间溢出 效应) | lnAI | 0.2549** | 2.4681 | 0.1033 |
| lnInd | -0.3533** | -2.1849 | 0.1617 | |
| lnED | 0.1094 | 0.3776 | 0.2898 | |
| lnH | 0.7253*** | 2.9147 | 0.2489 | |
| lnFinance | 0.3666 | 1.4874 | 0.2464 | |
| lnInno | -2.4090*** | -3.9812 | 0.6051 | |
| lnRegu | -0.0854 | 1.1990 | 0.0712 | |
| 总效应 | lnAI | 0.2778** | 2.4995 | 0.1111 |
| lnInd | -0.6314*** | -3.6536 | 0.1728 | |
| lnED | -0.4847* | -1.7226 | 0.2814 | |
| lnH | 0.7355*** | 3.4239 | 0.2148 | |
| lnFinance | 0.0507 | 0.2236 | 0.2267 | |
| lnInno | -3.2859*** | -4.7746 | 0.6882 | |
| lnRegu | 0.0036 | 0.0505 | 0.0709 |
表6 空间效应地区异质性检验Tab.6 Regional heterogeneity test of spatial effect |
| 效应类别 | 变量 | 东部 | 中部 | 西部 |
|---|---|---|---|---|
| 直接效应 | lnAI | 0.0622 (0.0503) | 0.0848** (0.0424) | -0.1127 (0.1351) |
| 控制变量 | Control | Control | Control | |
| 间接效应 (空间溢出效应) | lnAI | 0.2258*** (0.0826) | 0.1099** (0.0552) | 0.1968*** (0.0625) |
| 控制变量 | Control | Control | Control | |
| 总效应 | lnAI | 0.2880*** (0.1010) | 0.1946*** (0.0760) | 0.1418** (0.0678) |
| 控制变量 | Control | Control | Control | |
| N | 143 | 117 | 130 | |
| R2 | 0.0926 | 0.0159 | 0.0364 |
表7 产业集聚的调节效应Tab.7 Moderating effect of industrial agglomeration |
| 变量 | 基准回归 | 空间杜宾模型 | 空间效应分解 | ||
|---|---|---|---|---|---|
| 直接效应 | 间接效应 | 总效应 | |||
| ρ | -0.2460**(0.0980) | ||||
| W·lnAI | 0.3125**(0.1472) | ||||
| W· | 0.0146*(0.0086) | ||||
| lnAI | 0.0382***(0.0131) | 0.0425*(0.0251) | 0.0306*(0.0178) | 0.2540**(0.1204) | 0.2847**(0.1326) |
| 0.0046*(0.0025) | 0.0052*(0.0032) | 0.0043*(0.0025) | 0.0117**(0.0059) | 0.0159**(0.0076) | |
| 控制变量 | Control | Control | Control | ||
| N | 390 | 390 | 390 | ||
| Sigma2 | - | 0.0148*** | - | ||
| R2 | 0.1481 | 0.0696 | |||
| [1] |
林晨, 陈小亮, 陈伟泽, 等. 人工智能、经济增长与居民消费改善:资本结构优化的视角[J]. 中国工业经济, 2020(2):61-83.
|
| [2] |
陈彦斌, 林晨, 陈小亮. 人工智能、老龄化与经济增长[J]. 经济研究, 2019, 54(7):47-63.
|
| [3] |
汪前元, 魏守道, 金山, 等. 工业智能化的就业效应研究——基于劳动者技能和性别的空间计量分析[J]. 管理世界, 2022, 38(10):110-126.
|
| [4] |
|
| [5] |
郭凯明, 王钰冰, 龚六堂. 劳动供给转变、有为政府作用与人工智能时代开启[J]. 管理世界, 2023, 39(6):1-21.
|
| [6] |
林熙, 刘啟仁, 冯桂媚. 智能制造与绿色发展:基于工业机器人进口视角[J]. 世界经济, 2023, 46(8):3-31.
|
| [7] |
|
| [8] |
|
| [9] |
|
| [10] |
张帆, 施震凯, 武戈. 数字经济与环境规制对绿色全要素生产率的影响[J]. 南京社会科学, 2022(6):12-20,29.
|
| [11] |
余东华, 李云汉. 数字经济时代的产业组织创新——以数字技术驱动的产业链群生态体系为例[J]. 改革, 2021(7):24-43.
|
| [12] |
许宪春, 任雪, 常子豪. 大数据与绿色发展[J]. 中国工业经济, 2019(4):5-22.
|
| [13] |
|
| [14] |
向仙虹, 杨国歌. 要素市场整合、空间知识溢出与低碳转型发展[J]. 产业经济研究, 2023(6):128-142.
|
| [15] |
|
| [16] |
|
| [17] |
|
| [18] |
|
| [19] |
|
| [20] |
刘钻扩, 辛丽. “一带一路”建设对沿线中国重点省域绿色全要素生产率的影响[J]. 中国人口·资源与环境, 2018, 28(12):87-97.
|
| [21] |
|
| [22] |
蔺鹏, 孟娜娜. 环境约束下京津冀区域经济发展质量测度与动力解构——基于绿色全要素生产率视角[J]. 经济地理, 2020, 40(9):36-45.
|
| [23] |
周晓辉, 刘莹莹, 彭留英. 数字经济发展与绿色全要素生产率提高[J]. 上海经济研究, 2021(12):51-63.
|
| [24] |
|
| [25] |
王林辉, 胡晟明, 董直庆. 人工智能技术会诱致劳动收入不平等吗——模型推演与分类评估[J]. 中国工业经济, 2020(4):97-115.
|
| [26] |
孙早, 侯玉琳. 人工智能发展对产业全要素生产率的影响——一个基于中国制造业的经验研究[J]. 经济学家, 2021(1):32-42.
|
| [27] |
|
| [28] |
欧春尧, 刘贻新, 戴海闻, 等. 人工智能企业颠覆性创新的影响因素及其作用路径研究[J]. 软科学, 2021, 35(4):55-60,111.
|
| [29] |
|
| [30] |
李晓萍, 张亿军, 江飞涛. 绿色产业政策:理论演进与中国实践[J]. 财经研究, 2019, 45(8):4-27.
|
| [31] |
张桅, 胡艳. 长三角地区创新型人力资本对绿色全要素生产率的影响——基于空间杜宾模型的实证分析[J]. 中国人口·资源与环境, 2020, 30(9):106-120.
|
| [32] |
杜运周, 刘秋辰, 陈凯薇, 等. 营商环境生态、全要素生产率与城市高质量发展的多元模式——基于复杂系统观的组态分析[J]. 管理世界, 2022, 38(9):127-145.
|
| [33] |
周杰琦, 陈达, 夏南新. 人工智能、产业结构优化与绿色发展效率——理论分析和经验证据[J]. 现代财经(天津财经大学学报), 2023, 43(4):96-113.
|
| [34] |
罗军, 邱海桐. 城市数字经济驱动制造业绿色发展的空间效应[J]. 经济地理, 2022, 42(12):13-22.
|
| [35] |
|
/
| 〈 |
|
〉 |