
长三角城市群数字经济与制造业高质量发展耦合协调时空演化及影响因素
|
颜平(1981—),女,硕士,副教授,研究方向为经济地理、产业经济。E-mail:yanping@zime.edu.cn |
收稿日期: 2023-11-20
修回日期: 2024-03-04
网络出版日期: 2024-09-13
基金资助
国家社会科学基金项目(19BGL084)
浙江省软科学项目(2022C35079)
浙江省高校重大人文社会科学攻关计划项目(2023QN134)
Spatial-temporal Evolution and Influencing Factors of the Coupling Coordination of Digital Economy and High-quality Development of Manufacturing Industry in the Yangtze River Delta Urban Agglomeration
Received date: 2023-11-20
Revised date: 2024-03-04
Online published: 2024-09-13
颜平 , 周闻宇 , 王瑞荣 , 金湖江 . 长三角城市群数字经济与制造业高质量发展耦合协调时空演化及影响因素[J]. 经济地理, 2024 , 44(7) : 87 -95 . DOI: 10.15957/j.cnki.jjdl.2024.07.009
The continuous and rapid growth of the digital economy has become an important force to promote the high-quality development of China's manufacturing industry. Based on the panel data of 41 cities at the prefecture level and above from 2012 to 2021 in the Yangtze River Delta urban agglomeration,this paper analyzes the spatial-temporal evolution characteristics of the coupling coordination between the digital economy and the high-quality development of manufacturing industry and its influencing factors using the coupled coordination model and the spatial Durbin model. It' found that: 1) The degree of coupling coordination between the digital economy and the high-quality development of manufacturing industry continues to strengthen. In terms of temporal evolution characteristics,it shows a highly coupling coordination development trend between the digital economy and the manufacturing industry in the Yangtze River Delta urban agglomeration,and has obvious regional differences. 2) There are great differences in the coupling coordination level between the digital economy and the manufacturing industry in different regions,and there is a large room for improvement. From the perspective of spatial evolution,the proportion of high-quality coordination,good coordination and intermediate coordination is very low,and there is still much room for improvement. From the perspective of spatial correlation, there is a significant spatial correlation,which is embodied in the characteristics of spatial agglomeration. 3) The coupling coordination degree between the digital economy and the manufacturing industry affects each other and has some differences between neighboring cities. Among them,the level of economic development,the level of financial development,the utilization level of foreign capital and the optimization of industrial structure have a significant positive promoting effect on the coupling coordination degree of neighboring areas,the government intervention and the degree of opening to the outside world have a significant inhibiting effect on the coupling coordination degree of neighboring areas,while human capital fails the significance level test. According to the above,it proposes some suggestions: strengthening the top-level design,radiation drive and support capability,and providing impetus for the coupling coordination development between the digital economy and the high-quality development of manufacturing industry in urban agglomerations.
表1 数字经济与制造业高质量发展综合评价指标体系Tab.1 Comprehensive evaluation index system of the digital economy and the high-quality development of manufacturing industry |
| 目标层 | 准则层 | 指标层 | 单位 | 指标属性 |
|---|---|---|---|---|
| 数字经济发展 U1 | 数字基础设施 | 移动通信普及率 | 部/百人 | 正向 |
| 宽带普及率 | % | 正向 | ||
| 数字业务规模 | 电信业务总量 | 亿元 | 正向 | |
| 快递业务量 | 万件 | 正向 | ||
| 数字技术创新 | 规上工业企业R&D人员 | 万人 | 正向 | |
| 规上工业企业R&D经费内部支出 | 亿元 | 正向 | ||
| 制造业高质量发展 U2 | 质量效益 | 发展规模:规模以上制造业工业企业工业总产值 | 亿元 | 正向 |
| 发展质量:规模以上制造业工业企业主营业务收入/平均用工人数 | 万元/人 | 正向 | ||
| 创新能力 | 创新投入:研发经费内部支出 | % | 正向 | |
| 创新产出:有效发明专利数 | 件 | 正向 | ||
| 资源配置效率 | 劳动生产率:规模以上制造业工业企业工业总产值/平均用工人数 | 万元/人 | 正向 | |
| 资产负债率:规模以上制造业工业企业负责合计/资产合计 | % | 逆向 | ||
| 绿色发展 | 单位工业增加值电力能耗:工业电力消费量/工业增加值 | kW·h/元 | 逆向 | |
| 单位工业增加值废水排放量:工业废水排放总量/工业增加值 | t/元 | 逆向 |
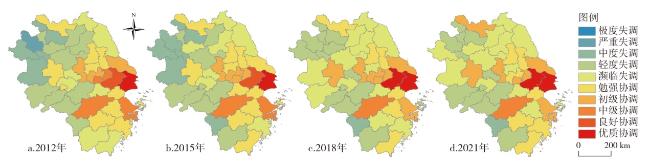
表2 耦合协调度等级划分标准Tab.2 Classification criteria of coupling coordination degree |
| 耦合协调度 | 耦合协调等级 | 耦合协调度 | 耦合协调等级 |
|---|---|---|---|
| (0.0,0.1) | 极度失调 | [0.5,0.6) | 勉强协调 |
| [0.1,0.2) | 严重失调 | [0.6,0.7) | 初级协调 |
| [0.2,0.3) | 中度失调 | [0.7,0.8) | 中级协调 |
| [0.3,0.4) | 轻度失调 | [0.8,0.9) | 良好协调 |
| [0.4,0.5) | 濒临失调 | [0.9,1.0) | 优质协调 |
表3 变量描述性统计结果Tab.3 Descriptive statistics of variables |
| 变量 | 观测数(个) | 均值 | 标准差 | 最小值 | 最大值 |
|---|---|---|---|---|---|
| D | 410 | 0.4865 | 0.1611 | 0.2260 | 0.9600 |
| ed | 410 | 11.0814 | 0.5716 | 9.5531 | 12.0188 |
| gi | 410 | 0.1651 | 0.0623 | 0.0812 | 0.3279 |
| hc | 410 | 0.0241 | 0.0195 | 0.0022 | 0.1001 |
| fd | 410 | 1.1628 | 0.4059 | 0.4695 | 2.1833 |
| ou | 410 | 0.3503 | 0.5770 | 0.0257 | 4.3343 |
| fdi | 410 | 0.0245 | 0.0171 | 0.0032 | 0.0869 |
| iso | 410 | 1.0321 | 0.3487 | 0.3786 | 2.4657 |
表4 长三角城市群数字经济与制造业高质量发展的耦合协调度和相对发展度Tab.4 Coupling coordination degree and relative development degree between the digital economy and the high-quality development of manufacturing industry in the Yangtze River Delta urban agglomeration |
| 年份 | 耦合度C | 耦合协调度D | 耦合协调等级 | 相对发展P | 发展阶段 |
|---|---|---|---|---|---|
| 2012 | 1.000 | 0.100 | 严重失调 | 1.0814 | 同步发展 |
| 2013 | 0.994 | 0.300 | 轻度失调 | 1.0504 | 同步发展 |
| 2014 | 0.973 | 0.461 | 濒临失调 | 0.9725 | 同步发展 |
| 2015 | 0.987 | 0.529 | 勉强协调 | 0.9761 | 同步发展 |
| 2016 | 0.997 | 0.599 | 勉强协调 | 0.9911 | 同步发展 |
| 2017 | 0.989 | 0.689 | 初级协调 | 0.9345 | 同步发展 |
| 2018 | 1.000 | 0.813 | 良好协调 | 1.0166 | 同步发展 |
| 2019 | 0.999 | 0.863 | 良好协调 | 1.0363 | 同步发展 |
| 2020 | 1.000 | 0.893 | 良好协调 | 0.9864 | 同步发展 |
| 2021 | 1.000 | 0.995 | 优质协调 | 0.9890 | 同步发展 |
表5 长三角41个城市数字经济与制造业高质量发展耦合协调度时序演化Tab.5 Evolution of coupling coordination degree between the digital economy and the high-quality development of manufacturing industry in 41 cities of Yangtze River Delta urban agglomeration |
| 城市 | 2012 | 2013 | 2014 | 2015 | 2016 | 2017 | 2018 | 2019 | 2020 | 2021 | 均值 |
|---|---|---|---|---|---|---|---|---|---|---|---|
| 上海 | 0.960 | 0.960 | 0.981 | 0.977 | 0.943 | 0.965 | 0.939 | 0.941 | 0.969 | 0.950 | 0.959 |
| 南京 | 0.690 | 0.671 | 0.692 | 0.686 | 0.705 | 0.675 | 0.656 | 0.687 | 0.677 | 0.654 | 0.679 |
| 无锡 | 0.714 | 0.678 | 0.660 | 0.663 | 0.655 | 0.665 | 0.660 | 0.687 | 0.673 | 0.683 | 0.674 |
| 徐州 | 0.509 | 0.521 | 0.520 | 0.517 | 0.550 | 0.557 | 0.588 | 0.597 | 0.590 | 0.602 | 0.555 |
| 常州 | 0.653 | 0.639 | 0.648 | 0.650 | 0.655 | 0.617 | 0.608 | 0.652 | 0.611 | 0.593 | 0.633 |
| 苏州 | 0.849 | 0.829 | 0.875 | 0.885 | 0.871 | 0.876 | 0.915 | 0.946 | 0.956 | 0.950 | 0.895 |
| 南通 | 0.623 | 0.601 | 0.585 | 0.600 | 0.613 | 0.609 | 0.611 | 0.599 | 0.608 | 0.618 | 0.607 |
| 连云港 | 0.483 | 0.475 | 0.470 | 0.475 | 0.487 | 0.462 | 0.454 | 0.454 | 0.437 | 0.448 | 0.465 |
| 淮安 | 0.345 | 0.411 | 0.431 | 0.446 | 0.478 | 0.460 | 0.480 | 0.457 | 0.450 | 0.462 | 0.442 |
| 盐城 | 0.432 | 0.458 | 0.466 | 0.471 | 0.494 | 0.484 | 0.467 | 0.457 | 0.448 | 0.469 | 0.465 |
| 扬州 | 0.540 | 0.526 | 0.521 | 0.524 | 0.544 | 0.542 | 0.545 | 0.541 | 0.528 | 0.525 | 0.534 |
| 镇江 | 0.550 | 0.526 | 0.533 | 0.531 | 0.541 | 0.523 | 0.474 | 0.476 | 0.467 | 0.480 | 0.510 |
| 泰州 | 0.518 | 0.517 | 0.519 | 0.529 | 0.553 | 0.531 | 0.550 | 0.543 | 0.516 | 0.515 | 0.529 |
| 宿迁 | 0.365 | 0.397 | 0.266 | 0.384 | 0.338 | 0.391 | 0.415 | 0.405 | 0.410 | 0.415 | 0.379 |
| 杭州 | 0.758 | 0.731 | 0.758 | 0.772 | 0.740 | 0.774 | 0.759 | 0.739 | 0.783 | 0.739 | 0.755 |
| 嘉兴 | 0.512 | 0.508 | 0.555 | 0.559 | 0.501 | 0.549 | 0.550 | 0.566 | 0.573 | 0.543 | 0.542 |
| 湖州 | 0.489 | 0.478 | 0.506 | 0.535 | 0.492 | 0.503 | 0.494 | 0.518 | 0.521 | 0.492 | 0.503 |
| 舟山 | 0.547 | 0.494 | 0.523 | 0.578 | 0.538 | 0.428 | 0.363 | 0.413 | 0.408 | 0.401 | 0.469 |
| 金华 | 0.519 | 0.483 | 0.543 | 0.506 | 0.528 | 0.558 | 0.496 | 0.551 | 0.513 | 0.526 | 0.522 |
| 绍兴 | 0.574 | 0.545 | 0.587 | 0.547 | 0.585 | 0.585 | 0.527 | 0.517 | 0.520 | 0.489 | 0.548 |
| 温州 | 0.496 | 0.533 | 0.532 | 0.534 | 0.526 | 0.560 | 0.560 | 0.567 | 0.574 | 0.529 | 0.541 |
| 台州 | 0.503 | 0.431 | 0.481 | 0.465 | 0.463 | 0.518 | 0.499 | 0.530 | 0.514 | 0.508 | 0.491 |
| 丽水 | 0.425 | 0.401 | 0.417 | 0.384 | 0.383 | 0.385 | 0.344 | 0.352 | 0.336 | 0.353 | 0.378 |
| 衢州 | 0.302 | 0.321 | 0.393 | 0.281 | 0.186 | 0.256 | 0.298 | 0.262 | 0.263 | 0.255 | 0.282 |
| 宁波 | 0.711 | 0.699 | 0.726 | 0.718 | 0.680 | 0.707 | 0.677 | 0.694 | 0.705 | 0.676 | 0.699 |
| 宣城 | 0.314 | 0.338 | 0.348 | 0.331 | 0.310 | 0.336 | 0.356 | 0.350 | 0.355 | 0.380 | 0.342 |
| 宿州 | 0.264 | 0.352 | 0.304 | 0.290 | 0.303 | 0.307 | 0.376 | 0.327 | 0.346 | 0.394 | 0.326 |
| 滁州 | 0.351 | 0.388 | 0.343 | 0.335 | 0.327 | 0.339 | 0.412 | 0.370 | 0.371 | 0.407 | 0.364 |
| 池州 | 0.301 | 0.301 | 0.316 | 0.314 | 0.266 | 0.285 | 0.313 | 0.323 | 0.338 | 0.350 | 0.311 |
| 阜阳 | 0.226 | 0.337 | 0.290 | 0.280 | 0.307 | 0.301 | 0.381 | 0.346 | 0.359 | 0.418 | 0.325 |
| 六安 | 0.239 | 0.346 | 0.282 | 0.278 | 0.263 | 0.303 | 0.403 | 0.335 | 0.367 | 0.413 | 0.323 |
| 合肥 | 0.561 | 0.584 | 0.583 | 0.597 | 0.656 | 0.606 | 0.608 | 0.616 | 0.609 | 0.608 | 0.603 |
| 蚌埠 | 0.369 | 0.422 | 0.390 | 0.401 | 0.412 | 0.380 | 0.399 | 0.354 | 0.356 | 0.402 | 0.389 |
| 淮南 | 0.279 | 0.312 | 0.270 | 0.213 | 0.228 | 0.264 | 0.323 | 0.248 | 0.271 | 0.312 | 0.272 |
| 铜陵 | 0.506 | 0.499 | 0.482 | 0.363 | 0.389 | 0.361 | 0.383 | 0.275 | 0.311 | 0.340 | 0.391 |
| 马鞍山 | 0.418 | 0.423 | 0.415 | 0.409 | 0.376 | 0.365 | 0.384 | 0.365 | 0.383 | 0.377 | 0.392 |
| 淮北 | 0.368 | 0.408 | 0.361 | 0.359 | 0.339 | 0.342 | 0.385 | 0.339 | 0.364 | 0.391 | 0.366 |
| 芜湖 | 0.482 | 0.508 | 0.486 | 0.486 | 0.495 | 0.438 | 0.482 | 0.504 | 0.493 | 0.487 | 0.486 |
| 安庆 | 0.330 | 0.396 | 0.329 | 0.350 | 0.361 | 0.316 | 0.474 | 0.338 | 0.367 | 0.396 | 0.366 |
| 黄山 | 0.382 | 0.411 | 0.345 | 0.327 | 0.322 | 0.336 | 0.341 | 0.329 | 0.339 | 0.360 | 0.349 |
| 亳州 | 0.198 | 0.329 | 0.247 | 0.224 | 0.244 | 0.275 | 0.353 | 0.292 | 0.324 | 0.394 | 0.288 |
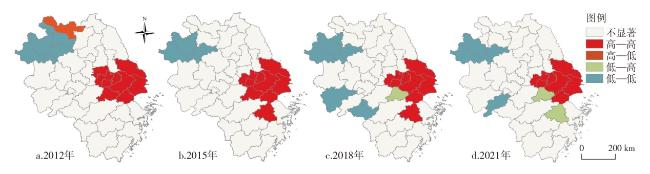
表6 长三角城市群41个城市数字经济与制造业高质量发展耦合协调度的全局莫兰值Tab.6 Global Moran's I value of coupling coordination degree between the digital economy and the high-quality development of manufacturing industry in 41 cities of Yangtze River Delta urban agglomeration |
| 年份 | 2012 | 2013 | 2014 | 2015 | 2016 | 2017 | 2018 | 2019 | 2020 | 2021 |
|---|---|---|---|---|---|---|---|---|---|---|
| 0.421 | 0.295 | 0.413 | 0.434 | 0.350 | 0.354 | 0.231 | 0.322 | 0.291 | 0.236 | |
| Z值 | 4.718 | 3.412 | 4.584 | 4.804 | 3.913 | 4.008 | 2.731 | 3.621 | 3.349 | 2.801 |
| p值 | 0.001 | 0.001 | 0.001 | 0.001 | 0.001 | 0.001 | 0.004 | 0.002 | 0.002 | 0.003 |
表7 基准空间计量回归结果Tab.7 Results of baseline spatial econometric regression |
| 变量 | Tobit | SDM |
|---|---|---|
| ed | 0.0234***(0.0074) | 0.1413***(0.0205) |
| gi | -0.2052***(0.0564) | -0.8359(0.1151) |
| hc | 0.0236(0.2021) | -0.6369*(0.3301) |
| fd | 0.0072(0.0079) | 0.0565***(0.0137) |
| fdi | 0.2563(0.1744) | 0.9827***(0.2879) |
| iso | -0.0057(0.081) | 0.1935***(0.0162) |
| (rho) | 0.9778***(0.0051) | 0.3021***(0.0670) |
| 观测值 | 410 | 410 |
| Log likelihood | 845.3583 | 444.0730 |
注:括号内为对应的标准误,***、**、*分别表示在1%、5%和10%的水平上显著。表8同。 |
表8 空间溢出效应检验结果Tab.8 Test results of spatial spillover effect |
| 变量 | 直接效应 | 间接效应 | 总效应 |
|---|---|---|---|
| ed | 0.1634***(0.0168) | -0.0037(0.0438) | 0.1596***(0.0482) |
| gi | -0.5100***(0.1019) | -0.5897*(0.3236) | -1.0997***(0.3625) |
| hc | -0.1013(0.2787) | -2.4828**(0.9723) | -2.5841**(1.0647) |
| fd | 0.0456***(0.0112) | -0.0106(0.0405) | 0.0350(0.0415) |
| ou | -0.0187**(0.0077) | -0.0001(0.0776) | -0.0189(0.0835) |
| fdi | 0.5109**(0.2444) | -2.5763***(0.9110) | -2.0654**(0.9476) |
| iso | 0.1390***(0.0160) | -0.1774***(0.0589) | -0.0384(0.0686) |
| [1] |
埃比尼泽·霍华德. 明日的田园城市[M]. 北京: 商务印书馆, 2002.
|
| [2] |
|
| [3] |
鲍宗豪, 李振, 向昆. 区域社会发展与城市化进程的融合——深圳、珠海、浦东城市化进程的启示[J]. 社会科学, 2000(6):60-64.
|
| [4] |
张亚丽, 项本武. 城市群一体化水平的测度及其经济增长效应研究——来自中国十大城市群的经验证据[J]. 宏观经济研究, 2021(12):136-148,158.
|
| [5] |
闫东升, 孙伟, 李平星, 等. 长三角一体化区域扩容的城市创新发展效应研究[J]. 地理研究, 2022, 41(9):2568-2586.
|
| [6] |
丁任重, 许渤胤, 张航. 城市群能带动区域经济增长吗?——基于7个国家级城市群的实证分析[J]. 经济地理, 2021, 41(5):37-45.
|
| [7] |
刘镇, 潘泽云. 城市群政策与方言多样性对城市文化发展与协调的影响——基于多期双重差分法的分析[J]. 地域研究与开发, 2022, 41(4):65-70.
|
| [8] |
孙红梅, 雷喻捷. 长三角城市群产业发展与环境规制的耦合关系:微观数据实证[J]. 城市发展研究, 2019, 26(11):19-26.
|
| [9] |
|
| [10] |
荆文君, 孙宝文. 数字经济促进经济高质量发展:一个理论分析框架[J]. 经济学家, 2019(2):66-73.
|
| [11] |
赵涛, 张智, 梁上坤. 数字经济、创业活跃度与高质量发展——来自中国城市的经验证据[J]. 管理世界, 2020, 36(10):65-76.
|
| [12] |
宋洋. 经济发展质量理论视角下的数字经济与高质量发展[J]. 贵州社会科学, 2019(11):102-108.
|
| [13] |
李清华, 何爱平. 数字经济对区域经济协调发展的影响效应及作用机制研究[J]. 经济问题探索, 2022(8):1-13.
|
| [14] |
焦勇. 数字经济赋能制造业转型:从价值重塑到价值创造[J]. 经济学家, 2020(6):87-94.
|
| [15] |
曹正勇. 数字经济背景下促进我国工业高质量发展的新制造模式研究[J]. 理论探讨, 2018, 35(2):99-104.
|
| [16] |
李海舰, 田跃新, 李文杰. 互联网思维与传统企业再造[J]. 中国工业经济, 2014(10):135-146.
|
| [17] |
王德祥. 数字经济背景下数据要素对制造业高质量发展的影响研究[J]. 宏观经济研究, 2022(9):51-63,105.
|
| [18] |
蔡跃洲, 牛新星. 中国数字经济增加值规模测算及结构分析[J]. 中国社会科学, 2021(11):4-30,204.
|
| [19] |
李英杰, 韩平. 数字经济下制造业高质量发展的机理和路径[J]. 宏观经济管理, 2021(5):36-45.
|
| [20] |
周清香, 李仙娥. 数字经济与黄河流域高质量发展:内在机理及实证检验[J]. 统计与决策, 2022, 38(4):15-20.
|
| [21] |
陈修颖, 汤放华. 城乡一体化背景下地方府际关系重构与政府职能转型[J]. 经济地理, 2014, 34(12):78-84,132
|
| [22] |
罗军, 邱海桐. 城市数字经济驱动制造业绿色发展的空间效应[J]. 经济地理, 2022, 42(12):13-22.
|
| [23] |
余鹏, 马珩. 基于面积灰关联相对贴近度模型的长三角制造业产业升级研究[J]. 运筹与管理, 2021, 30(3):177-182.
|
| [24] |
张柯贤, 黎红梅. 城市群数字经济发展水平的空间差异及收敛分析[J]. 经济地理. 2022, 42(9):120-128.
|
| [25] |
朱勤, 孙元, 周立勇. 平台赋能、价值共创与企业绩效的关系研究[J]. 科学学研究, 2019, 37(11):2026-2033,2043.
|
| [26] |
陈修颖, 苗振龙. 数字经济增长动力与区域收入的空间分布规律[J]. 地理学报, 2021, 76(8):1882-1894.
|
| [27] |
陈永伟, 陈志远, 阮丹. 中国省域数字经济的发展水平与空间收敛性分析[J]. 统计与信息论坛, 2023, 38(7):18-31.
|
| [28] |
丛屹, 俞伯阳. 数字经济对中国劳动力资源配置效率的影响[J]. 财经理论与实践, 2020, 41(2):108-114.
|
| [29] |
李史恒, 屈小娥. 数字经济赋能制造业高质量发展:理论机制与实证检验[J]. 经济问题探索, 2022(10):105-117.
|
| [30] |
高运胜, 杨阳. 全球价值链重构背景下我国制造业高质量发展目标与路径研究[J]. 经济学家, 2020(10):65-74.
|
| [31] |
邓峰, 任转转. 互联网对制造业高质量发展的影响研究[J]. 首都经济贸易大学学报, 2020, 22(3):57-67.
|
| [32] |
李炎亭, 李柯. 数字金融与制造业高质量发展:理论分析与实证检验[J]. 兰州大学学报:社会科学版, 2023, 51(5):60-74.
|
| [33] |
谢伟丽, 石军伟, 张起帆. 人工智能、要素禀赋与制造业高质量发展——来自中国208个城市的经验证据[J]. 经济与管理研究, 2023, 44(4):21-38.
|
| [34] |
吕明元, 麻林宵. 中国省域大数据与制造业融合测度分析——基于2013—2018年中国省级面板数据[J]. 技术经济, 2022, 41(1):88-100.
|
| [35] |
薛明月. 黄河流域经济发展与生态环境耦合协调的时空格局研究[J]. 世界地理研究, 2022, 31(6):1261-1272.
|
| [36] |
施炳展, 李建桐. 互联网是否促进了分工:来自中国制造业企业的证据[J]. 管理世界, 2020, 36(4):130-149.
|
| [37] |
郭芸, 范柏乃, 龙剑. 我国区域高质量发展的实际测度与时空演变特征研究[J]. 数量经济技术经济研究, 2020(10):118-132.
|
| [38] |
|
/
| 〈 |
|
〉 |