
京津冀数字产品制造业的时空演化特征与经济效应
|
季鹏(1990—),男,博士,讲师,研究方向为城市与区域经济学。E-mail:jipeng@bucea.edu.cn |
收稿日期: 2022-11-29
修回日期: 2024-02-26
网络出版日期: 2024-09-12
基金资助
国家自然科学基金青年项目(72203018)
国家社会科学基金青年项目(22CJL031)
北京市社会科学基金青年项目(23GLC053)
Spatiotemporal Evolutionary Characteristics and Economic Effects of Beijing-Tianjin-Hebei Digital Manufacturing Industry
Received date: 2022-11-29
Revised date: 2024-02-26
Online published: 2024-09-12
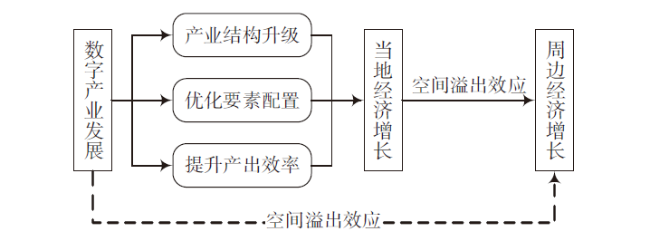
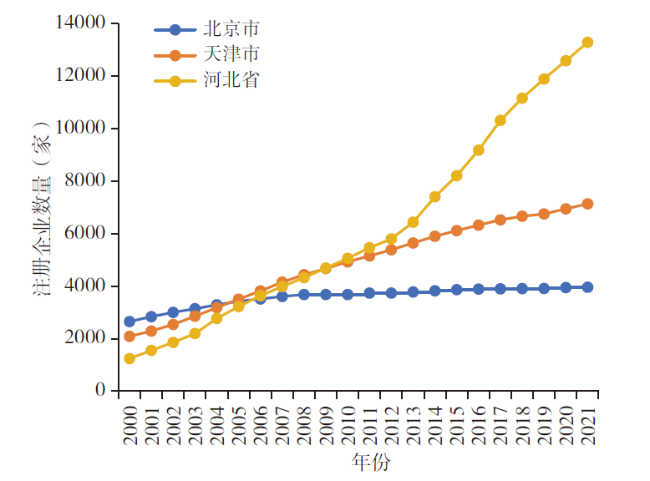
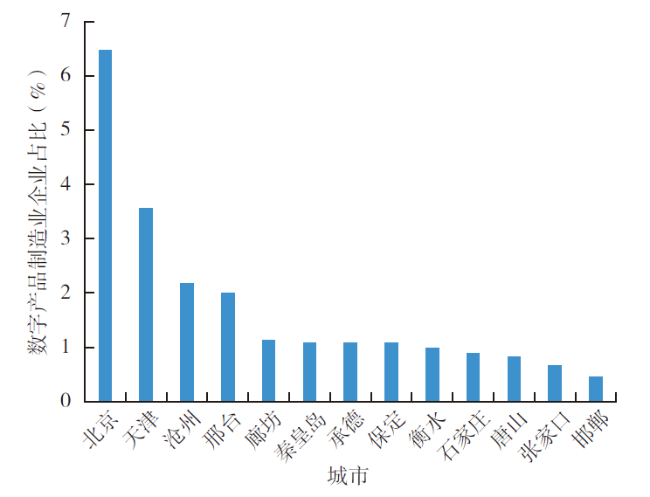
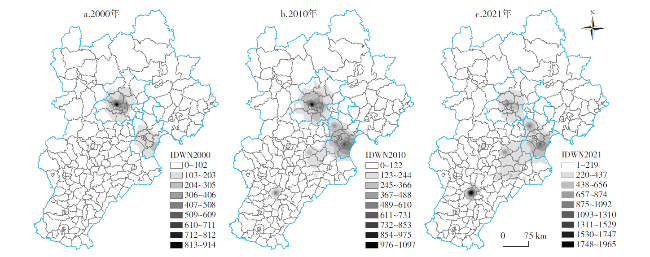
文章利用2000—2021年京津冀地区工商企业注册大数据,运用反距离加权插值等方法探索了京津冀地区数字产品制造业的空间分布特征及演化趋势;同时,基于动态面板模型、空间计量模型,运用广义矩估计(GMM)方法实证检验了数字产品制造业发展对区县经济的影响及空间溢出效应。研究发现:①京津冀三地数字产品制造业的数量规模趋于均衡,津、冀两地数字产品制造业企业注册数量逐渐赶超北京,特别是河北沧州、邢台、保定3个城市初具规模;但津、冀两地数字产品制造业的比重远低于北京,三地间仍存在严重失衡。②实证结果表明数字产品制造业发展不仅能够促进当地经济增长,还对周边区县的经济发展有正向的空间溢出效应,但仅限于累计规模指标。短期内,数字产品制造业企业当年的进入率对于周边区县的经济发展产生明显的抑制作用;长期中,进入率指标的抑制作用消失,即随着规模的积累,数字产品制造业发展对周边区县的经济增长产生正向溢出。
季鹏 , 袁莉琳 . 京津冀数字产品制造业的时空演化特征与经济效应[J]. 经济地理, 2024 , 44(4) : 33 -42 . DOI: 10.15957/j.cnki.jjdl.2024.04.004
Based on the data of industrial and commercial firm registration in Beijing-Tianjin-Hebei from 2000 to 2021,this paper explores the spatial distribution characteristics and evolution trend of digital manufacturing industry using the inverse distance weighted interpolation method,and empirically tests the impact and spillover effect of digital manufacturing development on county economies by the means of dynamic panel model,spatial econometric model and generalized method of moments (GMM). It's found that: 1) The scale of digital manufacturing gradually tended to be balanced in Beijing-Tianjin-Hebei, the number of registered digital manufacturing firms in Tianjin and Hebei gradually exceeded that in Beijing,especially in Cangzhou,Xingtai and Baoding where the digital manufacturing had begun to take shape,the proportion of digital manufacturing in Tianjin and Hebei was still far lower than that in Beijing,but there were still serious imbalances between three regions. 2) The empirical results show that the development of digital manufacturing can not only promote the local economic growth,but also has a positive spatial spillover effect on the surrounding counties' economic growth. However,this positive spillover effect is only limited to the scale proportion index. In the short term,the entry rate of digital manufacturing firms in the current year has a significant inhibitory effect on the economic development of the surrounding counties. In the long term,the inhibitory effect of the entry rate disappears,the share of digital manufacturing generates a positive spillover to the economic growth of the surrounding counties with the accumulation of scale.
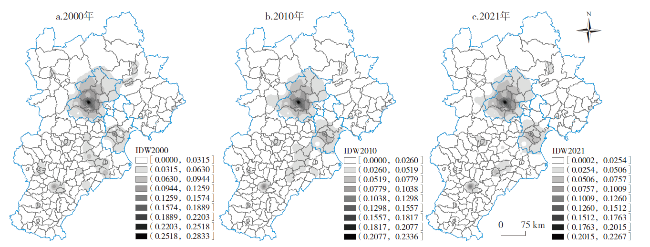
图2 京津冀三地数字产品制造业企业数量时空演化 (2000—2021年)Fig.2 Spatiotemporal evolution of the number of digital product manufacturing enterprises in Beijing-Tianjin and Hebei (2000-2021) |
表1 变量的描述性统计Tab.1 Descriptive statistics |
| 变量 | N | mean | sd | min | max | |
|---|---|---|---|---|---|---|
| 因变量 | lny | 3088 | 10.23 | 0.758 | 7.811 | 13.03 |
| 核心解释变量 | S1 | 3088 | 0.019 | 0.028 | 0.000 | 0.256 |
| S3 | 3088 | 0.982 | 1.472 | 0.000 | 13.50 | |
| entry | 3088 | 0.018 | 0.046 | 0.000 | 1.000 | |
| 控制变量 | lnk | 3088 | 9.934 | 0.909 | 7.429 | 13.35 |
| lnh | 3088 | 0.074 | 0.027 | 0.020 | 0.415 | |
| Pexp | 3088 | 3.606 | 2.366 | 0.112 | 18.62 |
表2 基准回归结果Tab.2 Benchmark regression results |
| 变量名称 | (1)lny | (2)lny | (3)lny | (4)lny | (5)lny | (6)lny |
|---|---|---|---|---|---|---|
| L.lny | 0.952***(0.002) | 0.952***(0.002) | 0.965***(0.002) | 0.938***(0.002) | 0.936***(0.002) | 0.941***(0.001) |
| S1 | 0.284***(0.038) | 0.128***(0.021) | ||||
| S3 | 0.005***(0.001) | 0.002***(0.000) | ||||
| entry | 0.190***(0.006) | 0.107***(0.002) | ||||
| lnk | 0.030***(0.001) | 0.030***(0.001) | 0.028***(0.001) | |||
| lnh | 0.207***(0.019) | 0.225***(0.019) | 0.175***(0.019) | |||
| Pexp | -0.009***(0.000) | -0.009***(0.000) | -0.009***(0.000) | |||
| 年份固定效应 | 是 | 是 | 是 | 是 | 是 | 是 |
| Constant | 0.000(0.000) | 0.470***(0.017) | 0.000(0.000) | 0.321***(0.011) | 0.000(0.000) | 0.000(0.000) |
| AR(1) | 0.000 | 0.000 | 0.000 | 0.000 | 0.000 | 0.000 |
| AR(2) | 0.300 | 0.300 | 0.292 | 0.319 | 0.320 | 0.316 |
| Hansen检验 | 0.125 | 0.125 | 0.402 | 0.179 | 0.179 | 0.217 |
| N | 2891 | 2891 | 2891 | 2891 | 2891 | 2891 |
表3 空间计量回归结果Tab.3 Spatial econometric regression results |
| SDM模型 | SAR模型 | ||||||
|---|---|---|---|---|---|---|---|
| lny | lny | lny | lny | lny | lny | ||
| L.lny | 0.727***(0.014) | 0.727***(0.014) | 0.758***(0.014) | 0.732***(0.014) | 0.732***(0.014) | 0.865***(0.014) | |
| S1 | 1.452***(0.323) | 1.612***(0.273) | |||||
| S3 | 0.028***(0.006) | 0.031***(0.005) | |||||
| entry | 0.077***(0.029) | 0.035(0.028) | |||||
| lnk | 0.128***(0.015) | 0.128***(0.015) | 0.107***(0.015) | 0.118***(0.014) | 0.118***(0.014) | -0.073***(0.003) | |
| lnh | 0.113(0.249) | 0.113(0.249) | 0.192(0.251) | 0.117(0.249) | 0.117(0.249) | 1.365***(0.184) | |
| Pexp | -0.024***(0.004) | -0.024***(0.004) | -0.025***(0.004) | -0.023***(0.004) | -0.023***(0.004) | -0.002(0.002) | |
| W·S1 | 1.140*(0.620) | ||||||
| W·S3 | 0.022*(0.012) | ||||||
| W·entry | -0.221***(0.057) | ||||||
| W·lnk | -0.055**(0.027) | -0.055**(0.027) | -0.074***(0.026) | ||||
| W·lnh | 0.230(0.537) | 0.230(0.537) | 0.513(0.539) | ||||
| W·Pexp | 0.005(0.007) | 0.005(0.007) | 0.008(0.007) | ||||
| rho | 0.105***(0.024) | 0.105***(0.024) | 0.140***(0.022) | 0.072***(0.016) | 0.072***(0.016) | 0.890***(0.018) | |
| sigma2_e | 0.124***(0.003) | 0.124***(0.003) | 0.126***(0.003) | 0.125***(0.003) | 0.125***(0.003) | 0.008***(0.000) | |
| Hausman | 396.46 | 396.46 | 416.92 | 519.36 | 519.36 | 516.68 | |
| LR | 31.28 | 19.84 | 20.48 | ||||
| N | 2835 | 2835 | 2835 | 2835 | 2835 | 2835 | |
| R2 | 0.806 | 0.806 | 0.802 | 0.804 | 0.804 | 0.621 | |
表4 数字产品制造业发展对区县经济增长的直接效应与间接效应Tab.4 The direct and indirect effects of digital manufacturing on the economic growth of counties |
| 短期影响(SR) | 长期影响(LR) | ||||||
|---|---|---|---|---|---|---|---|
| 直接效应 | S1 | 1.443***(0.310) | - | - | 5.499***(1.120) | - | - |
| S3 | - | 0.027***(0.006) | - | - | 0.104***(0.021) | - | |
| entry | - | - | 0.051*(0.030) | - | - | 0.530(10.358) | |
| 间接效应 | S1 | 0.365(0.527) | - | - | 4.242*(2.394) | - | - |
| S3 | - | 0.007(0.010) | - | - | 0.081*(0.045) | - | |
| entry | - | - | -0.367***(0.115) | - | - | 0.207(10.378) | |
| 总效应 | S1 | 1.808***(0.469) | - | - | 9.740***(2.425) | - | - |
| S3 | - | 0.034***(0.009) | - | - | 0.185***(0.046) | - | |
| entry | - | - | -0.317**(0.131) | - | - | 0.737**(0.291) | |
| [1] |
彭文斌, 韩东初, 尹勇, 等. 京津冀地区数字经济的空间效应研究[J]. 经济地理, 2022, 42(5):136-143.
|
| [2] |
王俊豪, 周晟佳. 中国数字产业发展的现状、特征及其溢出效应[J]. 数量经济技术经济研究, 2021, 38(3):103-119.
|
| [3] |
张嫚. 论数字产业对传统反垄断理论与实践的启示[J]. 经济评论, 2002(4):103-106.
|
| [4] |
李俊江, 何枭吟. 美国数字经济探析[J]. 经济与管理研究, 2005(7):13-18.
|
| [5] |
康铁祥. 中国数字经济规模测算研究[J]. 当代财经, 2008(3):118-121.
|
| [6] |
宋旭光, 何佳佳, 左马华青. 数字产业化赋能实体经济发展:机制与路径[J]. 改革, 2022(6):76-90.
|
| [7] |
中国信息通信研究院. 中国数字经济发展与就业白皮书(2019年)[R]. 中国信息通信研究院研究报告, 2019.
|
| [8] |
中国信息通信研究院. 中国数字经济发展与就业白皮书(2020年)[R]. 中国信息通信研究院研究报告, 2020.
|
| [9] |
汪明峰. 互联网使用与中国城市化——“数字鸿沟”的空间层面[J]. 社会学研究, 2005(6):112-135.
|
| [10] |
邱泽奇, 张樹沁, 刘世定, 等. 从数字鸿沟到红利差异——互联网资本的视角[J]. 中国社会科学, 2016(10):93-115.
|
| [11] |
|
| [12] |
王彬燕, 田俊峰, 程利莎, 等. 中国数字经济空间分异及影响因素[J]. 地理科学, 2018, 38(6):859-868.
|
| [13] |
戴若尘, 王艾昭, 陈斌开. 中国数字经济核心产业创新创业:典型事实与指数编制[J]. 经济学动态, 2022(4):29-48.
|
| [14] |
毛丰付, 高雨晨, 周灿. 长江经济带数字产业空间格局演化及驱动因素[J]. 地理研究, 2022, 41(6):1593-1609.
|
| [15] |
张雪玲, 吴恬恬. 中国省域数字经济发展空间分化格局研究[J]. 调研世界, 2019(10):34-40.
|
| [16] |
舒季君, 周建平, 陈亦婷, 等. 中国省域数字经济的空间演化特征及其城乡融合效应[J]. 经济地理, 2022, 42(8):103-111.
|
| [17] |
钟业喜, 毛炜圣. 长江经济带数字经济空间格局及影响因素[J]. 重庆大学学报:社会科学版, 2020, 26(1):19-30.
|
| [18] |
武前波, 万为胜, 洪明. 杭州数字经济产业空间演变及其影响机制[J]. 经济地理, 2022, 42(12):60-71.
|
| [19] |
卢明华, 李丽. 北京电子信息产业及其价值链空间分布特征研究[J]. 地理研究, 2012, 31(10):1861-1871.
|
| [20] |
席强敏, 季鹏. 京津冀高技术制造业空间结构演变的经济绩效[J]. 经济地理, 2018, 38(11):112-122.
|
| [21] |
孙瑞东, 江曼琦. 大城市技术密集型制造业空间演化特征及动因分析——以北京市电子设备制造业为例[J]. 经济地理, 2018, 38(6):94-101.
|
| [22] |
段吕晗, 杜德斌, 黄筱彧. 上海互联网新创企业的时空演化及影响因素[J]. 地理科学进展, 2019, 38(3):383-394.
|
| [23] |
王家庭, 袁春来, 马宁. 数字经济发展对产业结构、产业效率的影响:来自省级层面的经验证据[J]. 中国科技论坛, 2022(12):117-127.
|
| [24] |
周夏伟, 杨彬如, 岳太青. 产业数字化、 引致创新与区域经济增长[J]. 经济体制改革, 2022(3):119-126.
|
| [25] |
|
| [26] |
肖旭, 戚聿东. 产业数字化转型的价值维度与理论逻辑[J]. 改革, 2019(8):61-70.
|
| [27] |
魏下海, 郭凯明, 吴春秀. 数字技术、 用工成本与企业搬迁选择[J]. 中国人口科学, 2021(1):104-116.
|
| [28] |
陈剑, 黄朔, 刘运辉. 从赋能到使能——数字化环境下的企业运营管理[J]. 管理世界, 2020, 36(2):117-128.
|
| [29] |
张立贤, 任浙豪, 陈斌, 等. 中国长时间序列逐年人造夜间灯光数据集(1984—2020)[DB]. 国家青藏高原科学数据中心, 2021.
|
| [30] |
窦睿音, 杨晓俊. 京津冀城市群不同类型制造业时空分异化与空间布局研究[J]. 生态经济, 2021, 37(12):83-90.
|
| [31] |
苑清敏, 谭欣. 京津冀高技术制造业协同发展研究[J]. 华东经济管理, 2022, 36(3):72-81.
|
| [32] |
江小涓. 服务全球化的发展趋势和理论分析[J]. 经济研究, 2008(2):4-18.
|
| [33] |
孙浦阳, 韩帅, 许启钦. 产业集聚对劳动生产率的动态影响[J]. 世界经济, 2013(3):33-53.
|
| [34] |
毛丰付, 张帆. 中国地区数字经济的演变:1994-2018[J]. 数量经济技术经济研究, 2021, 38(7):3-25.
|
| [35] |
刘修岩, 李松林, 陈子扬. 多中心空间发展模式与地区收入差距[J]. 中国工业经济, 2017(10):25-43.
|
| [36] |
朱纪广, 李小建. 产业集聚对区域经济高质量增长的影响效应——基于空间溢出效应视角[J]. 经济地理, 2022, 42(10):1-9.
|
/
| 〈 |
|
〉 |