
精准帮扶政策对县域经济增长助推效应及其收敛性实证研究
|
周力(1981—),男,博士,教授,研究方向为农业经济学、发展经济学。E-mail:zhouli_tree@126.com |
收稿日期: 2023-11-01
修回日期: 2024-04-23
网络出版日期: 2024-09-12
基金资助
国家社会科学基金重大项目(19ZDA117)
国家自然科学基金应急项目(72141011)
江苏省高校优势学科建设工程资助项目(PAPD)
Boosting Effect of Targeted Poverty Alleviation Policy on County Economic Growth and Its Convergence
Received date: 2023-11-01
Revised date: 2024-04-23
Online published: 2024-09-12
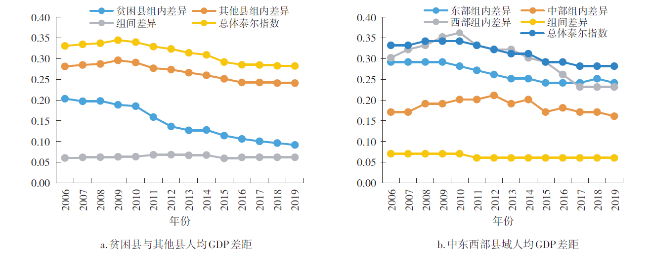
保障欠发达县域共享发展成果、实现经济协调发展,是我国精准帮扶政策的应有之义。文章基于2006—2019年中国县域数据,采用经济增长收敛方程展开实证分析。研究发现:①我国县域经济存在收敛性,精准帮扶政策可以提升欠发达县域的经济增长速度(β收敛)。从作用机制看,产业结构升级与财政效率提升是精准帮扶助推经济收敛的关键,这与新古典增长理论、新经济地理学或内生增长理论的假说机理都不相符。②精准帮扶期间中国县域经济收敛源于贫困县、非贫困县内部的差距缩小(俱乐部组内收敛),而以东西部协作为代表的结对精准帮扶不能显著缩小贫困县与非贫困县之间的差距(俱乐部组间收敛)。据此,提出我国应该依据欠发达县域的比较优势顺势而为,兼顾效率与公平,调整优化结对关系和帮扶方式,加强政府综合治理能力,借助产业政策、财税政策等振兴欠发达县域,实现共同富裕目标。
周力 , 邹璠 , 沈坤荣 . 精准帮扶政策对县域经济增长助推效应及其收敛性实证研究[J]. 经济地理, 2024 , 44(4) : 1 -11 . DOI: 10.15957/j.cnki.jjdl.2024.04.001
Ensuring that underdeveloped counties share the development achievement and realize coordinated development is indispensable goals of China's targeted poverty alleviation policy. Based on the county data from 2006 to 2019 in China,this paper conducts an empirical analysis using the convergence equation of economic growth. The results show that: 1) China's county economy has convergence,targeted poverty alleviation policy can enhance the economic growth rate of underdeveloped counties (β convergence). According to the mechanism analysis,industrial structure upgrade and financial efficiency improvement are the keys to promoting the economic convergence,which is inconsistent with the hypothesis of either Neoclassical Growth Theory, New Economic Geography or Endogenous Growth Theory. 2) Further analysis shows that the economic convergence of China's counties stems from reducing the gap between counties within the poor and non-poor groups (within club convergence) during the period of Targeted Poverty Alleviation. Pairing assistance by the eastern region-western region cooperation policy cannot narrow the economic gap between poor counties and others (intergroup club convergence). Taking into account both efficiency and equity,China should follow the comparative advantages of underdeveloped counties, adjust the pairing assistance relationships and improve assistance methods between the eastern region and the western region,and strengthen the management capacity of the government. To realize common prosperity, the government should revitalize underdeveloped counties through industrial,financial, and taxation policies.
表1 变量定义与描述统计Tab.1 Variable definitions and descriptive statistics |
| 变量 | 变量说明 | 均值 | 标准差 | 最小值 | 最大值 |
|---|---|---|---|---|---|
| 年人均GDP增长率 | 0.021 | 0.098 | 0.432 | 0.457 | |
| 滞后期人均GDP对数(万元,2006年价格) | 9.273 | 0.673 | 7.911 | 10.899 | |
| 1=精准帮扶实施期间属于贫困县,0=其他 | 0.135 | 0.342 | 0.000 | 1.000 | |
| 1=国家级贫困县,0=其他 | 0.379 | 0.485 | 0.000 | 1.000 | |
| 1=精准帮扶实施之后,0=其他 | 0.357 | 0.479 | 0.000 | 1.000 | |
| 人口密度(百人/km2) | 3.002 | 3.085 | 0.009 | 17.05 | |
| 固定资产投资额/GDP | 0.706 | 0.351 | 0.003 | 1.999 | |
| 公共财政支出/GDP | 0.265 | 0.221 | 0.049 | 1.034 | |
| 二三产业增加值/GDP | 0.780 | 0.120 | 0.435 | 0.981 | |
| 专利授权数量/人口数量(个/万人) | 3.730 | 11.062 | 0.000 | 107.9 | |
| 年末金融机构各项贷款余额/GDP | 0.529 | 0.301 | 0.002 | 1.718 | |
| 居民储蓄存款余额/GDP | 0.650 | 0.292 | 0.096 | 1.628 |
表2 县域经济β收敛及精准帮扶的助推作用分析Tab.2 β Convergence of county economy and the impact of targeted poverty alleviation |
| 因变量:年人均GDP增长率 | |||||||||
|---|---|---|---|---|---|---|---|---|---|
| 绝对收敛 | 俱乐部收敛 | 条件收敛 | 政策效应 | ||||||
| (1) | (2) | (3) | (4) | (5) | (6) | (7) | (8) | ||
| -0.045*** | -0.051*** | -0.060*** | -0.090*** | -0.600*** | -0.047** | -0.087*** | -0.599*** | ||
| (0.010) | (0.012) | (0.013) | (0.021) | (0.036) | (0.015) | (0.022) | (0.039) | ||
| 0.650* | 0.954** | 1.610*** | |||||||
| (0.297) | (0.356) | (0.186) | |||||||
| -0.069* | -0.102** | -0.175*** | |||||||
| (0.033) | (0.040) | (0.021) | |||||||
| -0.077*** | -0.083*** | ||||||||
| (0.016) | (0.018) | ||||||||
| -0.043** | -0.051** | -0.056** | |||||||
| (0.014) | (0.019) | (0.023) | |||||||
| -0.156* | -0.154* | -0.149* | -0.164* | 0.024 | -0.190* | -0.196** | 0.006 | ||
| (0.083) | (0.082) | (0.081) | (0.084) | (0.031) | (0.085) | (0.086) | (0.034) | ||
| -0.001 | -0.003* | -0.003** | -0.002 | ||||||
| (0.001) | (0.002) | (0.001) | (0.002) | ||||||
| 0.018** | 0.016 | 0.017 | 0.006 | ||||||
| (0.008) | (0.010) | (0.010) | (0.010) | ||||||
| -0.104** | -0.115** | -0.090** | -0.191*** | ||||||
| (0.041) | (0.047) | (0.039) | (0.050) | ||||||
| 0.085 | 0.601*** | 0.115* | 0.535*** | ||||||
| (0.051) | (0.090) | (0.053) | (0.091) | ||||||
| 0.001*** | -0.000 | 0.001*** | 0.0005 | ||||||
| (0.000) | (0.000) | (0.000) | (0.000) | ||||||
| 0.020* | -0.002 | 0.023 | -0.011 | ||||||
| (0.010) | (0.014) | (0.014) | (0.015) | ||||||
| -0.068** | -0.132*** | -0.060* | -0.195*** | ||||||
| (0.023) | (0.027) | (0.028) | (0.031) | ||||||
| 常数项 | 0.435*** | 0.514*** | 0.595*** | 0.863*** | 5.206*** | 0.510*** | 0.835*** | 5.316*** | |
| (0.092) | (0.112) | (0.128) | (0.170) | (0.318) | (0.150) | (0.194) | (0.350) | ||
| 东中西虚拟变量 | 否 | 是 | 否 | 否 | 否 | 否 | 否 | 否 | |
| 年份固定效应 | 否 | 否 | 否 | 否 | 是 | 否 | 否 | 是 | |
| 县固定效应 | 否 | 否 | 否 | 否 | 是 | 否 | 否 | 是 | |
| 样本量 | 24000 | 24000 | 24000 | 19319 | 19319 | 22000 | 17549 | 17549 | |
| R2 | 0.055 | 0.059 | 0.063 | 0.080 | 0.320 | 0.096 | 0.120 | 0.353 | |
表3 精准帮扶对县域经济收敛影响的稳健性检验Tab.3 Robustness tests of the impact of targeted poverty alleviation on county economy convergence |
| 因变量:年人均GDP增长率 | |||||||
|---|---|---|---|---|---|---|---|
| T=1 | T=2 | T=3 | T=4 | ||||
| 系统GMM | 2012—2019年 | 脱贫摘帽 | 空间杜宾 | ||||
| (1) | (2) | (3) | (4) | (5) | (6) | (7) | |
| -0.698***(0.100) | -0.805***(0.048) | -0.599***(0.039) | -0.074***(0.004) | -0.444***(0.027) | -0.371***(0.018) | -0.259***(0.010) | |
| 6.655***(1.675) | 1.748***(0.254) | 1.607***(0.188) | 0.283***(0.095) | 0.834***(0.118) | 0.524***(0.125) | 0.215***(0.052) | |
| -0.816***(0.184) | -0.191***(0.028) | -0.175***(0.021) | -0.029***(0.011) | -0.091***(0.013) | -0.057***(0.014) | -0.022***(0.006) | |
| 0.087**(0.037) | 0.074***(0.028) | 0.006(0.034) | -0.147***(0.009) | -0.020(0.020) | 0.011(0.013) | 0.035*(0.019) | |
| 0.013(0.013) | |||||||
| 常数项 | 3.043(1.989) | 6.957***(0.425) | 5.319***(0.351) | 0.462***(0.036) | 4.076***(0.251) | 3.556***(0.177) | 2.323***(0.105) |
| 其他条件变量 | 是 | 是 | 是 | 是 | 是 | 是 | 是 |
| 年份固定效应 | 是 | 是 | 是 | 是 | 是 | 是 | 是 |
| 县固定效应 | 是 | 是 | 是 | 是 | 是 | 是 | 是 |
| 样本量 | 17549 | 11478 | 17549 | 14087 | 8199 | 5035 | 3254 |
| R2 | - | 0.5 | 0.353 | 0.102 | 0.525 | 0.728 | 0.792 |
表4 影响机制分析第一阶段结果Tab.4 First stage results of mechanism analysis |
| (1) | (2) | (3) | (4) | (5) | (6) | (7) | |
|---|---|---|---|---|---|---|---|
| -0.112*(0.058) | -0.105***(0.021) | -0.097***(0.009) | 0.050***(0.004) | -0.104(0.308) | -0.109***(0.014) | -0.171***(0.016) | |
| -1.706***(0.660) | 0.153(0.188) | 0.178**(0.083) | 0.243***(0.029) | -7.893***(1.857) | 0.376**(0.166) | 0.432***(0.103) | |
| 0.190**(0.074) | -0.006(0.021) | -0.015(0.009) | -0.026***(0.003) | 0.520**(0.212) | -0.037**(0.019) | -0.044***(0.012) | |
| 0.020(0.031) | 0.074***(0.017) | 0.021***(0.005) | -0.002(0.002) | 0.537***(0.198) | 0.014(0.010) | 0.030***(0.009) | |
| 常数项 | 5.232***(0.525) | 1.415***(0.194) | 1.150***(0.081) | 0.297***(0.039) | 4.184(2.787) | 1.439***(0.127) | 2.201***(0.146) |
| 其他条件变量 | 否 | 否 | 否 | 否 | 否 | 否 | 否 |
| 年份固定效应 | 是 | 是 | 是 | 是 | 是 | 是 | 是 |
| 县固定效应 | 是 | 是 | 是 | 是 | 是 | 是 | 是 |
| 样本量 | 20690 | 17143 | 21992 | 22000 | 21920 | 177639 | 21931 |
| R2 | 0.940 | 0.671 | 0.908 | 0.920 | 0.813 | 0.750 | 0.869 |
表5 影响机制分析第二阶段结果Tab.5 Second stage results of mechanism analysis |
| 因变量:年人均GDP增长率 | |||||||
|---|---|---|---|---|---|---|---|
| (1) | (2) | (3) | (4) | (5) | (6) | (7) | |
| -0.431***(0.026) | -0.549***(0.038) | -0.480***(0.025) | -0.491***(0.026) | -0.420***(0.025) | -0.470***(0.029) | -0.507***(0.029) | |
| 1.274***(0.181) | 1.332***(0.200) | 1.329***(0.158) | 0.872***(0.168) | 1.230***(0.170) | 1.473***(0.189) | 1.417***(0.150) | |
| -0.139***(0.020) | -0.145***(0.022) | -0.142***(0.018) | -0.095***(0.019) | -0.133***(0.019) | -0.160***(0.021) | -0.152***(0.017) | |
| -0.035(0.028) | -0.027(0.040) | -0.026(0.027) | -0.035(0.027) | -0.040(0.028) | -0.032(0.030) | -0.023(0.027) | |
| -0.001(0.003) | |||||||
| -0.017(0.014) | |||||||
| -0.615***(0.048) | |||||||
| 1.411***(0.093) | |||||||
| 0.002***(0.000) | |||||||
| -0.184***(0.015) | |||||||
| -0.483***(0.027) | |||||||
| 常数项 | 4.005***(0.239) | 5.102***(0.344) | 4.610***(0.233) | 3.483***(0.218) | 3.896***(0.231) | 4.443***(0.265) | 5.010***(0.270) |
| 其他条件变量 | 否 | 否 | 否 | 否 | 否 | 否 | 否 |
| 年份固定效应 | 是 | 是 | 是 | 是 | 是 | 是 | 是 |
| 县固定效应 | 是 | 是 | 是 | 是 | 是 | 是 | 是 |
| 样本量 | 20690 | 17143 | 21992 | 22000 | 21920 | 19763 | 21931 |
| R2 | 0.306 | 0.372 | 0.347 | 0.353 | 0.305 | 0.333 | 0.372 |
表6 东西部协作对县域俱乐部组间收敛的影响Tab.6 Between-club convergence of county economy and the effect of eastern region-western region collaboration |
| 因变量:贫困县与其他县经济增速之差 | ||||
|---|---|---|---|---|
| (1) | (2) | (3) | (4) | |
| -0.001***(0.000) | -0.002***(0.000) | -0.003***(0.000) | -0.025***(0.001) | |
| 0.402(0.399) | 0.420(0.456) | 0.114(0.538) | -0.646(0.797) | |
| -0.022(0.027) | -0.035(0.039) | -0.005(0.036) | 0.048(0.054) | |
| -0.344***(0.001) | -0.397***(0.001) | -0.282***(0.001) | -0.712***(0.001) | |
| 常数项 | -0.060***(0.002) | 0.174***(0.003) | -0.000(0.002) | 0.279***(0.017) |
| 东中西配对虚拟变量 | 否 | 是 | 否 | 否 |
| 其他条件变量 | 否 | 否 | 是 | 是 |
| 年份固定效应 | 否 | 否 | 否 | 是 |
| 县配对固定效应 | 否 | 否 | 否 | 是 |
| 样本量 | 2451312 | 2451312 | 2096403 | 2096403 |
| R2 | 0.134 | 0.158 | 0.596 | 0.797 |
| [1] |
李芳华, 张阳阳, 郑新业. 精准扶贫政策效果评估——基于贫困人口微观追踪数据[J]. 经济研究, 2020, 55(8):171-187.
|
| [2] |
徐现祥, 李郇. 中国城市经济增长的趋同分析[J]. 经济研究, 2004(5):40-48.
|
| [3] |
|
| [4] |
|
| [5] |
|
| [6] |
蔡昉, 都阳. 中国地区经济增长的趋同与差异——对西部开发战略的启示[J]. 经济研究, 2000(10):30-37,80.
|
| [7] |
沈坤荣, 马俊. 中国经济增长的“俱乐部收敛”特征及其成因研究[J]. 经济研究, 2002(1):33-39,94-95.
|
| [8] |
戴觅, 茅锐. 产业异质性、 产业结构与中国省际经济收敛[J]. 管理世界, 2015(6):34-46,62,187.
|
| [9] |
|
| [10] |
|
| [11] |
马拴友, 于红霞. 转移支付与地区经济收敛[J]. 经济研究, 2003(3):26-33,90.
|
| [12] |
王志刚. 质疑中国经济增长的条件收敛性[J]. 管理世界, 2004(3):25-30.
|
| [13] |
|
| [14] |
|
| [15] |
陆铭, 李鹏飞, 钟辉勇. 发展与平衡的新时代——新中国70年的空间政治经济学[J]. 管理世界, 2019, 35(10):11-23,63,219.
|
| [16] |
林万龙, 孙颖. 精准到户?: 产业精准扶贫政策评价及下一步改革思考[J]. 中国农业大学学报:社会科学版, 2020, 37(6):12-21.
|
| [17] |
王立国, 李卓. 精准投资、 脱贫增收与乡村振兴——来自脱贫县(区)的实证研究[J]. 财经问题研究, 2022(12):69-81.
|
| [18] |
黄志平. 国家级贫困县的设立推动了当地经济发展吗?——基于PSM-DID方法的实证研究[J]. 中国农村经济, 2018(5):98-111.
|
| [19] |
张彬斌. 新时期政策扶贫、目标选择和农民增收[J]. 经济学(季刊), 2013, 12(3):959-982.
|
| [20] |
|
| [21] |
马光荣, 郭庆旺, 刘畅. 财政转移支付结构与地区经济增长[J]. 中国社会科学, 2016(9):105-125,207-208.
|
| [22] |
|
| [23] |
|
| [24] |
徐舒, 王貂, 杨汝岱. 国家级贫困县政策的收入分配效应[J]. 经济研究, 2020, 55(4):134-149.
|
| [25] |
张博胜, 曹筱杨. 精准扶贫政策对国家级贫困县城乡收入差距的影响[J]. 资源科学, 2021, 43(8):1549-1561.
|
| [26] |
刘梦航, 李俊伟, 李强. 精准扶贫政策对城乡居民收入差距的影响研究——以山西省为例[J]. 中国农业资源与区划, 2020, 41(8):228-237.
|
| [27] |
|
| [28] |
李卓, 封立涛. 农业减税降赋对经济现代化的促进作用——来自取消农业税的证据[J]. 经济评论, 2022(3):56-71.
|
| [29] |
吴敏, 周黎安. 财政压力的多层级传递与应对——基于取消农业税改革的研究[J]. 世界经济文汇, 2020(1):41-59.
|
| [30] |
|
| [31] |
陈诗一, 张军. 中国地方政府财政支出效率研究:1978—2005[J]. 中国社会科学, 2008(4):65-78,206.
|
| [32] |
李光泗, 徐翔. 技术引进与地区经济收敛[J]. 经济学(季刊), 2008, 7(3):983-996.
|
| [33] |
王仁祥, 王婧. 县域视角下的贫困、金融发展与经济增长——基于系统GMM方法的再检验[J]. 经济理论与经济管理, 2017(1):84-94.
|
| [34] |
潘文卿. 中国区域经济差异与收敛[J]. 中国社会科学, 2010(1):72-84,222-223.
|
| [35] |
吴国宝. 东西部扶贫协作困境及其破解[J]. 改革, 2017(8):57-61.
|
/
| 〈 |
|
〉 |