
风险与成本视阈下中国石油进口市场布局优化
|
葛明(1985—),男,博士,副教授,研究方向为全球价值链。E-mail:geming85@swu.edu.cn |
收稿日期: 2023-08-25
修回日期: 2024-01-15
网络出版日期: 2024-09-12
基金资助
国家社会科学基金项目(22BGJ042)
Optimizing the Layout of China's Petroleum Import Market from the Perspective of Overall Risk and Cost
Received date: 2023-08-25
Revised date: 2024-01-15
Online published: 2024-09-12
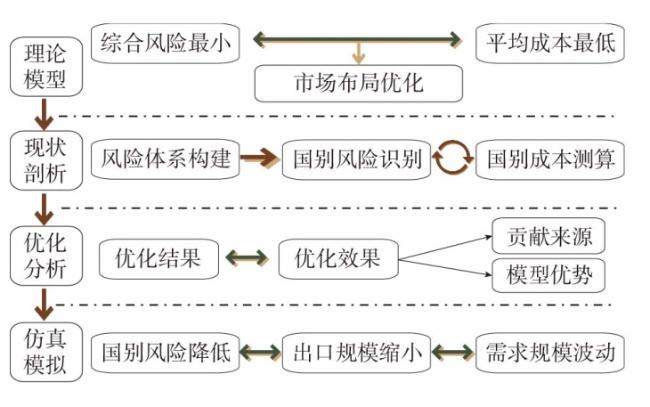
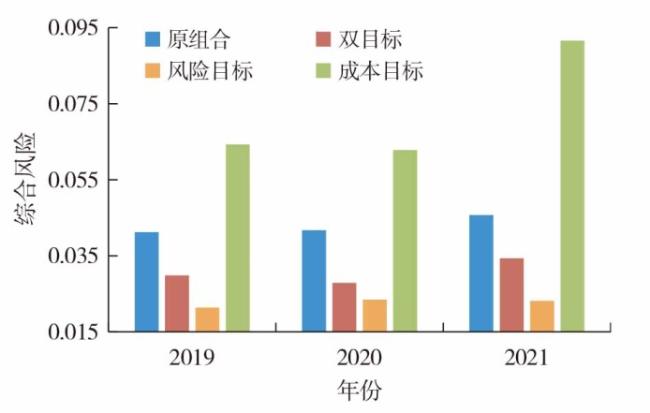
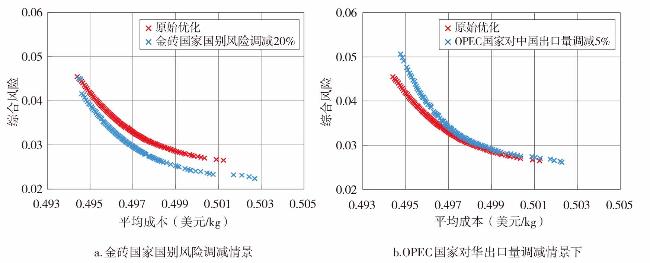
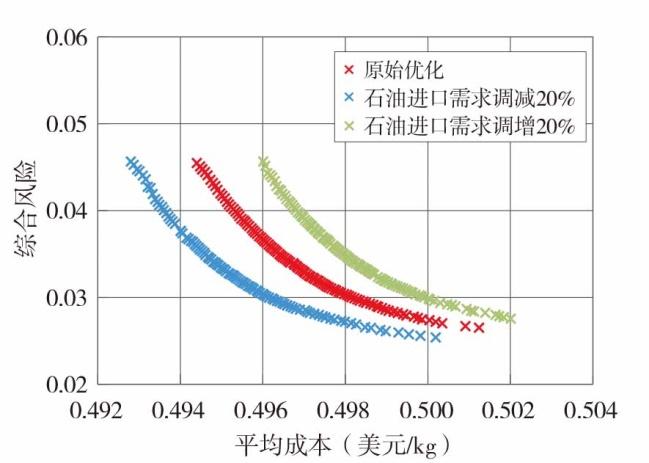
文章从供应链3个维度,选择8种指标构建了石油进口风险评价体系,在多维度识别2019—2021年中国石油进口国别风险的基础上,统筹综合风险最小与平均成本最低双重目标探究了石油进口市场布局优化策略,并模拟了3种潜在情境下的市场布局优化效果。结果表明:①中国石油进口风险、成本及其变动趋势存在显著的国别差异性,具有较大的优化空间。②优化后的市场布局倾向于增加自哥伦比亚、厄瓜多尔、马来西亚等国,而减少自沙特阿拉伯、安哥拉、英国等国的进口份额,如此既有利于降低综合风险,也有助于减少平均成本,其中降低风险的效果尤为显著,这主要归功于自沙特阿拉伯进口份额的优化。③中国石油进口需求增长和OPEC国家对华出口下降均显著加大了中国进口风险与成本,而金砖国家国别风险下降则大幅降低了中国进口综合风险。因此,中国应稳定大国经贸关系、大力发展新能源产业、积极优化市场布局以降低石油进口综合风险与平均成本,多维度健全风险预警与防控体系以保障进口供应链安全。
葛明 , 刘向昱 , 涂建军 , 赵素萍 . 风险与成本视阈下中国石油进口市场布局优化[J]. 经济地理, 2024 , 44(3) : 97 -107 . DOI: 10.15957/j.cnki.jjdl.2024.03.010
This study constructs an evaluation system of petroleum import risk based on three dimensions of the supply chain and eight selected indicators. After a multidimensional identification of the country-specific risks associated with China's petroleum imports from 2019 to 2021,the research explores strategies for optimizing the import market layout with dual objectives of minimizing overall risk and achieving the lowest average cost. The study also simulates the effects of market layout optimization under three potential scenarios. The results indicate the following: 1) Significant country-specific differences exist in the risks,costs,and their trends associated with China's petroleum imports,presenting substantial potential for optimization. 2) Optimized market layout tends to increase imports from countries such as Colombia,Ecuador,and Malaysia,and decrease shares from countries such as Saudi Arabia,Angola,and the United Kingdom. This approach is beneficial for lowering overall risks and assisting in reducing average costs. Notably,the effect of risk reduction is particularly significant,mainly attributed to the optimization of import shares from Saudi Arabia. 3) The growth in China's petroleum import demand and the significant decrease in OPEC countries' exports to China have increased the overall risks and costs of China's imports. However,the substantial reduction in country-specific risks from BRICS nations has significantly mitigated China's overall import risk. Therefore,China should focus on stabilizing economic relationships with major nations,promoting the development of new energy industries,actively optimizing market layouts to reduce overall petroleum import risks and average costs,and establishing a multidimensional risk warning and control system to ensure the security of the import supply chain.
Key words: market layout optimization; risk; cost; petroleum; import supply chain
表1 石油进口风险类别、指标、测度公式与数据来源Tab.1 Petroleum import risk categories,indicators,measurement formulas and data sources |
| 类别 | 类型 | 测度公式 | 数据来源 | 设定参考 |
|---|---|---|---|---|
| 依赖性风险 | 商品依赖风险 | UN Comtrade、《BP世界能源统计年鉴》 | 魏艳骄等[11] | |
| 贸易强度风险 | UN Comtrade、《BP世界能源统计年鉴》 | Qiang等[28] | ||
| 供给性风险 | 出口国政治风险 | 全球国家风险指南(ICRG) | Dong等[29] | |
| 出口国经济风险 | 全球国家风险指南(ICRG) | 祝孔超等[30] | ||
| 出口国金融风险 | 全球国家风险指南(ICRG) | 祝孔超等[30] | ||
| 双边政治关系风险 | 中华人民共和国外交部网站 | 邓富华等[32] | ||
| 交易性风险 | 物流运输风险 | HiFleet网站 | Zhang等[19] | |
| 价格波动风险 | UN Comtrade | Kong等[31] |
注: 、 、 表征j国政治、经济、金融风险,数值越大代表该国风险水平越低,最大值分别为100、50、50; 表征中国与伙伴外交关系等级; 表示各石油出口国与中国海运距离最大值; 表示出口国 与中国的海运距离; 为虚拟变量,若通过马六甲海峡为1,不通过为0; 表示新加坡、马来西亚与印度尼西亚三国军事政治指数的平均值,6为指数最大值; 表示考察期总数,此处为5年; 表示t时期 国石油价格; 表示i国石油进口数量; 表示i国石油产量; 表示j国石油出口总量; 表示j国石油产量; 表示i国自j国进出口总额; 表示j国进出口总额; 表示i国进出口总额; 表示世界进出口总额。 |
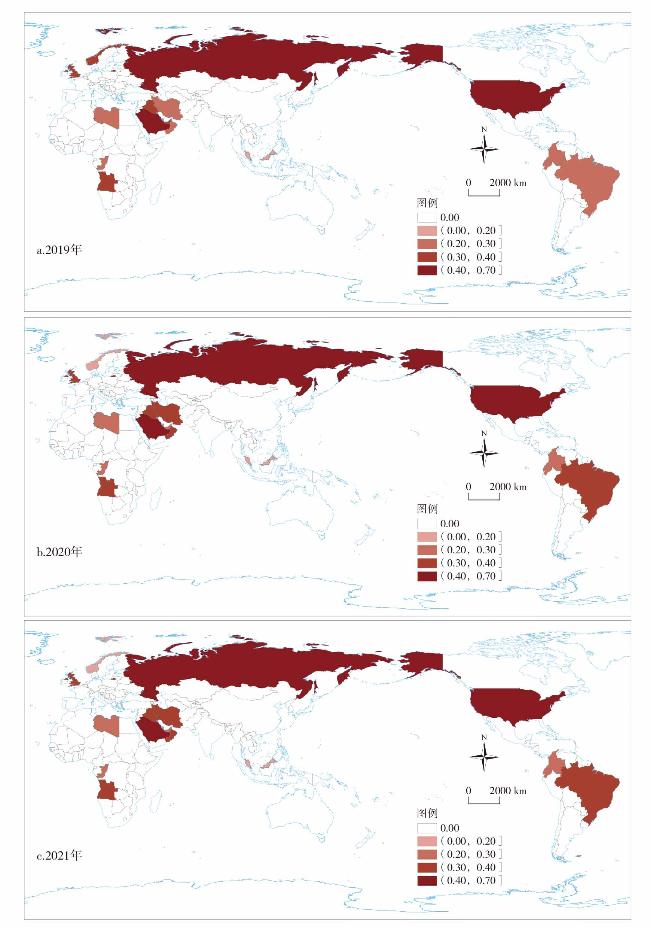
图2 2019—2021年中国石油进口国别风险注:该图基于自然资源部标准地图服务网站下载的审图号为GS(2016)1663号的标准地图制作,底图无修改。 Fig.2 Country risk map of China's petroleum import in 2019-2021 |
表2 中国石油进口风险、进口成本及国别结构Tab.2 China's petroleum import risks, import costs and country structure |
| 国家 | 2019 | 2020 | 2021 | |||||
|---|---|---|---|---|---|---|---|---|
| 进口 风险 | 进口 成本 | 进口 风险 | 进口 成本 | 进口 风险 | 进口 成本 | |||
| 安哥拉 | 0.3381 | 0.4906 | 0.3110 | 0.3390 | 0.3066 | 0.5071 | ||
| 巴西 | 0.2694 | 0.4776 | 0.2797 | 0.3385 | 0.2571 | 0.5068 | ||
| 哥伦比亚 | 0.2471 | 0.4239 | 0.2467 | 0.2853 | 0.2797 | 0.4586 | ||
| 刚果 | 0.2591 | 0.4777 | 0.2344 | 0.3289 | 0.2889 | 0.4866 | ||
| 厄瓜多尔 | 0.2406 | 0.4320 | 0.2428 | 0.2942 | 0.2360 | 0.4576 | ||
| 伊朗 | 0.2709 | 0.4794 | 0.2604 | 0.3343 | 0.2579 | 0.5678 | ||
| 伊拉克 | 0.3316 | 0.4604 | 0.3658 | 0.3199 | 0.4143 | 0.4893 | ||
| 哈萨克斯坦 | 0.2015 | 0.4857 | 0.1934 | 0.3175 | 0.1854 | 0.5404 | ||
| 科威特 | 0.2523 | 0.4766 | 0.2635 | 0.3268 | 0.2645 | 0.5076 | ||
| 利比亚 | 0.2620 | 0.5123 | 0.2378 | 0.4832 | 0.3028 | 0.5323 | ||
| 马来西亚 | 0.1895 | 0.4671 | 0.1684 | 0.3046 | 0.1694 | 0.4791 | ||
| 阿曼 | 0.2485 | 0.4895 | 0.3147 | 0.3405 | 0.3212 | 0.5014 | ||
| 挪威 | 0.3241 | 0.4883 | 0.2195 | 0.3423 | 0.2117 | 0.5130 | ||
| 卡塔尔 | 0.2626 | 0.5033 | 0.2198 | 0.3212 | 0.2293 | 0.5402 | ||
| 俄罗斯 | 0.5053 | 0.4820 | 0.5178 | 0.3318 | 0.5378 | 0.5090 | ||
| 沙特阿拉伯 | 0.6709 | 0.4821 | 0.6984 | 0.3305 | 0.6887 | 0.5017 | ||
| 阿联酋 | 0.3376 | 0.4926 | 0.2558 | 0.3187 | 0.2667 | 0.5127 | ||
| 英国 | 0.3137 | 0.5107 | 0.2676 | 0.3690 | 0.2454 | 0.5264 | ||
| 美国 | 0.4846 | 0.5226 | 0.5481 | 0.3239 | 0.5377 | 0.4908 | ||
| 平均值 | 0.0412 | 0.4803 | 0.0418 | 0.3293 | 0.0457 | 0.5028 | ||
注:本文中的进口成本、平均成本的单位均为“美元/kg”。 |
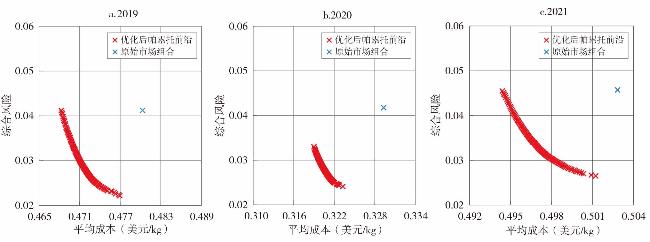
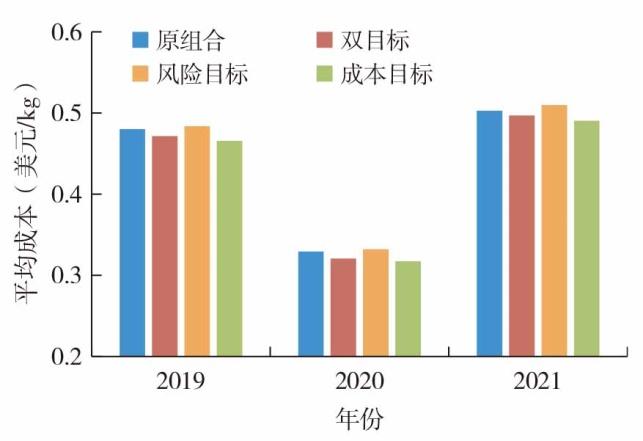
图3 中国石油进口市场份额分年度优化效果Fig.3 The results of the optimization of China's petroleum import market share on an annual basis |
表3 2019—2021年中国石油进口市场份额布局优化结果Tab.3 The optimization results of China's petroleum import market layout in 2019-2021 |
| 国家 | 2019 | 2020 | 2021 | ||||||||
|---|---|---|---|---|---|---|---|---|---|---|---|
| 优化前(%) | 优化后(%) | 变化(百分点) | 优化前(%) | 优化后(%) | 变化(百分点) | 优化前(%) | 优化后(%) | 变化(百分点) | |||
| 安哥拉 | 9.36 | 1.63 | -7.73 | 7.71 | 2.04 | -5.66 | 7.63 | 6.29 | -1.35 | ||
| 巴西 | 7.94 | 8.80 | 0.86 | 7.79 | 2.61 | -5.19 | 5.91 | 6.94 | 1.04 | ||
| 哥伦比亚 | 2.59 | 5.66 | 3.06 | 2.28 | 5.48 | 3.20 | 1.84 | 5.00 | 3.16 | ||
| 刚果 | 2.36 | 2.92 | 0.55 | 1.71 | 2.17 | 0.46 | 1.74 | 2.36 | 0.62 | ||
| 厄瓜多尔 | 0.41 | 3.86 | 3.45 | 0.87 | 3.67 | 2.80 | 0.83 | 3.78 | 2.95 | ||
| 伊朗 | 2.92 | 5.52 | 2.60 | 0.72 | 0.61 | -0.11 | 0.05 | 0.00 | -0.05 | ||
| 伊拉克 | 10.24 | 15.26 | 5.02 | 11.09 | 8.70 | -2.39 | 10.54 | 12.43 | 1.88 | ||
| 哈萨克斯坦 | 0.54 | 6.34 | 5.80 | 0.67 | 8.98 | 8.31 | 0.88 | 0.88 | 0.01 | ||
| 科威特 | 4.49 | 9.75 | 5.27 | 5.07 | 7.82 | 2.75 | 5.88 | 6.27 | 0.39 | ||
| 利比亚 | 1.86 | 0.18 | -1.67 | 0.31 | 0.00 | -0.31 | 1.20 | 0.19 | -1.00 | ||
| 马来西亚 | 2.38 | 5.66 | 3.28 | 2.30 | 4.93 | 2.63 | 3.61 | 6.18 | 2.57 | ||
| 阿曼 | 6.70 | 2.89 | -3.81 | 6.99 | 1.67 | -5.32 | 8.74 | 8.76 | 0.02 | ||
| 挪威 | 0.20 | 2.58 | 2.38 | 2.35 | 1.25 | -1.10 | 2.57 | 4.19 | 1.62 | ||
| 卡塔尔 | 0.17 | 0.42 | 0.25 | 1.14 | 6.68 | 5.54 | 1.53 | 0.03 | -1.50 | ||
| 俄罗斯 | 15.35 | 15.36 | 0.01 | 15.40 | 15.40 | 0.01 | 15.53 | 15.53 | 0.01 | ||
| 沙特阿拉伯 | 16.48 | 2.43 | -14.05 | 15.67 | 2.52 | -13.14 | 17.07 | 3.94 | -13.13 | ||
| 阿联酋 | 3.02 | 1.26 | -1.76 | 5.75 | 13.35 | 7.60 | 6.23 | 3.51 | -2.71 | ||
| 英国 | 2.48 | 0.20 | -2.28 | 1.09 | 0.00 | -1.09 | 1.55 | 0.46 | -1.09 | ||
| 美国 | 1.26 | 0.05 | -1.21 | 3.65 | 4.65 | 1.01 | 2.24 | 8.80 | 6.56 | ||
注:“优化后”份额指市场布局优化后,算法模拟的帕累托前沿面上各国市场份额平均值;“变化”值等于优化后份额减去优化前份额;上述指标单位均为%。 |
表4 2019—2021年中国石油进口市场布局优化效果Tab.4 The optimization effect of the layout of China's petroleum import market in 2019-2021 |
| 效果 | 类型 | 2019 | 2020 | 2021 |
|---|---|---|---|---|
| 综合风险 | 优化前 | 0.0412 | 0.0418 | 0.0457 |
| 优化后 | 0.0298 | 0.0279 | 0.0343 | |
| 降幅(%) | 27.6100 | 33.2100 | 24.8800 | |
| 平均成本 | 优化前 | 0.4803 | 0.3293 | 0.5028 |
| 优化后 | 0.4716 | 0.3207 | 0.4970 | |
| 降幅(%) | 1.8100 | 2.6300 | 1.1600 |
注:优化后综合风险与平均成本为帕累托前沿各点的均值。降幅为优化后效果除以优化前效果减去1,以百分数表示。表5同。 |
表5 2019—2021年中国石油进口布局优化效果的贡献源Tab.5 The source of contribution to the optimization effect of China's petroleum import layout in 2019-2021 |
| 国家 | 成本贡献率(%) | 风险贡献率(%) | |||||
|---|---|---|---|---|---|---|---|
| 2019 | 2020 | 2021 | 2019 | 2020 | 2021 | ||
| 安哥拉 | 10.07 | 6.81 | 1.01 | -9.79 | -6.57 | -3.05 | |
| 巴西 | 0.28 | 5.94 | -0.71 | 2.85 | -7.52 | 2.82 | |
| 哥伦比亚 | 21.94 | 17.61 | 25.04 | 4.98 | 4.18 | 0.40 | |
| 刚果 | 0.16 | 0.00 | 1.79 | 0.55 | 0.30 | 0.44 | |
| 厄瓜多尔 | 21.19 | 12.25 | 24.00 | 2.99 | 2.16 | 3.08 | |
| 伊朗 | 0.28 | 0.07 | 0.54 | 3.84 | 0.00 | 0.00 | |
| 伊拉克 | 12.66 | -2.82 | 4.53 | 18.64 | -3.65 | 4.02 | |
| 哈萨克斯坦 | -3.95 | 12.36 | -0.03 | 9.67 | 16.57 | 0.00 | |
| 科威特 | 2.45 | 0.87 | -0.34 | 14.62 | 5.55 | 1.18 | |
| 利比亚 | 6.80 | 6.00 | 5.28 | -0.52 | 0.00 | -0.18 | |
| 马来西亚 | 5.54 | 8.12 | 10.93 | 6.53 | 4.28 | 7.20 | |
| 阿曼 | 4.46 | 7.40 | 0.00 | -6.76 | -5.30 | 0.10 | |
| 挪威 | -2.41 | 1.78 | -2.97 | 1.01 | -0.56 | 4.67 | |
| 卡塔尔 | -0.71 | 5.62 | 10.02 | 0.15 | 8.14 | -0.53 | |
| 俄罗斯 | 0.00 | 0.00 | 0.00 | 0.00 | 0.00 | 0.00 | |
| 沙特阿拉伯 | 3.21 | 1.88 | -2.62 | 46.63 | 37.64 | 47.17 | |
| 阿联酋 | 2.75 | 10.09 | 4.79 | -0.69 | 24.50 | -4.51 | |
| 英国 | 8.79 | 5.37 | 4.62 | -0.83 | -0.22 | -0.31 | |
| 美国 | 6.49 | 0.67 | 14.13 | 0.00 | -0.42 | -2.97 | |
| 市场集中度 | - | - | - | 6.13 | 20.92 | 36.82 | |
| [1] |
沈镭, 张红丽, 钟帅, 等. 新时代下中国自然资源安全的战略思考[J]. 自然资源学报, 2018, 33(5):721-734.
|
| [2] |
|
| [3] |
|
| [4] |
|
| [5] |
刘浩旻, 张在旭. 国际油价波动背景下中国石油安全评价研究[J]. 中国石油大学学报:社会科学版, 2018, 34(6):21-28.
|
| [6] |
杜志雄, 高鸣, 韩磊. 供给侧进口端变化对中国粮食安全的影响研究[J]. 中国农村经济, 2021(1):15-30.
|
| [7] |
|
| [8] |
邓超, 吴志平, 李诗雨, 等. 人民币原油期货是否具有国际影响力?——基于东南亚金融市场的实证研究[J]. 财经理论与实践, 2023, 44(2):25-31.
|
| [9] |
方雯, 程淑佳, 葛紫珺. 我国原油进口地域多元化存在的主要问题及优化策略[J]. 经济纵横, 2016, 370(9):68-72.
|
| [10] |
鄢继尧, 赵媛, 崔盼盼, 等. 石油安全视角下中国原油进口贸易时空格局演化分析[J]. 经济地理, 2020, 40(11):112-120.
|
| [11] |
魏艳骄, 张慧艳, 朱晶. 新发展格局下中国大豆进口依赖性风险及市场布局优化分析[J]. 中国农村经济, 2021(12):66-86.
|
| [12] |
李永, 付智博, 李海英. 中国石油进口贸易联系稳定性测度——对1992—2012年经验数据的考察[J]. 管理评论, 2016, 28(9):17-30.
|
| [13] |
曹峰毓. 俄罗斯的“欧佩克+”政策:从积极参与到消极应对[J]. 国际论坛, 2020, 22(5):136-154,160.
|
| [14] |
郝俊, 孙晓蕾, 李建平. 基于双边贸易关系的中国原油进口组合多目标优化研究[J]. 中国石油大学学报:社会科学版, 2019, 35(6):1-9.
|
| [15] |
朱民,
|
| [16] |
常泽鲲. 世界石油地缘新图景下的石油安全问题——兼对中国石油安全问题的战略思考[J]. 国际问题研究, 2004(2):67-69,33.
|
| [17] |
李岩, 王礼茂. 从地缘政治角度看中国石油进口运输安全[J]. 资源科学, 2008, 30(12):1784-1790.
|
| [18] |
郎一环, 王礼茂. 石油地缘政治格局的演变态势及中国的政策响应[J]. 资源科学, 2008, 30(12):1778-1783.
|
| [19] |
|
| [20] |
|
| [21] |
张阿玲, 王翠萍. 用H方法分析我国的石油供应安全[J]. 中国软科学, 2002(11):110-113.
|
| [22] |
|
| [23] |
|
| [24] |
|
| [25] |
王尧, 吕靖. 中国原油进口运输通道安全研究[J]. 大连海事大学学报, 2014, 40(1):109-112,116.
|
| [26] |
|
| [27] |
卢昱嘉, 陈秧分, 洪宇. 兼顾风险和成本的中国大豆进口布局优化[J]. 经济地理, 2022, 42(12):104-114.
|
| [28] |
|
| [29] |
|
| [30] |
祝孔超, 牛叔文, 赵媛, 等. 中国原油进口来源国供应安全的定量评估[J]. 自然资源学报, 2020, 35(11):2629-2644.
|
| [31] |
|
| [32] |
邓富华, 霍伟东, 张永山. 双边政治关系与跨境贸易人民币结算——基于国际政治经济学视角的实证分析[J]. 国际贸易问题, 2018(1):154-163.
|
| [33] |
沈逸. 金砖机制扩容彰显开放与包容[J]. 当代世界, 2023(9):76-77.
|
| [34] |
李哲. OPEC+减产超160万桶/日国际油价短期或震荡走高[N]. 中国经营报,2023-04-10(B15).
|
/
| 〈 |
|
〉 |