
借用规模视角下中国城市收缩时空特征及其空间溢出效应
|
陈姝兴(1991—),女,博士,副教授,硕士生导师,研究方向为空间政治经济学、区域经济学。E-mail:chensx@swufe.edu.cn |
收稿日期: 2023-03-10
修回日期: 2023-10-30
网络出版日期: 2024-09-12
基金资助
国家自然科学基金面上项目(42171216)
教育部人文社会科学规划基金项目(19YJA790092)
Spatiotemporal Characteristics and Spatial Spillover Effects of Urban Shrinkage in China: Based on the Perspective of Borrowed Size
Received date: 2023-03-10
Revised date: 2023-10-30
Online published: 2024-09-12
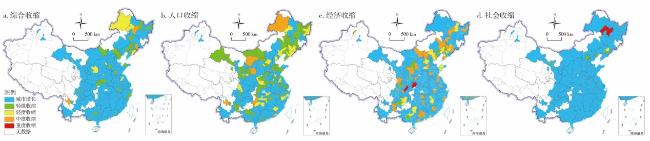
近年来中国城市收缩现象日益突出,客观准确识别城市收缩现象并探究其影响因素,对于新型城镇化建设具有重要意义。文章以2011—2018年中国286个地级及以上城市为研究对象,通过构建城市收缩指数测度指标体系,从功能规模借用和绩效规模借用的视角,对城市面板数据采用双固定效应模型、空间杜宾模型和面板门限模型等方法,实证检验了城市收缩的影响因素。研究发现:①中国城市在时间维度和空间维度上都出现增长与收缩并存现象,不同类型收缩城市数量、收缩程度和区域分布都存在显著差异。②功能规模借用和绩效规模借用2种效应在城市群和非城市群中均表现出异质性,并存在“空间溢出效应”现象。功能层面以规模借用形式存在,在全国范围内效应都显著;绩效层面则以集聚阴影形式存在,在非城市群中效应不显著。③借用规模因城市规模不同对城市收缩呈现非线性影响,功能规模借用水平表现为大城市>小城市>中型城市,而在绩效层面中小城市表现为集聚阴影,大城市则表现为绩效规模借用。
陈姝兴 , 丁登龙 , 吴康 . 借用规模视角下中国城市收缩时空特征及其空间溢出效应[J]. 经济地理, 2024 , 44(3) : 66 -75 . DOI: 10.15957/j.cnki.jjdl.2024.03.007
In recent years,the phenomenon of urban shrinkage has become increasingly prominent in China. It is of great significance to objectively and accurately identify the phenomenon of urban shrinkage and explore its influencing factors for the construction of new urbanization. This study meticulously examines this phenomenon by focusing on 286 prefecture-level cities of China from 2011 to 2018. It constructs comprehensive evaluation system of urban shrinkage,empirically tests the impact factors of urban shrinkage using the methods of the two-way fixed effects model,spatial Durbin model,and panel threshold model from the perspective of borrowed size. It's found that: 1) Chinese cities which exhibit a unique duality shrink and grow simultaneously within the same geographical confines. Moreover,shrinking cities are not a homogeneous group,it exhibits significant disparities in terms of their numbers,shrinkage degree,and regional distribution. 2) The borrowed function effect and the borrowed performance effect both show heterogeneity in urban agglomerations and non-urban agglomerations,and there is a phenomenon of "spatial spillover effect". The functional level exists in the form of scale borrowing,and the effect is significant throughout the country. The performance level exists in the form of agglomeration shadow,and the effect is not significant in non-urban agglomerations. 3) Borrowed size has a non-linear effect on urban shrinkage due to different city sizes. The order of functional scale borrowing level from high to low is big-sized cities,small-sized cities,medium-sized cities. Small and medium-sized cities show agglomeration shadow,while big-sized cities show performance scale borrowing at the performance level.
表1 城市收缩指数测度指标体系及权重系数Tab.1 Evaluation index system and weighting coefficients of urban shrinkage |
| 目标层 | 准则层 | 权重 | 指标层 | 权重 |
|---|---|---|---|---|
| 城市收 缩指数 | 人口收缩 | 0.5 | 市辖区城区常住人口 | 0.477 |
| 市辖区单位从业人员 | 0.523 | |||
| 经济收缩 | 0.3 | 市辖区人均GDP | 0.420 | |
| 市辖区人均财政收入 | 0.580 | |||
| 社会收缩 | 0.2 | 市辖区人均住房居住面积 | 0.382 | |
| 市辖区社会消费品零售总额 | 0.618 |
表2 中国收缩城市分级分类统计Tab.2 Classification statistics of shrinking cities in China according to the shrink level |
| 类别 | 城市群(161个城市) | 非城市群(125个城市) | |||||||||||||||||||
|---|---|---|---|---|---|---|---|---|---|---|---|---|---|---|---|---|---|---|---|---|---|
| 重度收缩 | 中度收缩 | 轻度收缩 | 轻微收缩 | 收缩总数 | 重度收缩 | 中度收缩 | 轻度收缩 | 轻微收缩 | 收缩总数 | ||||||||||||
| 数量(个) | 比例(%) | 数量(个) | 比例(%) | 数量(个) | 比例(%) | 数量(个) | 比例(%) | 数量(个) | 比例(%) | 数量(个) | 比例(%) | 数量(个) | 比例(%) | 数量(个) | 比例(%) | 数量(个) | 比例(%) | 数量(个) | 比例(%) | ||
| 综合收缩 | 0 | 0.00 | 1 | 6.67 | 1 | 6.67 | 13 | 86.67 | 15 | 9.32 | 0 | 0.00 | 2 | 8.70 | 6 | 26.09 | 15 | 65.22 | 23 | 18.40 | |
| 人口收缩 | 0 | 0.00 | 3 | 4.92 | 17 | 27.87 | 41 | 67.21 | 61 | 37.89 | 0 | 0.00 | 5 | 7.69 | 19 | 29.23 | 41 | 63.08 | 65 | 52.00 | |
| 经济收缩 | 1 | 3.13 | 16 | 50.00 | 10 | 31.25 | 5 | 15.63 | 32 | 19.88 | 1 | 2.78 | 17 | 47.22 | 12 | 33.33 | 6 | 16.67 | 36 | 28.80 | |
| 社会收缩 | 2 | 66.67 | 0 | 0.00 | 0 | 0.00 | 1 | 33.33 | 3 | 1.86 | 0 | 0.00 | 0 | 0.00 | 1 | 20.00 | 4 | 80.00 | 5 | 4.00 | |
表3 中国收缩城市按城市群分类统计Tab.3 Statistics of China's shrinking cities based on urban agglomerations |
| 城市群 | 京津冀 | 长江中游 | 哈长 | 成渝 | 长江三角洲 | 中原 | 北部湾 | 关中平原 | 呼包鄂榆 | 兰西 | 珠江三角洲 | 合计 | ||||||||||||
|---|---|---|---|---|---|---|---|---|---|---|---|---|---|---|---|---|---|---|---|---|---|---|---|---|
| 数量 (个) | 比例 (%) | 数量 (个) | 比例 (%) | 数量 (个) | 比例 (%) | 数量 (个) | 比例 (%) | 数量 (个) | 比例 (%) | 数量 (个) | 比例 (%) | 数量 (个) | 比例 (%) | 数量 (个) | 比例 (%) | 数量 (个) | 比例 (%) | 数量 (个) | 比例 (%) | 数量 (个) | 比例 (%) | 数量 (个) | 比例 (%) | |
| 综合收缩 | 3 | 20.00 | 0 | 0.00 | 4 | 26.67 | 1 | 6.67 | 4 | 26.67 | 2 | 13.33 | 1 | 6.67 | 0 | 0.00 | 0 | 0.00 | 0 | 0.00 | 0 | 0.00 | 15 | 100.00 |
| 人口收缩 | 3 | 4.92 | 9 | 14.75 | 6 | 9.84 | 5 | 8.20 | 9 | 14.75 | 15 | 24.59 | 2 | 3.28 | 3 | 4.92 | 3 | 4.92 | 3 | 4.92 | 3 | 4.92 | 61 | 100.00 |
| 经济收缩 | 5 | 15.63 | 4 | 12.50 | 3 | 9.38 | 3 | 9.38 | 4 | 12.5 | 3 | 9.40 | 2 | 6.25 | 1 | 3.13 | 1 | 3.13 | 0 | 0.00 | 6 | 18.75 | 32 | 100.00 |
| 社会收缩 | 1 | 33.33 | 0 | 0.00 | 2 | 66.67 | 0 | 0.00 | 0 | 0.00 | 0 | 0.00 | 0 | 0.00 | 0 | 0.00 | 0 | 0.00 | 0 | 0.00 | 0 | 0.00 | 3 | 100.00 |
表4 全国样本情形下模型估计结果Tab.4 Model estimation results according to the national sample case |
| 被解释变量:US | 模型一 | 模型二 | 模型三 |
|---|---|---|---|
| Bor_Fun | 0.058***(0.013) | 0.032**(0.014) | |
| Bor_Per | -0.071***(0.021) | -0.060***(0.023) | |
| Ind_str | 0.019***(0.006) | 0.018***(0.006) | 0.018***(0.006) |
| Employment | 0.016**(0.007) | 0.016**(0.007) | 0.016**(0.007) |
| Education | -0.009***(0.003) | -0.009***(0.003) | -0.009***(0.003) |
| Technology | 0.016**(0.008) | 0.013*(0.007) | 0.013*(0.007) |
| Inv_con | 0.268***(0.060) | 0.280***(0.057) | 0.277***(0.058) |
| Finance | 0.104*(0.054) | 0.095*(0.049) | 0.098*(0.050) |
| Life | 0.041***(0.007) | 0.042***(0.007) | 0.042***(0.007) |
| Environment | 0.085***(0.032) | 0.094***(0.031) | 0.094***(0.031) |
| Traffic | 0.090***(0.034) | 0.087***(0.033) | 0.089***(0.034) |
| Infrastructure | 0.041*(0.022) | 0.041*(0.022) | 0.041*(0.022) |
| Eco_exp | 0.096***(0.013) | 0.095***(0.013) | 0.094***(0.013) |
| Medical | -0.064**(0.032) | -0.066**(0.032) | -0.066**(0.032) |
| Cons | 0.005(0.009) | 0.044***(0.010) | 0.034**(0.014) |
表5 城市群样本情形下模型估计结果Tab.5 Model estimation results according to the sample case of urban agglomerations |
| 被解释变量:US | 模型一 | 模型二 | 模型三 |
|---|---|---|---|
| Bor_Fun | 0.041**(0.016) | 0.030*(0.017) | |
| Bor_Per | -0.094***(0.019) | -0.052***(0.013) | |
| Ind_str | 0.019**(0.009) | 0.018**(0.009) | 0.018**(0.009) |
| Employment | 0.017***(0.004) | 0.017***(0.004) | 0.025***(0.004) |
| Education | -0.004(0.004) | -0.004(0.004) | -0.004(0.004) |
| Technology | 0.011*(0.006) | 0.006(0.006) | 0.006(0.006) |
| Inv_con | 0.319***(0.072) | 0.341***(0.070) | 0.339***(0.070) |
| Finance | 0.152**(0.064) | 0.144**(0.056) | 0.145**(0.057) |
| Life | 0.045***(0.012) | 0.047***(0.012) | 0.047***(0.012) |
| Environment | 0.091***(0.019) | 0.098***(0.019) | 0.098***(0.019) |
| Traffic | 0.091***(0.030) | 0.098***(0.028) | 0.098***(0.028) |
| Infrastructure | 0.040(0.024) | 0.040*(0.023) | 0.040*(0.023) |
| Eco_exp | 0.070***(0.020) | 0.066***(0.020) | 0.066***(0.020) |
| Medical | -0.093***(0.033) | -0.093***(0.032) | -0.093***(0.032) |
| Cons | 0.003(0.012) | 0.052**(0.021) | 0.047**(0.023) |
表6 非城市群样本情形下模型估计结果Tab.6 Model estimation results according to the sample case of non-urban agglomerations |
| 被解释变量:US | 模型一 | 模型二 | 模型三 |
|---|---|---|---|
| Bor_Fun | 0.080**(0.040) | 0.062**(0.029) | |
| Bor_Per | -0.034*(0.019) | -0.020(0.015) | |
| Ind_str | 0.020***(0.005) | 0.021***(0.005) | 0.020***(0.005) |
| Employment | 0.011**(0.004) | 0.012**(0.004) | 0.011**(0.004) |
| Education | -0.012***(0.004) | -0.011***(0.004) | -0.012***(0.004) |
| Technology | 0.017***(0.006) | 0.018***(0.006) | 0.017***(0.006) |
| Inv_con | 0.136**(0.058) | 0.142**(0.058) | 0.137**(0.058) |
| Finance | 0.074*(0.040) | 0.066*(0.040) | 0.073*(0.040) |
| Life | 0.042***(0.006) | 0.042***(0.006) | 0.042***(0.006) |
| Environment | 0.050**(0.022) | 0.056**(0.023) | 0.055**(0.023) |
| Traffic | -0.085*(0.049) | -0.086*(0.048) | -0.084*(0.049) |
| Infrastructure | 0.016(0.021) | 0.015(0.021) | 0.016(0.021) |
| Eco_exp | 0.098***(0.013) | 0.100***(0.014) | 0.098***(0.013) |
| Medical | 0.067**(0.033) | 0.073**(0.032) | 0.066**(0.033) |
| Cons | 0.008(0.007) | 0.032***(0.006) | 0.018*(0.010) |
表7 城市群与非城市群边界效应考察估计结果Tab.7 Results of the border effects between urban agglomerations and non-urban agglomerations |
| 被解释变量:US | 全国层面 | 城市群层面 | 非城市群层面 |
|---|---|---|---|
| Bor_Fun | 0.020**(0.009) | 0.017*(0.010) | 0.064*(0.035) |
| Bor_Per | -0.090***(0.016) | -0.077***(0.016) | -0.039(0.035) |
| Bor_Fun·Border | 0.040(0.048) | 0.080(0.056) | -0.015(0.061) |
| Bor_Per·Border | 0.053**(0.022) | 0.071**(0.029) | 0.020(0.032) |
| 控制变量 | 控制 | 控制 | 控制 |
| Cons | 0.033***(0.012) | 0.015(0.012) | 0.022**(0.010) |
表8 全国样本情形下空间杜宾模型的估计结果Tab.8 Results of the spatial Durbin model for the national-level sample |
| 被解释变量:US | 反距离空间矩阵 | 邻近空间矩阵 | |||||
|---|---|---|---|---|---|---|---|
| 直接效应 | 间接效应 | 总效应 | 直接效应 | 间接效应 | 总效应 | ||
| Bor_Fun | -0.036**(0.016) | 0.662***(0.155) | 0.626***(0.151) | 0.018(0.014) | 0.036(0.028) | 0.053*(0.029) | |
| Bor_Per | -0.026*(0.015) | -0.052(0.090) | -0.079(0.084) | -0.025*(0.013) | -0.039*(0.022) | -0.064***(0.021) | |
| ρ | 0.332***(0.126) | 0.225***(0.025) | |||||
| [1] |
龙瀛, 吴康, 王江浩. 中国收缩城市及其研究框架[J]. 现代城市研究, 2015(9):14-19.
|
| [2] |
吴康, 孙东琪. 城市收缩的研究进展与展望[J]. 经济地理, 2017, 37(11):59-67.
|
| [3] |
张明斗, 曲峻熙. 中国广义城市收缩的空间格局与生成逻辑研究——基于人口总量和经济规模的视角[J]. 经济学家, 2020(1):77-85.
|
| [4] |
|
| [5] |
|
| [6] |
|
| [7] |
|
| [8] |
张帅, 王成新, 王敬, 等. 中国城市收缩的综合测度及其时空分异特征研究[J]. 中国人口·资源与环境, 2020, 30(8):72-82.
|
| [9] |
姚常成, 宋冬林, 范欣. 城市“规模”偏小不利于经济增长吗?——两种借用规模视角下的再审视[J]. 中国人口·资源与环境, 2020, 30(8):62-71.
|
| [10] |
王飞. 城市借用规模研究综述[J]. 现代城市研究, 2017(2):120-124.
|
| [11] |
李顺成,
|
| [12] |
陆军, 毛文峰. 城市网络外部性的崛起:区域经济高质量一体化发展的新机制[J]. 经济学家, 2020(12):62-70.
|
| [13] |
|
| [14] |
姚常成, 宋冬林. 借用规模, 网络外部性与城市群集聚经济[J]. 产业经济研究, 2019(2):76-87.
|
| [15] |
杨继军, 刘依凡, 陈旭, 等. 城市群空间功能分工、规模功能借用与企业出口增加值[J]. 经济科学, 2021(5):68-83.
|
| [16] |
|
| [17] |
|
| [18] |
高新雨. 城市收缩问题研究进展[J]. 经济学动态, 2021(3):145-158.
|
| [19] |
吴康, 龙瀛, 杨宇. 京津冀与长江三角洲的局部收缩:格局,类型与影响因素识别[J]. 现代城市研究, 2015(9):26-35.
|
| [20] |
|
| [21] |
|
| [22] |
|
| [23] |
|
| [24] |
|
| [25] |
|
| [26] |
张学良, 张明斗, 肖航. 成渝城市群城市收缩的空间格局与形成机制研究[J]. 重庆大学学报:社会科学版, 2018, 24(6):1-14.
|
| [27] |
丁任重, 许渤胤, 张航. 城市群能带动区域经济增长吗?——基于7个国家级城市群的实证分析[J]. 经济地理, 2021, 41(5):37-45.
|
| [28] |
|
| [29] |
|
| [30] |
刘修岩, 李松林, 秦蒙. 城市空间结构与地区经济效率——兼论中国城镇化发展道路的模式选择[J]. 管理世界, 2017(1):51-64.
|
| [31] |
|
| [32] |
|
| [33] |
|
| [34] |
|
| [35] |
|
| [36] |
|
| [37] |
刘春阳, 杨培峰. 中外收缩城市动因机制及表现特征比较研究[J]. 现代城市研究, 2017(3):64-71.
|
| [38] |
董昕, 张朝辉, 周卫华. 为什么收缩城市的流动人口定居意愿更强?[J]. 中国人口·资源与环境, 2021, 31(3):43-51.
|
| [39] |
苏红键, 魏后凯, 邓明. 城市集聚经济的多维性及其实证检验[J]. 财贸经济, 2014(5):115-126.
|
| [40] |
|
/
| 〈 |
|
〉 |