
专精特新“小巨人”企业集聚的影响因素及分位异质性——基于分位数回归模型的实证研究
|
薄文广(1978—),男,博士后,副教授,硕士生导师,研究方向为区域经济发展。E-mail:boweng@nankai.edu.cn |
收稿日期: 2023-10-07
修回日期: 2023-11-24
网络出版日期: 2024-09-12
基金资助
国家社会科学基金项目(19BJY093)
Affecting Factors and Quantile Heterogeneity on the Agglomeration of Specialized and Sophisticated “Little Giant” Firms:An Empirical Study Based on Quantile Regression Models
Received date: 2023-10-07
Revised date: 2023-11-24
Online published: 2024-09-12
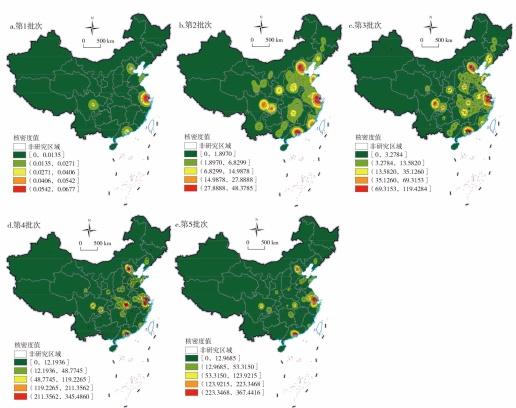
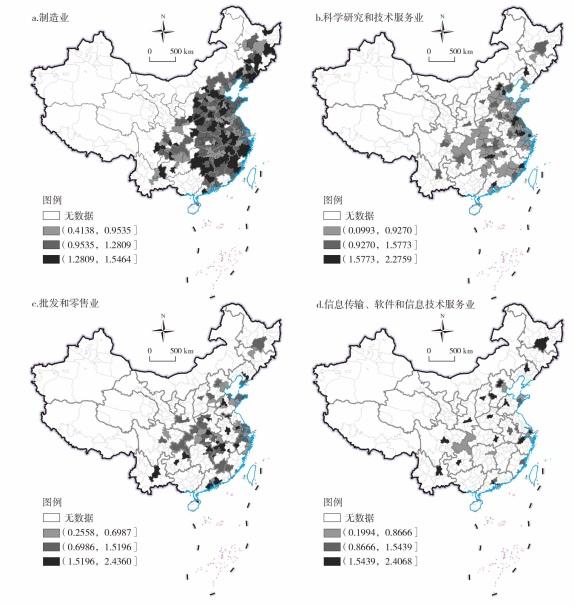
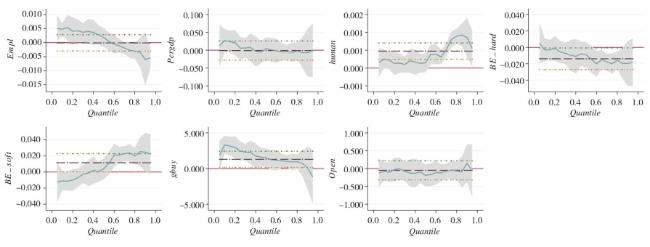
专精特新“小巨人”企业在促进我国中小企业转型升级以及补链、固链和强链中发挥着日益重要的作用。文章以工信部最新认定的5批次专精特新“小巨人”企业为研究对象,在刻画其区域和产业分布特征后,应用分位数回归模型,深入研究了“小巨人”企业集聚的影响因素及其在不同集聚分位上的作用异质性。结果表明:①不同批次“小巨人”企业区域分布具有鲜明的政策导向,且总体呈现东部地区遥遥领先,并高度集中于五大城市群内中心城市的聚集特征;行业分布则呈现制造业超过半壁江山,但比例轻微下降,生产性服务业比例稳步递增的趋势。②产业基础、经济环境、营商环境、政策环境等因素共同影响了“小巨人”企业集聚水平,且上述因素对于不同分位集聚水平的影响具有明显异质性。③产业基础和政策环境仅对低集聚度“小巨人”企业集聚水平提升有显著促进作用,经济发展水平对“小巨人”企业集聚度提升无显著促进作用,不存在“大者通吃”现象,人力资本水平对“小巨人”企业集聚度提升有显著促进作用,营商软环境仅对高集聚度“小巨人”企业集聚程度提升具有显著促进作用,且两者的影响均随集聚程度提高而增加。
薄文广 , 钱镱 , 刘璇 . 专精特新“小巨人”企业集聚的影响因素及分位异质性——基于分位数回归模型的实证研究[J]. 经济地理, 2024 , 44(3) : 55 -65 . DOI: 10.15957/j.cnki.jjdl.2024.03.006
The specialized and sophisticated "Little Giant" firms play an increasingly important role in promoting the transformation,upgrading and strengthening of supply chains for Chinese SMEs. This article takes the five batches of specialized and sophisticated "Little Giant" firms recently recognized by the Ministry of Industry and Information Technology as research objects. It analyzes the regional and industrial distribution characteristics,and uses the quantile regression model to study the affecting factors of enterprise agglomeration and the heterogeneity of their effects at different agglomeration levels. The results show that: 1) The regional distribution of "Little Giant" firms in different batches has distinct policy orientations,with a clear dominance in eastern regions overall,highly concentrates in central cities of the five major urban agglomerations. In terms of industry distribution,manufacturing industry accounts for more than half but with a slight decrease over time,while productive service industries show a steady increase proportionally. 2) Industrial foundation,economic environment,business environment,policy environment,etc,collectively affect the level of "Little Giant" firms agglomeration. Moreover these factors have obvious heterogeneity in their effects on different percentile levels of agglomeration. 3) Industrial foundation and policy environment only significantly promote low-level agglomerations among "Little Giant" firms. The economic development level has no significant effect on the improvement of the agglomeration degree of "Little Giant" firms (there is no "bigger one takes all" phenomenon). Human capital level has a significant effect on the improvement of the agglomeration degree of "Little Giant" firms. Business environment only significantly promotes the high-level agglomeration degree of "Little Giant" firms,the influences of human capital level and business environment both increase as aggregation increases.
表1 “小巨人”企业数量前10强的省份和城市Tab.1 Top 10 provinces and cities in terms of the number of “Little Giants” firms |
| 省份 | 江苏 | 广东 | 浙江 | 湖北 | 山东 | 北京 | 上海 | 安徽 | 湖南 | 四川 | 前10省份所占比例(%) |
|---|---|---|---|---|---|---|---|---|---|---|---|
| 数量(家) | 1513 | 1509 | 1457 | 1355 | 1056 | 839 | 710 | 616 | 531 | 453 | 74.20 |
| 城市 | 北京 | 深圳 | 上海 | 武汉 | 苏州 | 宁波 | 杭州 | 重庆 | 成都 | 天津 | 前10城市所占比例(%) |
| 数量(家) | 839 | 755 | 710 | 580 | 402 | 352 | 324 | 318 | 286 | 257 | 35.65 |
表2 专精特新“小巨人”企业行业分布占比 (单位:%)Tab.2 Percentage distribution of specialized and sophisticated "Little Giant" firms by industry (Unit:%) |
| 国标 代码 | 行业名称 | 第一 批次 | 第二 批次 | 第三 批次 | 第四 批次 | 第五 批次 | 总比例 |
|---|---|---|---|---|---|---|---|
| C | 制造业 | 70.61 | 63.68 | 63.33 | 58.75 | 66.34 | 62.60 |
| M | 科学研究和技术服务业 | 18.78 | 20.31 | 21.27 | 24.35 | 22.13 | 22.48 |
| F | 批发和零售业 | 7.76 | 10.33 | 8.88 | 8.63 | 1.99 | 7.13 |
| I | 信息传输、软件和信息技术服务业 | 2.45 | 2.93 | 3.99 | 4.55 | 5.48 | 4.43 |
| E | 建筑业 | 0.41 | 0.57 | 0.31 | 0.99 | 0.98 | 0.78 |
| N | 水利、环境和公共设施管理业 | 0.46 | 0.48 | 0.73 | 1.18 | 0.75 | |
| L | 租赁和商务服务业 | 0.75 | 0.65 | 0.77 | 0.14 | 0.56 | |
| D | 电力、热力、燃气及水生产和供应业 | 0.29 | 0.44 | 0.42 | 0.78 | 0.50 | |
| G | 交通运输、仓储和邮政业 | 0.14 | 0.12 | 0.39 | 0.18 | ||
| A | 农、林、牧、渔业 | 0.17 | 0.32 | 0.08 | 0.16 | ||
| B | 采矿业 | 0.17 | 0.10 | 0.08 | 0.34 | 0.16 | |
| O | 居民服务、修理和其他服务业 | 0.06 | 0.14 | 0.18 | 0.08 | 0.13 | |
| R | 文化、体育和娱乐业 | 0.11 | 0.03 | 0.04 | 0.06 | 0.05 | |
| J | 金融业 | 0.06 | 0.07 | 0.02 | 0.03 | 0.04 | |
| K | 房地产业 | 0.11 | 0.10 | 0.04 | |||
| H | 住宿和餐饮业 | 0.07 | 0.02 | 0.02 | |||
| Q | 卫生和社会工作 | 0.02 | 0.01 |
表3 影响因素选择及说明Tab.3 Selection and explanation of influencing factors |
| 维度 | 指标 | 变量符号 | 表征说明 |
|---|---|---|---|
| 产业基础 | 从业人数 | Empl | 细分城市—行业的从业人数 |
| 经济环境 | 经济发展 | Pergdp | 城市人均GDP |
| 人力资本 | Human | 每万人本专科在校学生数 | |
| 营商环境 | 营商硬环境 | BE_hard | 营商硬环境指数 |
| 营商软环境 | BE_soft | 营商软环境指数 | |
| 政策环境 | 政府支出 | Gbuy | 一般预算支出占GDP的比例 |
| 开放环境 | 对外开放 | Open | 城市进出口占GDP的比重 |
表4 变量的相关系数检验Tab.4 Correlation coefficient test for variables |
| Empl | Pergdp | Human | BE soft | BE hard | gbuy | Open | |
|---|---|---|---|---|---|---|---|
| Empl | 1.00 | ||||||
| Pergdp | 0.39*** | 1.00 | |||||
| Human | 0.20*** | 0.53*** | 1.00 | ||||
| BE_soft | 0.56*** | 0.68*** | 0.41*** | 1.00 | |||
| BE_hard | 0.54*** | 0.74*** | 0.58*** | 0.92*** | 1.00 | ||
| Gbuy | -0.13*** | -0.58*** | -0.28*** | -0.15*** | -0.29*** | 1.00 | |
| Open | 0.45*** | 0.47*** | 0.08 | 0.64*** | 0.56*** | -0.04 | 1.00 |
注:*、**和***分别表示在10%、5%和1%的显著性水平。表5同。 |
表5 分位数回归的检验结果Tab.5 Test results for quantile regression |
| 维度 | 变量符号 | 低集聚度 | 高集聚度 | |||
|---|---|---|---|---|---|---|
| Q10 | Q25 | Q75 | Q90 | |||
| 产业基础 | Empl | 0.0048***(3.04) | 0.0042**(2.40) | -0.0027(-1.63) | -0.0060*(-1.83) | |
| 经济环境 | Pergdp | 0.0270*(1.85) | 0.0057(0.35) | -0.0062(-0.40) | -0.0067(-0.22) | |
| Human | 0.0003**(2.05) | 0.0001(0.98) | 0.0008***(6.11) | 0.0009***(3.32) | ||
| 营商环境 | BE_hard | -0.0031(-0.43) | -0.0056(-0.70) | -0.0199***(-2.61) | -0.0197(-1.32) | |
| BE_soft | -0.0109*(-1.79) | -0.0070(-1.03) | 0.0237***(3.65) | 0.0246*(1.94) | ||
| 政策环境 | Gbuy | 3.3400***(5.43) | 2.4660***(3.60) | 0.9350(1.43) | 0.0646(0.05) | |
| 开放环境 | Open | -0.0771(-0.53) | -0.0014(-0.01) | -0.0409(-0.27) | 0.1490(0.49) | |
| 样本量 | N | 368 | 368 | 368 | 368 | |
注:本文选取10、25、75、90作为分位点,其中10和25分位等低分位点代表低集聚度,75和90分位等高分位点代表高集聚度;括号中的数字表示为t值。 |
| [1] |
李克强. 2022年政府工作报告[N]. 人民日报,2022-03-15(1).
|
| [2] |
丁建军, 王淀坤, 刘贤. 长三角地区专精特新“小巨人”企业空间分布及影响因素研究[J]. 地理研究, 2023, 42(4):1009-1028.
|
| [3] |
丁建军, 刘贤, 王淀坤, 等. 国家级专精特新“小巨人”企业空间分布及其影响因素[J]. 经济地理, 2022, 42(10):109-118.
|
| [4] |
张司飞, 陈勇岐. “专精特新”中小企业创新绩效提升路径研究[J]. 科学学研究, 2024(4):873-884,896.
|
| [5] |
安家骥, 刘国亮. 营商环境驱动专精特新企业创新的路径选择——基于FsQCA的定性比较分析[J]. 科学管理研究, 2023, 41(2):101-110.
|
| [6] |
王伟楠, 王凯, 严子淳. 区域高质量发展对“专精特新”中小企业创新绩效的影响机制研究[J]. 科研管理, 2023, 44(2):32-44.
|
| [7] |
朱小艳. “专精特新”企业数字化转型:现实意义、制约因素与推进策略[J]. 企业经济, 2023, 42(1):53-59.
|
| [8] |
余澳, 张羽丰, 刘勇. “专精特新”中小企业数字化转型关键影响因素识别研究——基于1625家“专精特新”中小企业的调查[J]. 经济纵横, 2023(4):79-89.
|
| [9] |
范剑勇, 刘念, 刘莹莹. 地理距离、投入产出关系与产业集聚[J]. 经济研究, 2021, 56(10):138-154.
|
| [10] |
王业强, 魏后凯. 产业特征、空间竞争与制造业地理集中—来自中国的经验证据[J]. 管理世界, 2007(4):68-77,171-172.
|
| [11] |
张晶, 陈海山. 新时期城市化推进过程中集聚阴影研究——基于高铁通车的视角[J]. 经济学(季刊), 2022, 22(1):281-302.
|
| [12] |
夏清华, 朱清. 增量提质:营商环境生态与专精特新企业——基于模糊集定性比较分析[J]. 经济与管理研究, 2023, 44(8):126-144.
|
| [13] |
朱秀梅, 历悦, 张越. 筑巢引凤: 城市营商环境对高成长创业企业涌现的影响[J/OL]. 外国经济与管理:1-17[2023-11-02].
|
| [14] |
夏永祥, 张雯. “一带一路”、开放环境与产业集聚发展[J]. 陕西师范大学学报:哲学社会科学版, 2019, 48(3):113-127.
|
| [15] |
刘婧, 甄峰, 张姗琪, 等. 新一代信息技术企业空间分布特征及影响因素——以南京市中心城区为例[J]. 经济地理, 2022, 42(2):114-123,211.
|
| [16] |
赵静平, 卢明华, 刘汉初. 北京上市公司总部空间分布特征及影响因素[J]. 经济地理, 2020, 40(1):12-20.
|
| [17] |
韦胜, 王磊, 曹珺涵. 长三角地区创新空间分布特征与影响因素——以“双创”机构为例[J]. 经济地理, 2020, 40(8):36-42.
|
| [18] |
沈泽洲, 王承云, 王永正. 中国大陆上市公司研发投入空间格局及动力机制——以500强为例[J]. 经济地理, 2020, 40(11):131-139.
|
| [19] |
|
| [20] |
|
| [21] |
刘涛, 刘嘉杰, 唐琳, 等. 北京市住宅租金影响因素空间分异研究[J]. 城市规划, 2023, 47(3):75-84.
|
| [22] |
严德成, 吴建伟. 区位条件对创新导向型企业社会网络的影响——兼论企业选址决策[J]. 华东经济管理, 2017, 31(5):66-71.
|
| [23] |
朱舜. 长三角及其经济腹地城市化空间格局优化的区域治理研究[J]. 中国行政管理, 2015(12):64-67.
|
| [24] |
罗若愚, 邹玲. 区域经济发展中区域合作治理的形成及影响因素分析——以长株潭和成渝经济区为例[J]. 经济问题探索, 2012(1):126-131.
|
| [25] |
林柄全, 谷人旭, 王俊松. 集聚经济与基于价值链的企业区位选择——重新发现内部集聚经济[J]. 经济地理, 2020, 40(4):56-64,74.
|
| [26] |
胡志强, 苗长虹, 华明芳, 等. 中国外商投资区位选择的时空格局与影响因素[J]. 人文地理, 2018, 33(5):88-96.
|
| [27] |
景国文. 低碳城市试点政策与FDI的区位选择[J]. 华东经济管理, 2021, 35(12):43-51.
|
| [28] |
彭如霞, 夏丽丽, 林剑铬. 创新政策环境对外商直接投资区位选择的影响——以珠江三角洲核心区六市为例[J]. 地理学报, 2021, 76(4):992-1005.
|
| [29] |
李志军. 2020·中国城市营商环境评价[M]. 北京: 中国发展出版社, 2021.
|
| [30] |
申烁, 李雪松, 党琳. 营商环境与企业全要素生产率[J]. 经济与管理研究, 2021, 42(6):124-144.
|
/
| 〈 |
|
〉 |